International Journal of Geosciences
Vol.4 No.3(2013), Article ID:31898,13 pages DOI:10.4236/ijg.2013.43059
Gold Mineralization Channels Identification in the Tindikala-Boutou Area (Eastern-Cameroon) Using Geoelectrical (DC & IP) Methods: A Case Study
1Department of Physics, Faculty of Science, University of Yaoundé I, Yaoundé, Cameroun
2Department of Physics, Advanced Teacher’s Training College, University of Yaoundé I, Yaoundé, Cameroun
3Department of Applied Geophysics, Geology and Mining Exploitation College, University of Ngaoundéré, Ngaoundéré, Cameroun
4Department of Earth Sciences, Faculty of Science, University of Yaoundé I, Yaoundé, Cameroon
Email: *tndougsa@ens.uniet.cm, *theopndougsa@gmail.com
Copyright © 2013 Daniel Hervé Gouet et al. This is an open access article distributed under the Creative Commons Attribution License, which permits unrestricted use, distribution, and reproduction in any medium, provided the original work is properly cited.
Received November 24, 2012; revised January 25, 2013; accepted February 23, 2013
Keywords: Geoelectrical Surveys; Direct Current; IP Method; Resistivity; Chargeability; Shear Zones; Gold Mineralization
ABSTRACT
To achieve the current study, geoelectrical surveys along six (06) profiles of 4 km long in a 100 m × 200 m grid defined according to the triangulation principle in the Ngoura area (Tindikala-Boutou villages) have been made through electrical sounding and profiling following Schlumberger array. The instrument is the resistivimeter Syscal Junior 48 (IRIS Instrument) which uses the electrical current. The data have been processed and modelled with Res2Dinv and Winsev softwares then interpolated with Surfer software. Electrical methods used are the Direct current (DC) and the Induced Polarization (IP). Interpretation and analyses of results from each investigation method highlight weak zones or conductive discontinuities and mineralized zones. Conductive zones have been identified as shear zones within granitic structures of the Precambrian basement, according to the geologic and tectonic background of the area. The structural trend of these shear zones is E-W. The mineralization within it is N-S and characterized by high values of chargeability, essentially in the eastern part of the area under study. This mineralization proves the presence of metalliferous or sulphide heaps disseminated in weathered quartz veins which cross shear zones. Also, the poor mineralization and conductive structures in shear zones characterize the groundwater zones. The intense activities of gold washers encountered in the area enable to link that mineralization to gold within quartz veins. The near surface gold mineralization is eluvial or alluvial, and in depth this mineralization is primary.
1. Introduction
Knowing the nature of the mineralization and its origin is a key factor in mining exploration in a given area. It enables future exploration and gives an idea upon the mining potential of the region. In accordance with this, a geoelectrical investigation has been made in the Tindikala village neighbourhood (Boutou area). The approach consists in collecting apparent resistivity data and chargeability using the Schlumberger geoelectrical investigation (sounding and profiling) combining the electrical direct current and induced polarization methods. Data will be processed with Res2Dinv, Winsev and Surfer softwares.
Results, given as pseudo sections (of resistivity & chargeability) and, resistivity and chargeability maps will enable to plot tectonic unevenness of the area under study, and they will enable to characterize the associated mineralization. The geological sections realized through the interpretation of electrical soundings will bring out the correlation between the resistivity data and the geological background of the studied area.
2. Geological and Tectonic Setting
The study area (Tindikala-Boutou villages) is located in the Ngoura subdivision within the East Cameroon region. Its easting stretches from 426,000 m to 437,800 m and the northing from 548,750 m to 557,750 m following UTM33 WGS84 system (Figures 1 and 2). The region is characterized [1] by a tropical climate marked by four seasons divided into two dry and rainy seasons. The vegetation cover is the savanna. The topography is relatively uniform, with an average altitude ranging from 700 m to 800 m above sea level. The hydrographical system in the survey area (Figures 1(a) and 2) consists of Kadey river as a main river and Gambadi, Bonianga and Tindikala streams as branch [1].
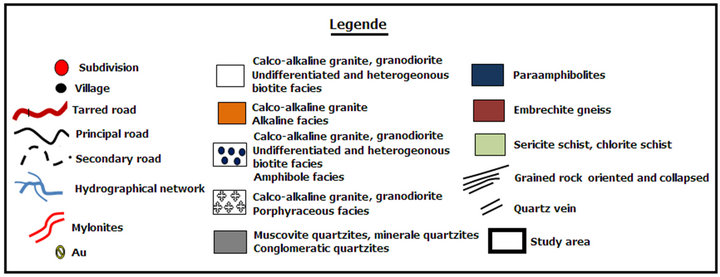
The Ngoura subdivision is located in the transition zone between the Pan African domain and the Congo Craton [2,3], in the northern edge of the Cameroon faults’ zone. This region of Cameroon is essentially made up of a Precambrian basement comprising metamorphic and magmatic rocks [2,4-6]. These rocks belong to several epochs of the Precambrian and sometimes outcrop. These are mainly granites and migmatites rejuvenated during the panafrican event [2,3]. The Ngoura area is mainly made up of (Figure 1(a)):
- Biotite and muscovite quartzites, muscovite sericitic and conglomeratic quartzites, chloritic and sericitic schists, paraamphibolites, orthogneisses, biotite gneisses and, pegmatites and quartz veins [7] constituting the precambrian basal complex aged between 2.5 and 1.8 billion years. Pegmatite and quartz veins (Figure 1(b)) are observed on site, and are considered to be main primary sources of gold deposit in the area [1,8];
- Plutonic and metamorphic formations [7,9] made up of calc-alkaline granites with a porphyroic and alkali facies; granodiorites and syenites containing heterogeneous and undifferentiated biotite facies; quartzdiorites; micaschists, migmatites and embrechite gneisses;
- The main sedimentary rocks encountered are sandstones, sand, marl, limestones and, Paleozoic and Mesozoic conglomerates [7,9].
The soils are red ferrallitic on the hills and the plateaus. The geological section of the study area can be seen in the boreholes cross section Pt01, Pt02, Pt03 and Pt04 (Figure 3) a team composed of personnel from Cameroon Mining & Geology Directorate and BRGM’s [8].
The tectonic facts revealed that, the study area is characterized by four deformations phases D1-D4 [4,6,10]. The observed tectonic lines are directed SW-NE below, and turned to be SE-NW above the 4˚N parallel (Figure 1). Previous geophysical studies [10,11] have shown evidence of some buried faults directed W-E and have confirmed tectonic nappes with a southern vergency. According to geological [6], the Pan-African deformation affecting the study area which appertains to the southern segment of the Neoproterozoic fold belt of Central Africa in Cameroon, is controlled by thrust tectonics and late strike-slip shear zones: the thrusting of the Pan-African Nappe over the Congo Craton (D2 deformation phase) is followed by a strike-slip shearing trending ENE-WSW (D3 deformation phase). During these stages deforming conditions were ductile to brittle-ductile. The dominant structural features of the D3 phase are penetrative foliation steeply dipping N or S, an associate ENE-WSW stretching lineation, and an N-S to NE-SW folding. Deformation criteria in the distinguished rock units indicate dextral sense of shear. A dextral trans-pressional model is assumed [6] to explain the observed thrust and shear movements.
Few metallogenetic data concerning gold mineralization are available. This constation is the reason why the present study will combine direct current and induced polarization methods, in order to identify structural facts where potential gold mineralisation can be found.
3. Methods
3.1. Direct Current
The resistivity of materials is a good indicator and parameter for the nature and the weathering. Hence electrical prospecting methods have been used for a long time in geological and geotechnical engineering [12,13]. These methods, both qualitative and quantitative, are based on the Ohm law [12,13]. They consist in the injection of a direct current in the ground and the measurement of the electrical potential which enables to obtain the true resistivity of encountered formations [12,13]. In our study area, while considering the geological setting, Schlumberger sounding and profiling methods have been used to determine: the thickness, the lateral extension and the nature of formations encountered along a profile; and to highlight the geometry of geological bodies related to contrasted electrical characteristics [12,13].
Field electrical methods (DC) consist in injecting an electrical current in the ground between two electrodes A and B, and then, measuring the induced potential drop between two so-called potential electrodes M and N [12, 13]. For the current intensity is known and the potential drop measured, it is therefore possible to determine the ground apparent resistivity [13]. This apparent resistivity depends on the current and potential electrodes array. The apparent resistivity ρa (Rho) can be expressed as a function of the potential drop and the current intensity [14]:
 (1)
(1)
where ρa is in Ohm∙m, and K (in m) is the geometric factor depending on the electrodes’ array which is given by the formulae 2 below.
 (2)
(2)
- VMN: potential drop between electrodes M and N, in mV.
 (a)
(a)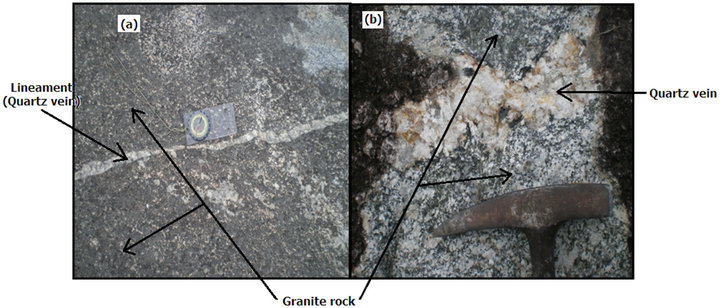 (b)
(b)
Figure 1. (a) Geological map of the study area; (b) (1)-(2) Quartz veins cross granite rock in the Tindikala-Boutou area.
- IAB: electric current injected between electrodes A and B, in mA.
For the Schlumberger symmetrical configuration (Figure 4), the apparent resistivity ρa is given by Equation (3) as follow [13,15]:
 (3)
(3)
This resistivity value enables to characterize a formation at a given position (O) or station (Figure 4). The resistivity of an earth’s material depends essentially on
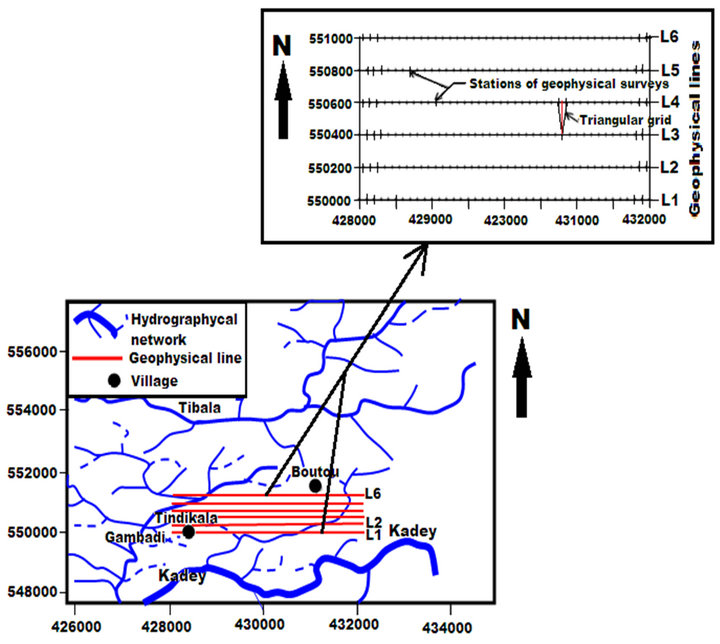
Figure 2. Profiles localization map in the study area.
the humidity and the clay proportion for a given volume of that material [13,16]. While clay and water fill in any vacuum in a rock, one assumes that the resistivity is function of parameters such as fracturing, fractures and fissures clay filling in, porosity, the clayey clogging of alluvium [4,12,13,16].
3.2. Induced Polarization (IP)
The induced polarization (IP) method ameliorates electrical methods by measuring the apparent chargeability or chargeability M of the earth material [17,18]. Chargeability enables to assess the earth’s capability to accumulate and return an electric current so do a capacitance when currents are injected then interrupted [15,18]. The chargeability is measured by a ground injection of electric signal gaps (current (I)) using two injection electrodes A and B while the potential drop is measured using two receiving electrodes M and N (Figure 4). When IP effects occur, a voltage decreasing curve Vs(t) is observed at the receiving electrodes M and N during current stops between each gap [15,18].
The chargeability M is defined as the ratio of seconddary voltage (Vs) measured at a moment t after the current stoppage, over the primary voltage (VMN) measured before this break [15,18]:
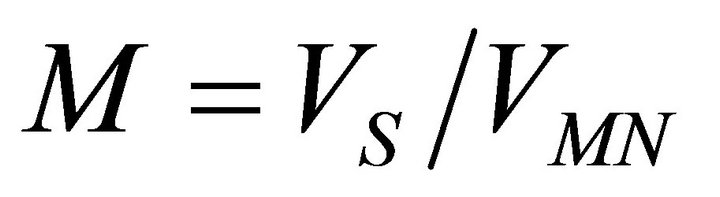 (4)
(4)
The secondary voltage can be measured at a single point after the stoppage of the current, but it is wise to wait a bit for measurement to be reliable [12,15]; then the area below the curve can be calculated. The chargeability
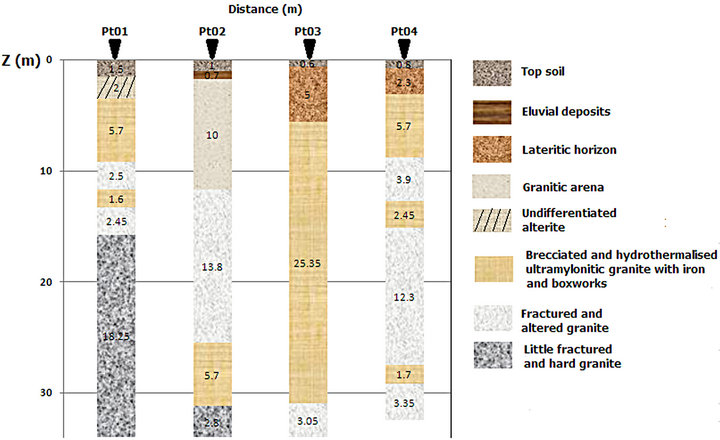
Figure 3. Geological sections of boreholes in the Tindikala-Boutou area from previous work [8].
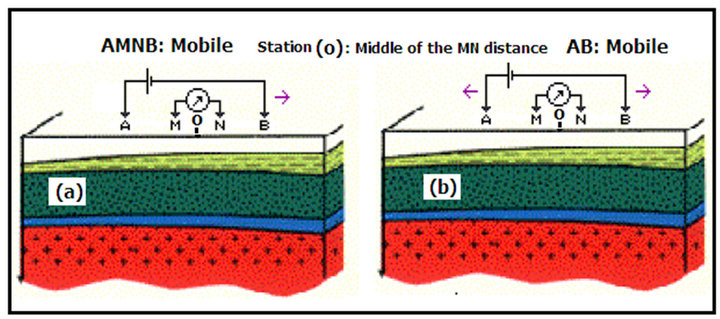
Figure 4. (a) Schlumberger electrical profiling; (b) Schlumberger electrical sounding.
is given by the formulae below:
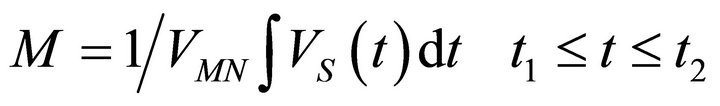 (5)
(5)
It appears that this value is independent of the current injected in the earth. A time dependent transformation is often made in order to enable chargeability values to be comparable from one instrument to another [12,15]. So, the chargeability expression becomes:
The chargeability unit is generally mV/V.
The flow of the electrical current within ground goes along with electrochemical processes whose intensity and characteristics are function of physical and chemical properties of the earth material. This current’s flow can follow two patterns as stated by many authors [12,15, 18]:
- By electrical conductibility for which free electrons’ motion occurs in metallic particles (pyrite, chalcopyrite, ...);
- By electrical conductibility for which ions’ displacement occurs in the fractures and pores fluid contents of rocks.
The induced polarization causes electrochemical processes occurring when the current flows from an ionic conductibility medium (water) to an electronic conductibility medium or, from an ionic conductibility medium to a low conductive medium, or with a contact between two different ionic conductibility media [12,15,18].
4. Material and Data Acquisition
For a suitable coverage of the study area, data have been collected through 236 geoelectrical surveys along six (06) profiles of 4 km long in a 100 m × 200 m grid, defined according to the triangulation principle (Figure 2). This grid has been designed according to the topographic data of the area whose coordinates have been expressed in UTM33 WGS84. The data acquisition is made by combining electrical sounding and profiling through the Schlumberger configuration (Figure 4) along the geophysical profiles [12,13]. The AB maximum length was held at 600 m to target lithological formations at an approximate depth ranged between 114 and 128 meters [19]. To avoid miscellaneous due to formations’ anisotropies, sounding and profiling surveys were E-W oriented (Figure 2).
We used the direct current resistivimeter, Syscal Junior 48 (IRIS Instrument) and its accessories. This system runs under the Rho & IP mode which enables the simultaneous measurements of the resistivity (Rho) and the chargeability (M) of ground structures. Chargeability measurements are sensitive to the induced electromagnetic field fluctuations and sometimes to the local ground resistivity [15,19]. Thus, electrical data acquisition is made using both the Schlumberger direct method during which the current is injected through A and B electrodes, and the Schlumberger reverse method, for which the current is injected through receiving electrodes M and N [16,]. The uniqueness of solutions from either of methods above for the same array is governed by the superimposition and the reciprocity principles [16]. The apparent resistivity and chargeability data from Schlumberger electrical profiles were processed and modelled using the GEOTOMO Res2Dinv software [20,21] to obtain pseudosections or inverse pseudosections that reflect the true resistivity and the true chargeability values of subsurface structures studied [20,21]. The electrical soundings were interpreted using WinSev software from Geosoft [22] which permits to obtain the depth distribution of layers for each station (Figure 4). Resistivity and chargeability maps were plotted using Surfer software [23] which determines the spatial distribution of resistivity and chargeability by interpolating their values in the area under study [13,23].
5. Results
5.1. DC Analyses
5.1.1. Pseudo-Sections
Geoelectrical sections presented on Figures 5(a)-(c), 6(a)-(c) and 7(a)-(c) correspond respectively, to profiles L1 to L6. They were plotted using Res2Dinv. On these figures, the investigation depth reached is approximately 128 m for each profile. This depth corresponds to the maximum cable length (AB = 600 m) according to XL position along a profile.
Observing the L1 profile (Figure 5(a)), the resistivity is slightly low (Rho < 1500 Ω∙m) from near subsurface to about 40 m depth in the eastern part and less than 20 m in the western part. Downward along E-W, one notices a bedding of layers and an increase of resistivity values above 10,000 Ω∙m. These resistive and bedded layers suggest unweathered granitic structures [12,24].
Along the profile (1100 < XL < 1900 m), the resistivity is fairly low (Rho < 2500 Ω∙m) and iso-resistivity lines are nearly subvertical. Low resistivity values and the shape of iso-resistivity curves are significant to a weakness zone or conductive discontinuity [25]. It can exhibit a fracture, a fault or a shear zone along the profile as suggested by some aproaches [12,24,25].
N-oriented, profiles L2 and L3 (Figures 5(c) and 6(a)) clearly highlight a strong resistivity contrast. The western part of the area under study (0 < XL < 2100 m) is generally low resistive (Rho < 2500 Ω∙m). The XL width increases progressively from profile L2 to profile L3. The electrical responses of these profiles (L2 and L3) look like resistive bedded layers (Rho > 3000 Ω∙m) in the eastern side (2500 < XL < 3800 m and XL > 3000 m). Effects of these layers go downward to deep structures and they are evidences of unweathered granitic structures which sometimes outcrop [12,24]. The bedding and the resistance of layers disappear at the west of profiles L2 and L3; and a weakness, an accumulation or infiltrations’ zone sets itself progressively [12]. Thus, in some parts of the area, there are resistive shallow deposits (Rho > 3000 Ω∙m) which may be laterite layers [12,13,26].
Along profiles L4 and L5 (Figures 6(c) and 7(a)) deep structures are low resistive. They are bounded top and down by resistive structures. This structural geomorphology characterizes an accumulation zone of weathered structures or a fluids infiltration’s zone [12,24]. Meanwhile around 630 m and 450 m, we observes an involvement of deep resistive materials on surface which is characterized by conic domes along profiles L4 and L5 respectively (Figures 6(c) and 7(a)).
On profile L6 (Figure 7(c)), granitic structures characterized by high resistivity values (Rho > 3000 Ω∙m) cover the centre (1250 < XL < 2250 m). Weakness zones or discontinuities characterized by low resistivity values (Rho < 2500 Ω∙m) cover the two ends of the profile (0 < XL < 1250 m) and (1250 < XL < 3500 m).
5.1.2. Resistivity Map
Figure 8 represents the space distributions of the resistivity computed by the surfer software for three bands of layers according to depth levels corresponding to the three arrays used: AB = 50 m and MN = 5 m, AB = 300 m and MN = 30 m, AB = 500 m and MN = 50 m. These arrays represent depths 9.5 m, 57 m and 95 m respectively [19].
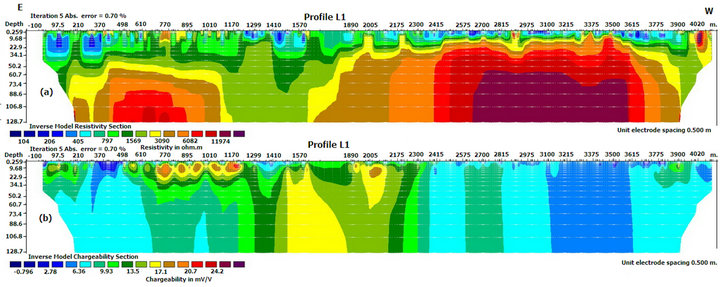
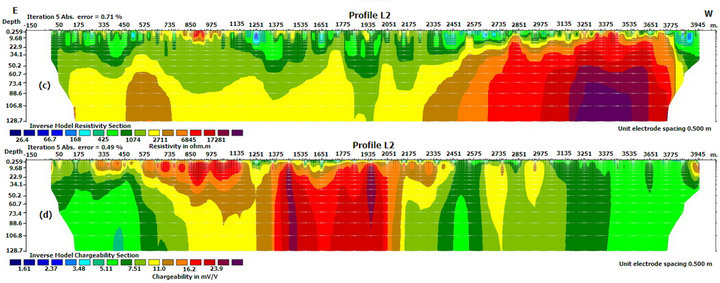
Figure 5. (a)-(c) Pseudo-sections of Apparent Resistivity (Profiles L1&L2); (b)-(d) Pseudo-sections of Chargeability (Profiles L1&L2).
In the centre of the study area and along the E-W direction, resistivity maps highlight (Figure 8) a conductive discontinuity characterized by low resistivity values (Rho < 1500 Ω∙m).
The extension of this area decreases to deep structures (Figure 8). It is located at boundaries of resistive zones characterized by high resistivity values (Rho > 2500 Ω∙m) and narrowing of iso-resistivity curves. This curves’ narrowing proves an inner to outer variation of geological structures [12,24] along the N-S trend. Central structures materialize decayed rocks, accumulation or infiltration structures [12,24]. They show up the presence of weakness zones in the central part of the study area. The resistive structures bounding that zone characterize fresh granitic formations [12,24].
5.1.3. Geological Section
The interpretations of electrical sounding curves from the study area and geological surveys have permitted to realize the geological sections of the subsurface crossed by profiles L2 and L4 (Figures 9 and 10). This has been done base on the approaches developed by scientists [16, 17,27]. These geological sections quantitatively illustrate the geology of the area. East of profile L2 geological section, the geological profiling shows a four layered model’s structure (Figure 9). The superficial layer or topsoil lies on a lateritic cover with a variable thickness which remains less than 10 m (Figure 9). The third layer corresponds to a weathered or conductive layer. It lies on the basement. To the western part of profile L2 cross section, the geological profiling shows three layers (Figure 9). The superficial layer or topsoil lies on the slightly thick weathered granite. The third layer represents the rocky or granitic basement. The geological section of profile L4 (Figure 10) is similar to the eastern part of profile L2 geological section. The weathered layers or conductive layers evidenced by geological sections permit to highlight tectonic unevenness of the previous
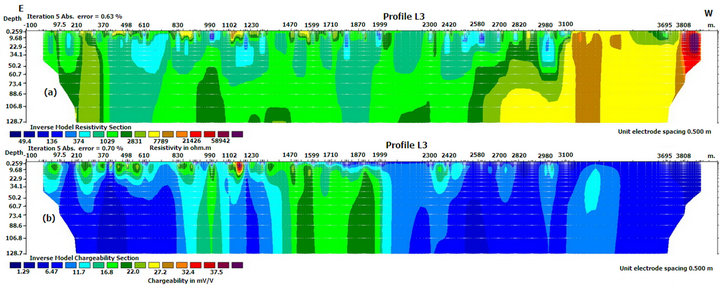
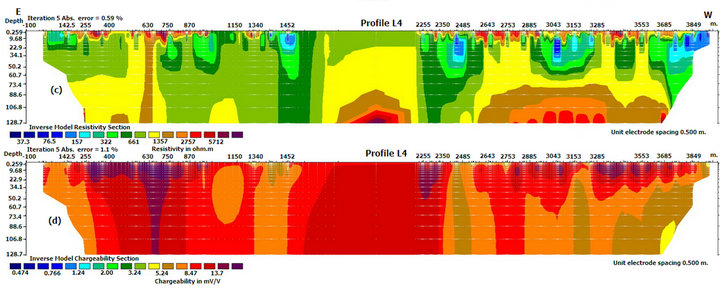
Figure 6. (a)-(c) Pseudo-sections of Apparent Resistivity (Profiles L3&L4); (b)-(d) Pseudo-sections of Chargeability (Profiles L3&L4).
results [10,11,28].
5.2. Induced Polarization (IP)
5.2.1. Pseudo-Sections
IP sections provided by Figures 5(b)-(d), 6(b)-(d) and 7(b)-(d) also correspond to profiles L1 to L6. They have been mapped using Res2Dinv software [20]. On them, the investigation depth reached is the same as that of DC electrical sections for the same injection array.
The chargeability contrast is highlighted when observing profile 1 (Figure 5(b)). For this purpose, two chargeability anomalies (M > 12 mV/V) can be outlined: a shallow anomaly (depth < 35 m; 500 < XL < 1200 m) and a deep anomaly (depth > 120 m; 1400 < XL < 2200 m). These anomalies gradually increase northward cutting profiles L2, L3, L4, L5 and L6 (Figures 5(d), 6(b)-(d), 7(b)-(d)). During this evolution, lateral and depth extensions increase considerably and the shift between anomalies decreases. Anomalies are less perceptible on profile L4 (Figure 6(d)) as it crosses a swamp where it was impossible to carry out measurements. The deviation between both anomalies becomes significant on profile L6, and, the East-profile’s anomaly is less perceptible and shallower. These anomalies may be an evidence of clayey, metalliferous or sulphide intrusions in the formations of the area under study [12,24,29,30].
5.2.2. Chargeability Map
Figure 11 also represents the space distribution of the chargeability obtained by interpolating with Surfer software for the same depth level considered as above.
Observation of the chargeability maps (Figure 11) at great depths (AB = 300 m and AB = 500 m) shows that, the western part of the study area is characterized by low values of the chargeability (M < 12 mV/V) while the eastern part is characterized by relatively high values and a narrowing of iso-chargeability curves. Observing the
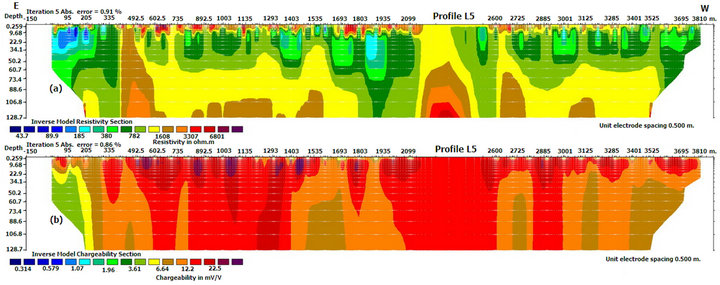
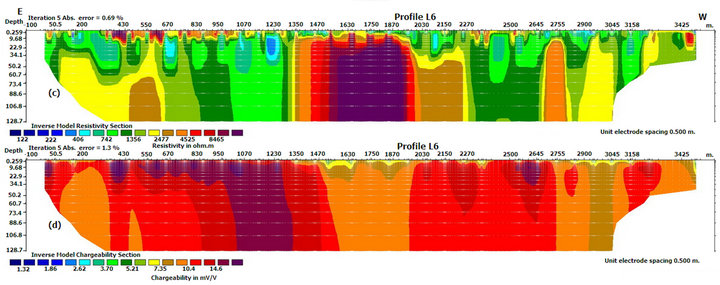
Figure 7. (a)-(c) Pseudo-sections of Apparent Resistivity (Profiles L5&L6); (b)-(d) Pseudo-sections of Chargeability (Profiles L5&L6).
chargeability map (Figure 11) at low depth (AB = 50 m), the polarization is low in the south-western part (M < 12 mV/V) of the area and high (M > 13 mV/V) in almost the whole eastern part. Discontinuous narrowing of iso-chargeability curves are also noticed at the east of the study area. The iso-chargeability curves’ shapes reveal an N-S increase of the polarization in spite of its E-W overlapping. The resulting interpretation suggests, according to the space distribution of the polarization, the presence of sulphide, clayey or metalliferous heaps within structures detected at eastern part of the study area [18,29,30]. The shape of iso-chargeability curves suggests a structural variation of the area’s subsurface [12,13]. As to western structures, low chargeability values prove low mineralogical potentiality [18,29,30].
6. Discussion
The analyses of resistivity and chargeability variations through pseudo-sections provide quantitative and quailtative information upon the conductivity and the chargeability of the studied area subsurface. During these analyses, we have delineated two different geological zones:
- The first zone is characterized by high resistivity bedded structures. It fits the geological background of unweathered granitic structures which sometimes outcrop [12,24]. The mineralization characterized by chargeability values exhibits a low grade ore occurrence in the area [12,18,29,30].
- The second zone is characterized by low resistive structures. It fits weakness zones or conductive discontinuities or [12,24]. The tectonic setting of the study area enables to match these weakness zones with shear zones [10,11,28,31]. In these places, fluids infiltration’s ability is considerable, thus increasing the weathering ability of in situ metamorphic or magmatic structures. The polarization reveals two mineralization channels which communicate through a barren zone. These channels characterize sulphide heaps,
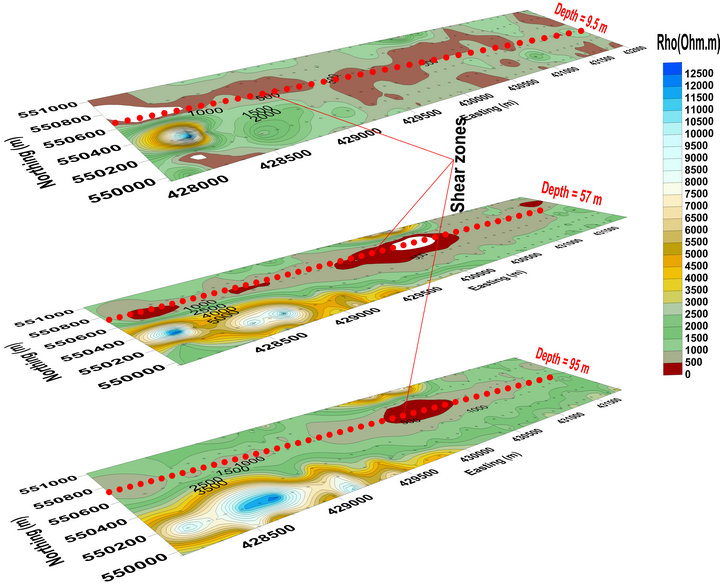
Figure 8. Resistivity maps of AB = 50 m, AB = 300 m and AB = 500 m.

Figure 9. Geological section along of the profile L2.
clayey or metalliferous intrusions inside barren structures of the granitic basement which underwent shear and weathering process of shallow structures [12,29, 30].
In addition, analyses of the resistivity and chargeability variations through resistivity and chargeability maps show that the space distributions of resistivity and chargeability, for each subsurface level, are not uniform. The resistivity contrasts highlight weakness zones or fluids’ infiltration zones within granitic structures [12,24]. These weakness zones considered as tectonic unevenness also characterize shear zones with a high accumulation capability of in situ weathered or dissolved structures [12, 24]. They are located at the middle of the study area and have an E-W strike. The mineralization characterized by high chargeability values is located in these shear zones,
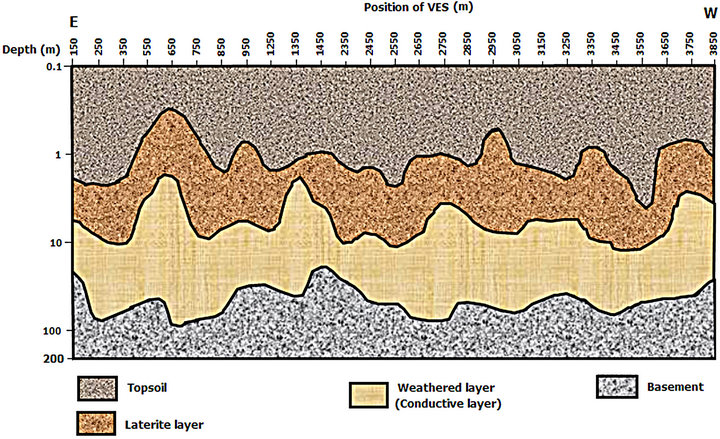
Figure 10. Geological section along of the profile L4.

Figure 11. Chargeability maps of AB = 50 m, AB = 300 m and AB = 500 m.
principally at the east of the study area [12,18,30]. It brings to the light two N-S polarisable axes which may reflect the presence of polarisable thin minerals disseminated (sulphides, magnetite, graphite, pyrite, gold...) as well as sulphides bearing shear zones [18,24,29,30]. Areas with strong chargeability responses are the most interesting because they may contain significant quantity of mineralization [18,29,30].
In the mining and hydrogeological researches, weathered layers or conductive layers (Figures 9 and 10) characterize the target zones [16,17,24,32]. They are identified as mineralogical deposits and groundwater zones for the mining and hydrogeological researches respectively [16,17,24,32]. We suggest that areas on Figures 5-7 having both high conductivity (low resistivity) and high IP response (high chargeability) may represent concentrations of sulfide minerals [12,24,29,30,32-34]. Areas with high conductivity but low IP response may represent areas with sulfate minerals which characterize groundwater zones [32,33]. Concentrations of sulfide minerals characterize the gold mineralization in the study area.
The main mining activity in the weakness or shear zones of the study area is that practiced by gold washers along stream banks [1,8]. Hence it enables to correlate the main mineralogical nature occurring in the study area to gold bearing structures located in weathered quartz veins [1,8,29,30]. The near surface (depth < 30 m) gold mineralization (Figure 11) is identified as an eluvial or alluvial mineralization [34]. In depth (depth > 30 m), the gold mineralization (Figure 11) is identified as a primary mineralization [35,36].
The results obtained by combining the analysis of IP and VES data modeling are in accordance with the boreholes stratigraphy (Figure 3) derives from drilling realized during the auriferous campaign of the Geology & Mining Directorate and the BRGM [8] in 1986.
7. Conclusion
The electrical data acquisition (sounding and profiling) following Schlumberger array in the Tindikala-Boutou area (Ngoura subdivision) through the direct current and induced polarization methods, using the Syscal Junior 48 resistivimeter (IRIS Instrument), permitted to identify the tectonic unevenness and to characterize its mineralogical nature. These features come from pseudo-sections (of resistivity and chargeability) and the resistivity and chargeability maps. Analyses and interpretations made through different results from the modelling of geoelectrical sounding and profiling highlight weakness zones or conductive discontinuities. In these zones, the geological sections bring out the weathered layers or conductive layers which constitute the target zones for mining and hydrogeological researches. It fits, according to the geological and tectonic background of the area, with E-W shear zones within the Precambrian granitic basement. The mineralization strike in the area is N-S. It is characterized by high chargeability values which prove the existence of sulphide or metallic heaps in weathered quartz veins within shear zones. The mining activities of gold washers in the area under study allow us to state that these are gold bearing quartz veins. The near surface gold mineralization is eluvial or alluvial, and in depth this mineralization is primary. The geological cross section from geoelectric interpretation is in agreement with the boreholes stratigraphy (Figure 3) derives from previous drilling campaign realized in 1986 [8].
8. Acknowledgements
The authors are grateful to the two reviewers for their kind remarks making the manuscript clearer and more pertinent. The authors are also grateful to the Artisanal and Small Scale Unit of the Ministry of Mines, Industry & Technological Development for providing the Syscal Current Iris instrument to collect the data sets on site.
REFERENCES
- S. Kim, M. J. Yoon, S. G. Kim and D. J. Kwon, “Exploration Report Colomine Placer Gold Project Cameroon,” Geotech Consultant Co., Ltd., Seoul, 2009, p. 87.
- M. Cornachia and R. Dars, “Un Trait Majeur du Continent Africain. Les Linéaments Centrafricains du Cameroun au Golfe d’Aden,”Bulletin of Social Géology, Vol. 7, No. 1, 1983, pp. 102-109.
- P. Rolin, “La Zone de Décrochement Panafricain des Oubanguides en République Centrafricaine,” C.R. Academy Scioety, Paris, 1995.
- H. Mvondo, S. W. J Den-Brok and J. Mvondo-Ondoa, “Evidence for Symmetric Extension and Exhumation of the Yaoundé Nappe (Pan-African Fold Belt, Cameroon),” Journal of African Earth Sciences, Vol. 35, No. 3, 2003, pp. 215-231. doi:10.1016/S0899-5362(03)00017-4
- H. Mvondo, S. Owona, J. Mvondo-Ondoa and J. Essono, “Tectonic Evolution of the Yaoundé Segment of the Neoproterozoic Central African Orogenic Belt in Southern Cameroon,” Canadia Journal of Earth Sciences, Vol. 44, No. 1, 2007, pp. 433-444. doi:10.1139/e06-107
- J. B. Olinga, J. E. Mpesse, D. Minyem, V. Ngako, T. Ndougsa-Mbarga and G. E. Ekodeck, “The Awaé-Ayos StrikeSlip Shear Zones (Southern-Cameroon): Geometry, Kinematics and Significance in the Late Panafrican Tectonics,” Neues Jahrbuch für Geologie und PaläontologieAbhandlungen, Vol. 257, No. 1, 2010, pp. 1-11.
- J. M. Regnoult, “Synthèse Géologique du Cameroun,” 1986.
- J. Vairon, A. Edimo, Y. Simeon and P. Vadala, “Protocole D’accord ‘Pour la Recherche des Minéralisations d’or Dans la Province Aurifère de l’Est’ Cameroun,” Rapport du BRGM, Mission Or Batouri, Deuxième et Troisième phase, 1986.
- J. Gazel and C. Giraudie, “Notice Explicative sur la Ré- gion Abong-Mbang Ouest de la Carte Géologique de Reconnaissance,”Mémoire du BRGM, No 92, Direction des Mines et Géologie, Yaoundé, Cameroun, 1965, 29 p.
- A. Meying, T. Ndougsa Mbarga and E. Manguelle-Dicoum, “Evidence of Fractures from the Image of the Subsurface in the Akojolinga-Ayos Area (Cameroon) by Combining the Classical and the Bostick Approaches in the Interpretation of Audio-Magnetotelluric Data,” Journal of Geology and Mining Research, Vol. 1, No. 8, 2009, pp. 159-171.
- T. Ndougsa-Mbarga, A. Meying, D. Bisso, D. Y. Layu, K. K. Sharma and E. Manguelle-Dicoum, “Audiomagnetotellurics (AMT) Soundings Based on the Bostick Approach and Evidence of Tectonic Features along the Northern Edge of the Congo Craton, in the Messamena/AbongMbang Area (Cameroon),” Journal of Industrial Geophysical Union, Vol. 15, No. 3, 2011, pp. 145-159.
- P. Keary and M. Brooks, “An Introduction to Geophysical Exploration,” 2nd Edition, Blackwell Scientific Publications, London, 1991, 254 p.
- D. S. Parasnis, “Principles of Applied Geophysics,” 5th Edition, Chapman and Hall, London, England, 1997, pp. 104-176.
- S. H. Ward, “Resistivity and Induced Polarization Methods,” In: S. H. Ward, Ed., Geotechnical and Environmental Geophysics, Society of Exploration Geophysicists, Tulsa, 1990, pp. 147-190.
- J. Kiberu, “Induced Polarization and Resistivity Measurements on a Suite of near Surface Soil Samples and Their Empirical Relationships to Selected Measured Engineering Parameters,” MSc Thesis Submitted at ITC, Enschede, 2002.
- D. Chapellier, “Prospection Electrique en Surface. Cours de Géophysique,” Université de Lausanne, Institut Fran- çais de Pétrole, 2000/2001.
- J. B. Fink, E. O. McAlester., B.K. Sternberg, S.H.Ward and W.G. Wieduwilt, “Induced Polarization, Applications and Case Studies,” Society of Exploration Geophysicists, Tulsa, Oklahoma, 1990, pp. 414.
- J. S. Sumner, “Principles of Induced Polarization for Geophysical Exploration,” Elsevier, Amsterdam, 1976.
- M. H. Loke, “Electrical Imaging Surveys for Environmental and Engineering Studies. A Practical Guide to 2-D and 3-D surveys,” 2000.
- M. H. Loke, “Res2Dinv ver. 3.59 for Windows XP/Vista/7, 2010. Rapid 2-D Resistivity & IP Inversion Using the Least-Squares Method. Geoelectrical Imaging 2D & 3D Geotomo Software,” 2010.
- M. H. Loke and R. D. Barker, “Rapid Least-Squares Inversion of Apparent Resistivity Pseudosections by a Quasi-Newton Method,” Geophysical Prospecting, Vol. 44, No. 1, 1996, pp. 131-152. doi:10.1111/j.1365-2478.1996.tb00142.x
- J. Jenny and M. Borreguero, “Winsev 5, 1-D Inversion Software,” 1999.
- Surfer, “Version 7.00, Surface Mapping System Copyright © 1993-1999,” Golden Software, Inc., Colorado, 1866.
- M. A. Meju, “Geoelectromagnetic Exploration for Natural Resources: Models, Case Studies and Challenges,” Surveys in Geophysics, Vol. 23, No. 2-3, 2002, pp. 133-205. doi:10.1023/A:1015052419222
- I. F. Louis, D. Raftopoulos, I. Goulis and F. I. Louis, “Geophysical Imaging of Faults and Fault Zones in the Urban Complex of Ano Liosia Neogene Basin, Greece: Synthetic Simulation Approach and Field Investigations,” Journal of Electrical & Electronics Engineering, 2002, pp. 269-285.
- J. C. Egbai, “Vertical Electrical Sounding for the Investigation of Clay Deposit in Orerokpe, Delta State,” Journal of Emerging Trends in Engineering and Applied Sciences, Vol. 2, No. 2, 2011, pp. 260-265.
- J. O. Coker, “Vertical Electrical Sounding (VES) Methods to Delineate Potential Groundwater Aquifers in Akobo Area, Ibadan, South-Western, Nigeria,” Journal of Geology and Mining Research, Vol. 4, No. 2, 2012, pp. 35-42.
- S. Mbom-Abane, “Investigation Géophysique en Bordure du Craton du Congo (région d’Abong-Mbang/Akonolinga, Cameroun) et Implications Structurales,” Thèse Doctorat d’Etat ès Sciences, University, de Yaoundé I, Fac. Sciences, 1997.
- J. R. Holliday and D. R Cooke, “Advances in Geological Models and Exploration Methods for Copper ± Gold Porphyry Deposits,” Ore Deposits and Exploration Technology, Paper 53, 2007, pp. 791-809.
- H. Salmirinne and P. Turunen, “Ground Geophysical Characteristics of Gold Targets in the Central Lapland Greenstone Belt,” Geological Survey of Finland, Special Paper 44, 2007, pp. 209-223.
- A. M. Ngando, Nouayou R., T. C. Tabod and E. ManguelleDicoum, “Evidence for Precambrian Faulting in the Tibati Adamawa Region of Cameroon Using the Audiomagnetotelluric Method,” Geofísica International, Vol. 50, No. 2, 2011, pp. 129-146.
- D. L. Campbell and D. V. Fitterman, “Geoelectrical Methods for Investigating Mine Dumps,” Proceedings of the 5th International Conference on Acid Rock Drainage (ICARD 2000), Denver, 21-24 May 2000, Society for Mining, Metallurgy, and Exploration, Inc., Littleton, 2000, pp. 1513-1523.
- T. Dahlin, H. Rosquist and V. Leroux, “Resistivity—IP for Landfill Application,” First Break, Vol. 28, No. 8, 2010, pp. 101-105.
- Yuval and D. W. Oldenburg, “DC Resistivity and IP Methods in Acid Mine Drainage Problems: Results from the Copper Cliff Mine Tailings Impoundments,” Journal of Applied Geophysics, Vol. 34, No. 3, 1996, pp. 187-198. doi:10.1016/0926-9851(95)00020-8
- M. H. Biste, R. Bufler and G. Friedrich, “Geology and Exploration of Gold Placer Deposits the Precambrian Shield of Eastern Bolivia,” In: O. Dpjdp-Dtcd, Ed., International Symposium on Alluvial Gold Placers, La Paz, 1991, pp. 148-158.
- M. N. Tijani, O. O. Osinowo and O. Ogedengbe, “Mapping of Sub-Surface Fracture Systems Using Integrated Electrical Resistivity Profiling and VLF-EM Methods: A Case Study of Suspected Gold Mineralization,” RMZ— Materials and Geoenvironment, Vol. 56, No. 4, 2009, pp. 415-436.
NOTES
*Corresponding author.