International Journal of Geosciences
Vol. 3 No. 4 (2012) , Article ID: 22923 , 5 pages DOI:10.4236/ijg.2012.34077
Fluid Dynamic Response of the Russia Seismically Differing Regions to the Global Geodynamics Processes
1Shmidt Institute of Physics of the Earth, Russian Academy of Sciences, Moscow, Russia
2Institute of Volcanology and Seismology, Far Eastern Branch of Russian Academy of Sciences, Petropavlovsk-Kamchatskij, Russia
Email: *rudak@mail.ru
Received December 14, 2011; revised January 26, 2012; accepted February 10, 2012
Keywords: seismically active region; Russian platform; fluid-dynamic monitoring; global processes
ABSTRACT
The results of the spectral-correlation analysis of the fluid-dynamic (radon and hydrogen) data monitoring obtained in the seismically active region—in Kamchatka and in conditions of Russian platform where compared to the results of the laser-deformometer measurements obtained on Caucasus. It allowed identify spectral components of the measured parameters, first of all, in the area of the lunar-solar tides. This identification have demonstrated the identical reaction of the mountain and platform regions to the global geodeformation processes of the tidal level and have shown the possibility of the measuring parameters response to the catastrophic events preparation processes. Really the prognostic effects in the investigated fields where indicated in periods of preparation and realization of the catastrophic earthquakes in Indian Ocean on December, 26, 2004 and on March, 28, 2005.
1. Introduction
Using results of the many years geodeformational processes investigations made in the seismic and platform regions of the former USSR with the help of the emanation (radon) method we have shown [1-4], that the different scale earth velocity variations have generated in the earth crust the geodeformation waves of appropriate periodicity, among which the seasonal (annual) wave take a defining position in the different disastrous appearances provocation (first of all, earthquakes and volcanic eruptions) in each particular region of the planet. It was also shown [5] that these processes are adequately mapped in the fluid (gas) displacement dynamics and first of all in a change of the earth crust degassing regimes of the mountain and platform regions. So the description of the geodeformation processes change, first of all, during preparation of earthquakes and volcanic eruptions is most adequately realized using intensity of the fluid (gas) interchange in the inter-block space of the earth’s crust by variations of the emanation fields (radon, helium, hydrogen etc.).
Developing the conceptual aspects of the problem related to the estimation of the fluiddynamical systems response of the earth crust fault structures at the processes of geodynamic events preparation the comparative analysis of the emanation fields (radon and hydrogen) time series variations, obtained in the geodynamically active region—in Kamchatka and in conditions of the seismically passive Russian platform compared to the results of the laser deformometry, obtained in the Caucasus was carried out.
2. Technology of Investigations
Continuous measurements of deformations in the Caucasus were carried out using laser interferometer-deformograf of the Shternberg Astronomic Institute with measuring base of the 75 meters and resolution 2 × 10⁻¹³, installed in the Baksan neutrino observatory gallery [6].
Continuous measurements of the fluid dynamic regimen of Moscow depression variations were carried out in a zone of dynamic influence of regional tectonic structures of the crystal base crossed in the central part of the Capital, by the emanations of radon and hydrogen [7] using the original technology providing the control of the geodeformation processes change at a level of lunar-solar tidal disturbances, i.e. at a level of 10−8.
Similar measurements were carried out in Kamchatka in the district of Paratunka settlement where geodynamic activity of territory is permanently shown by the output of the hydrothermal sources on the surface [8].
3. Empiric Data and Results
Analyzed time series (figure 1) are the fragment of simultaneous record of the named parameters, averaged in hour intervals, at the common duration of 13,510 hoursi.e. more than 1.5 years. The beginning of record is dated November 11, 2004 at the moment of the laser interferometer starting and the ending was defined by the failure of the emanation measurements microprocessor registrar in Moscow.
The comparison of the emanation fields time series

Figure 1. Time series of variations: (a) Deformations on Caucasus; (b) hydrogen on Russian platform (in Moscow); (c) hydrogen on Kamchatka; (d) radon in Moscow; (e) radon on Kamchatka. Arrows mark the moments of catastrophic earthquakes in Indian Ocean.
parameters obtained in Kamchatka and on the Russian platform by means of sliding correlation function, testifies to definitely common character of the geodeformation processes determining the fluid transference regimen in obviously differing geodynamic conditions. It is specified with the correlation link between analyzed parameters (figure 2) which in intervals, multiple to the seasonal cycles duration some months, vary from absolutely positive down to absolutely negative values. For time series of radon positive hundred percent correlation is observed since December till March, and negative in April-May while for time series of hydrogen absolutely positive correlation is marked at the end of February— the beginning of March and since November till December, and negative—since August till September and since January till February. And the trend components of deformations in the Caucasus and deformations managing fluid transference of the Moscow depression and in Kamchatka have obviously expressed seasonal (annual) character reflected by the appropriate components in the results of the spectral analysis.
Deformometric measurements data spectral analyses, filtered in a tidal range of frequencies with the periods (from 30 till 5 hours) and the subsequent spectral analysis of the mutually correlation functions of fields of radon and hydrogen within the limits of the allocated fragment, have allowed to identify the spectral components of the measured parameters in the area of the variations caused by the lunar-solar tides (table 1). The results of this identification, first of all, specify the adequacy of the global geodeformation processes reflection, what the earth tides are, in the measured parameters of the mountain (seismoactive) and platform regions. As follows from the table, the character of the emanation field’s response on tidal deformations of earth’s crust in the field of the most typical components of a spectrum is practically identical to the character of the rock massive deformations in the Caucasus revealed at deformometric observations.
In order to allocate the low-frequency components in the variations of radon and hydrogen fields similar appropriate component of the deformations of the earth’s crust, the bending curve of the filtered deformometric data was obtained by the sliding average method on which the spectrum of the tidal deformations bending was calculated, using mutual spectra of fields of radon and hydrogen (table 2).
4. Discussion of Obtained Data
The testing (as follows from the table 2) also confirms the influence on the fluid transference in the geodynamically differing regions of the planetary geodeformation processes subjection determined first of all by the tidal influence of the Moon and the Sun. At the same time, as we can see, the spectral structure of time series of the emanation fields differs from the deformometric data that is related to the technology of the emanation measure
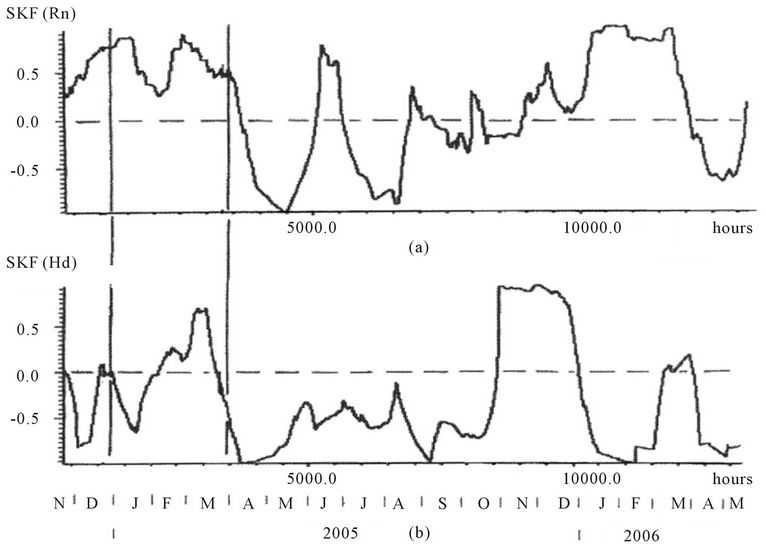
Figure 2. Slipping correlation functions of time series: (a) radon on Kamchatka and radon in the Moscow first point of measurements; (b) hydrogen on Kamchatka and hydrogen in the Moscow first point of measurements.
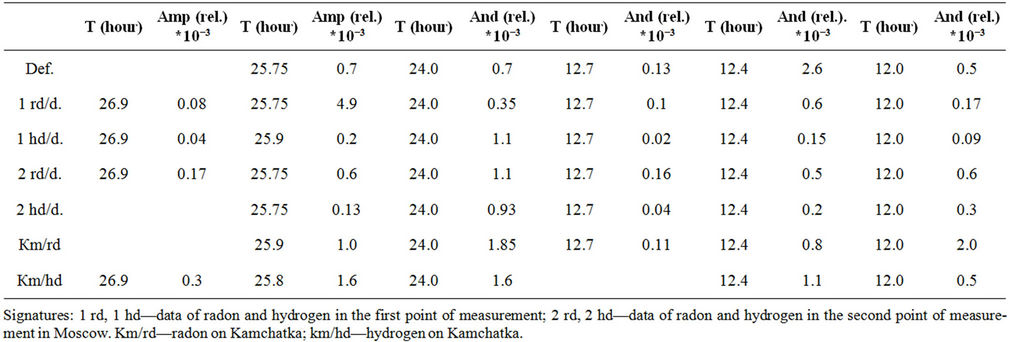
Table 1. Tidal components of the mutual-correlation spectrum of the filtered data laser deformograf data in Baksan (Caucasus) and variations of radon and hydrogen in Moscow and on Kamchatka in comparison with tidal components of the deformometric data (1 line).

Table 2. Spectral components of the mutual-correlation spectrum of variations bending around the filtered series of the laser deformograf data in Baksan and variations of radon and hydrogen in Moscow and on Kamchatka.
ments, providing extraction of information on the volumetric rock massive deformations which essentially extender of the linear deformation’s spectrum. Probably this is the reason of the emanation field reaction (figure 1) on the global changes in the stress-strain state of the earth’s crust, which have provoked the seismic energy emission close to Sumatra Island on December 26, 2004 and on March 28, 2005. The level of the seismic energy emission during these earthquakes has reached a 9-ball mark on the Magnitude Scale, which proves the extraordinarity of the geodeformation processes participated in their preparation, and, that have obviously, disturbed the earth’s crust as a whole.
As we can see, the character of the emanation field’s reaction (figure 1) in Kamchatka and on the Russian platform and deformations in the Caucasus at the global changes of the stress-strain state of an earth’s crust, which have provoked the seismic energy emission in Indian Ocean, are slightly various.
Thus, a sharp jump in the field of hydrogen of Moscow depression practically one month prior to tragic events that has five times exceeded the level of concentration of previous months. In the field of radon this effect was on the contrary noted more than double reduction of a level of concentration of the emanation [6], which has indicated of the Moscow depression fault structures permeability increase. In Kamchatka the field of hydrogen and radon did not vary so abnormally at this time, however almost hundred percent correlation of fields of radon before events in December, 2004 and in March, 2005, as well as hundred percent correlation of the hydrogen fields in March, 2005 proves the global changes in the stress-strain state of the earth’s crust which have caused catastrophic events in Indian ocean.
The hydrogen concentration in the Moscow depression has decreased up to initial level during 3 months after earthquake of 28.03.05 and has decreased almost to a zero level during further months. Concentration of radon has not decreased to the initial level that is explicated by the descending trend in time series of the emanation fields and is caused by the influence of the wave geodeformation processes of higher hierarchical level [5]. Besides it confirms that variations of the radon field are subjected to the variations of the hydrodynamic regimen of the tectonic structures used for the fluid-dynamic monitoring while variations of a field of hydrogen directly reflects the deformations regimen of the earth’s crust [6].
In the deformometric measurements data the effect of the global change in the stress-strain state of an earth’s crust was reflected as a result of the mutual analysis of the records obtained in the Caucasus and in Protvino settlment (Moscow region) [9] in which the period of preparation and realization of earthquakes is characterized by the identical change of the registered parameters.
5. Conclusion
Hence, it agrees to the fluid-dynamic (emanation) monitoring data of the geodeformation processes in the geodynamically active region—in Kamchatka and in the Russian platform tested by the laser-deformometric data obtained in the Caucasus, the global processes of the stress-strain state change of the earth’s crust can bee in the preparation and realization of catastrophic geodynamic events involved. So the rational use of the data on the fluid-dynamic regimen change of the geostructural formations in the mountain and platform regions allows to monitor these processes and to predict the periods of formation of the seism-tectonic destruction of the rocks massive areas.
6. Acknowledgements
The authors are grateful to the employee of the Shternberg astronomical institute of the Moscow State University, the doctor of physical and mathematical sciences Miljukov V. K. for the laser deformometry data and the attention shown to the work.
REFERENCES
- V. P. Rudakov, “About a Role of Geomotions of the Undular Frame in the Preparation of Strong Earthquakes (on an Example of Caucasus),” DAS, Vol. 322, No. 5, 1992, pp. 875-878.
- V. P. Rudakov, “About a Role of Geomotions of the Undular Frame in Activation of Geodynamic Processes in Seismically Passive Regions (on an Example of Geodynamic Appearances of the Russian Platform),” DAS, Vol. 332, No. 4, 1993, pp. 509-511.
- V. P. Rudakov, “The Geodynamic Preconditions of the Neftegorsk Earthquake of May 27, 1995,” DAS, Vol. 345, No. 6, 1995, pp. 819-822.
- E. Yu. Zdanova and V. P. Rudakov, “About a Role of Geomotions of the Undular Frame in Preparation of Volcanic Eruptions (on an Example of Northern Group of Volcanoes of Kamchatka),” DAS, Vol. 329, No. 1, 1993, pp. 24-26.
- V. P. Rudakov, “Emanation Monitoring of Geoenvironments and Processes,” Scientific World, Moscow, 2009, 176 p.
- V. K. Miljukov, A. V. Kopaev, A. V. Lagutkina, A. P. Mironov and A. V. Butchers, “Supervision of Tidal Deformations of an Earth’s Crust in Prielbrusie,” Physics of the Earth, Vol. 43, No. 11, 2007, pp. 922-930.
- V. P. Rudakov and V. V. Tsiplakov, “Fluid-Dinamic Effects of the Moscow Sineclise Fault Structures in Connection with Global Geodeformation Processes,” Geochemistry, No. 11, 2008, pp. 1238-1244.
- P. P. Firstov, “Monitoring of Volumetric Activity of the Subsoil Radon (Rn-222) on Paratunka Hydrothermal System in 1997-1998 with the Purpose of Search of the Precursors of Strong Earthquakes of Kamchatka,” Volcanology and Seismology, No. 6, 1999, pp. 1-11.
- L. A. Latynina, V. K. Miljukov and I. M. Vasiliev, “The Strongest Earthquakes and Global Tectonic Processes,” Science and Technology in Russia, No. 1-2, 2006, pp. 4-6.
NOTES
*Corresponding author.