Food and Nutrition Sciences
Vol.5 No.2(2014), Article ID:42183,11 pages DOI:10.4236/fns.2014.52024
Feeding Study with Bt Corn (MON810: Ajeeb YG) on Rats: Biochemical Analysis and Liver Histopathology
Food Science Department, Faculty of Agriculture (Saba-Basha), Alexandria University, Alexandria, Egypt.
Email: Nour_abdo77@yahoo.com
Received October 28th, 2013; revised November 28th, 2013; accepted December 5th, 2013
ABSTRACT
Bt corn “MON810: Ajeeb YG” produces delta endotoxins in the whole plant due to the genetic modification process. The chemical analysis of this variety showed significant differences from its conventional counterpart “Ajeeb”. Further, feeding studies on rats were designed to complete assessing the safety of “MON810: Ajeeb YG”. Three groups of rats (6 males and 6 females’ rats/group) were fed on control diet, non-Bt corn and Bt corn for 1.5 months and 3 months. After 1.5 months, 3 males and 3 females from each group were sacrificed, and after another 1.5 months, 3 males and 3 females from each group and their offspring were sacrificed. Histopathological examination, blood haematology and serum biochemical analysis were determined. Results indicated significant differences among the tested parameters in the three groups especially Bt group. Severe changes in the liver of Bt group after 3 months were observed.
Keywords:MON810: Ajeeb YG; Feeding Study; Blood Biochemical Analysis; Haematology; Histopathology
1. Introduction
Commercialization of biotech crops has started since 1996, where the cultivated area of these crops was increased from 1.7 million hectares in 1996 to 170.3 million hectares in 2012. According to the latest statistics in 2012, Africa made steady progress in planting of biotech crops where the four countries (Egypt, Sudan, South Africa & Burkina Faso) together planted 2.9 million hectares of biotech crops; and the planted biotech crop in Egypt was GM maize [1]. “MON810: Ajeeb YG” is a genetically modified corn that has resistance to borers, and this variety was produced by incorporating the MON810, produced by Monsanto, in the Egyptian conventional corn germplasm “Ajeeb” [2]. MON810 variety contains Cry1Ab genes from Bacillus thuringiensis, and these genes produce delta endotoxins in the whole plant [3,4]. These endotoxins activate in the alkaline environment of insects’ gut, and then the insects die within 24 - 48 hours [5]. The safety assessment in the first place focuses on the presence of newly expressed proteins, because most of these proteins are immunogenic. Sometimes, immunogenicity leads to hypersensitivity reactions “allergy” [6,7]. Otherwise, the new proteins have toxicological impact on the human/animal health which results from “expression of introduced gene, genes silencing or over expression of endogenous gene” [8]. Risk assessment strategy for genetically modified plants is known as the estimation of potential adverse health effects on humans or animals, and it can be evaluated by comparison of genetically modified foods with their conventional counterparts, based on the assumption that conventional counterparts are similar foods or feeds produced without the help of genetic modification and the history of safe use as mentioned in the regulation (EC) NO.1829/2003 [9]. This comparison also denoted the concept of “substantial equivalence” [8]. Results of the present study detected that there were significant differences among all parameters of moisture content, crude fat, crude fiber, carbohydrates, proteins and ash content, except for starch content, and also lipids profile and amino acids profile between Bt corn and non-Bt corn which showed significant differences [10]. In order to arrive at high level science-based assessment of chemicals in food, and of whole food and feed, appropriate animal studies may be needed [11]. Accordingly, in the present research, feeding studies were carried out on rats for 90 days feeding on one of three normal doses of GM in the diet (11%, 22%, and 33%) to represent an equilibrated diet. The health risk assessment of Bt corn was based on the study of blood analyses of rats feeding on Bt corn and non-Bt corn compared to a control diet in sub-chronic tests [12]. After the termination of the feeding study, it was followed by clinically observable adverse effects, organs weight, blood chemical analyses, haematological parameters and histopathology.
2. Materials and Methods
2.1. Materials
Seeds of Bt corn “MON810: Ajeeb YG®” & non-Bt corn “Ajeeb” were carefully cleaned and disqualified from broken seeds. The seeds were milled into a fine powder.
Thirty six albino rats “18 females and 18 males” were obtained from Faculty of Medicine, Alexandria University.
2.2. Experimental Design
Thirty six albino rats “18 females and 18 males” were randomly divided into three groups; each group consisted of 6 males and 6 females, where group I (control), group II (non-BT), and group III (BT). Rats in group I (control) fed on 100% of a standard diet, those in group II (nonBT) fed on a standard diet containing 30% of non-BT corn, and the ones in group III (BT) fed on a standard diet containing 30% of BT corn. Rats were housed in cages under controlled conditions, and were allowed to acclimate to the housing conditions for one week before the treatment was begun during which they kept on basal diet. Animals were observed twice weekly for general wholesomeness and care. After 1.5 months of the beginning of the treatment, 3 males and 3 females from each group were sacrificed. And after 3 months from the beginning of the treatment, 3 males, 3 females and their offspring in each group was sacrificed.
2.3. Organs Weight
Liver tissue, kidney, spleen, and heart of rats that were sacrificed after 1.5 months, 3 months and their offspring were removed and weighed.
2.4. Liver Histopathology
After removing the liver, it was immediately fixed in 10% formaldehyde. The fixed liver tissue was dehydrated by ethanol (70%, 80%, 90%, and 100%). The tissue was cleared in xylene, and was embedded in paraffin blocks and sectioned into 5 µm thick tissue sections using microtome (Reichert-Jung, Germany). The sections were mounted on glass slides and stained with Haemotoxylin and eosin (H & E) stain in order to examine under light microscopy (100×, 200× & 400×) [13,14].
2.5. Blood Biochemical Analysis
Blood samples were taken from heart of rats under ether anesthesia where, 1 ml of blood sample was transferred into EDTA tube for blood picture determination by CBC. About 2 ml of blood sample were transferred into tube without additive. The tubes without additive were centrifuged at 3000 rpm for 15 minutes for serum separation. Serum samples were analyzed for determination of liver profile (Aspartate aminotransferase (AST), Alanine aminotransferase (ALT), Alkaline phosphatase (ALP), Gamma-glutamyl transferase (GGT), total protein, albumin, globulin & A/G ratio), lipid profile (cholesterol, triglycerides, HDL, LDL, VLDL, total lipids, LDL/HDL ratio & cholesterol/HDL ratio), kidney functions (urea, uric acid & creatinine), allergenicity test (IgE) and test of liver tumor (AFP).
2.6. Statistical Analysis
The statistical analysis was performed using a SPSS 19 program. Data were expressed as mean ± standard error (SE) and statistical significance was assigned at P ≤ 0.05 level. A factorial ANOVA experiment was conducted to compare organ’s weight, blood biochemistry and haematology.
3. Results and Discussion
3.1. Organs Weight
Organs’ weights after 1.5 months, 3 months and offspring are shown in (Tables 1 and 2), respectively. Generally, significant differences were detected in all organs weights among groups after 1.5 months and 3 months and among male and female groups. As can be seen, no significant differences were observed in liver weight after 1.5 months for males, but obvious significant increase was detected in Bt group of females after 1.5 months, as well as after 3 months and in both offspring males & females. Liver weight after 3 months, for males fed Bt & non-Bt groups showed a significant increase as compared to control. As for spleen weight, no obvious significant difference was observed after 1.5 months for both males and females. Whereas, a clear significant increase was observed in Bt fed group in both males and females after 3 months. Results also indicated the presence of significant increase in spleen weight for male’s offspring, but no significant difference was observed in female’s offspring. With respect to kidney weight, significant differences in Bt groups were detected between females after 1.5 months and males after 3 months. That is to say, no significant increase in kidney weight was observed except for male Bt and non-Bt fed groups as compared to control after 3 months. No significant differences were observed between offspring except for females in both Bt and non-Bt group. Concerning the heart weight, no significant differences were observed among the three groups in both males & females after 1.5 months. As a matter of fact, after 3 months a significant increase in heart weight was observed in Bt and non-Bt fed males. Whereas, a significant decrease in heart weight was observed in female groups fed Bt and non-Bt corn. The offspring females in Bt group exhibited a significant increase in heart weight, but no significance was detected in offspring males. Reference [2] determined the organs weights of males after 45 & 91 days feeding on 30% MON810; where kidney and spleen showed significant increase in Bt groups compared to other groups after 45 days. While weight of kidney, liver and heart were significantly increased in Bt group, the spleen was significantly decreased in Bt as compared to the other groups. Reference [12] showed that the consumption of Bt corn or GM soybean caused significant differences in organs’ weights particularly, liver and kidney because these organs are concerned for detoxification process. Liver weights were significantly increasing in females rats, but there were no obvious significant differences in males. Whereas, kidney weights showed no significant differences in both males and females as reported by Kilic & Akay [13].
3.2. Liver Histopathology
Concerning liver histopathology, no changes were detected in the liver of control group (Figure 1(a)). The changes in liver were noticed in non-Bt & Bt groups after 1.5 months where vacuolation was observed in both groups, mild cellular infiltration surrounding portal tract, congested central vein and dilated blood sinusoid also were detected in Bt group after 1.5 months, as shown in Figures 1(b)-(d). These changes were also detected in non-Bt group after 3 months in addition to some dark nuclei as shown in Figures 1(e) and (f). But in Bt group after 3 months, other changes were noticed. The liver lost its hepatic architecture and increased activity of macrophages (Figure 1(g)), destruction of cytoplasm, pyknosis

Table 1 . Organs weights of rat’s offspring feeding on diets for 50 days.
*The same letter in the same row is not significant different at (P ≤ 0.05).
Table 2. Organs weight of rats after 1.5 and 3 months.
Each value is mean ± SE, and expressed as % of body weight. *The same letter in the same row is not significant different at (P ≤ 0.05).
 (a)
(a) (b)
(b)  (c)
(c)  (d)
(d)  (e)
(e)  (f)
(f)  (g)
(g)  (h)
(h) 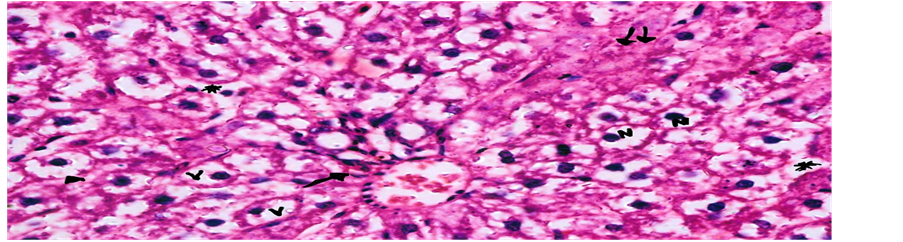 (i)
(i)
and cellular infiltration as seen in Figures 1(h) and (i). Histopathology of liver revealed minor changes in nonBt and Bt group after 1.5 months, but severe changes appeared in Bt group after 3 months. These results were quite in agreement with Kilic & Akay [13] who found some changes especially in the group feeding on Bt corn MON810 such as infiltration, congestion, border change and granular degeneration. Some feeding studies with GM maize confirmed histopathological changes in the liver of rats such as congestion, cell nucleus border changes and sever granular degeneration. These changes may be due to the insertion of Cry1Ab gene in maize which produces the insecticide in MON810 because this insecticide is a toxin [12]. In the same respect Hammond, et al. [15] detected infiltration, mononuclear, multifocal and inflammation by microscopic examination in the liver of rats that were fed grain from glyphosate tolerant corn.
3.3. Blood Biochemical Analysis
Results in Table 3, for both male and female rats after 1.5 months of feeding exhibited an obvious significant increase at (P ≤ 0.05) in liver enzymes in Bt groups as compared to control and non-Bt groups. Whereas, ALP level in females after 1.5 months showed a significant decrease in this respect. But after 3 months a significant rise in all liver enzymes (AST, ALT, GGT) as well as ALP was obvious in Bt group as compared to control. The same trend was also true for male and female offspring groups Table4 It is also obvious that no significant difference was observed among all fed groups after 1.5 months and 3 months and offspring concerning total protein, albumin, globulin and A/G ratio. In this study, the results of liver functions analysis are in agreement with the histopathological study of liver as described previously. It was reported by AACC [16] that AST, ALT, ALP and GGT content Increase if liver damages. Our results were different from the results reported by Kilic & Akay [13], as there were no significant differences among the determined enzymes and proteins except for globulin and total protein in males and females. Enzymes were significantly different as our study after 45 days of feeding on “MON810-Ajeeb YG” except for total protein, albumin and globulin. But it was in agreement with the results determined after 91 days of feeding as revealed by Rayan et al. [2]. The results of kidney functions of all groups fed Bt, non-Bt and control showed disturbed levels after 1.5 months for both male and female groups with no significant differences in urea and creatinine in Bt males as compared to control, but, showed a significant rise in uric acid level as compared to control. As for females, a significant decrease in uric acid was only observed in Bt and non-Bt groups as compared to control. As a matter of fact, after 3 months in males Bt group, a significant increase in urea was observed as compared to control, but, a significant decrease was detected in uric acid level. As for females, no significant differences in urea and uric acid were observed, but a significant decrease was detected in creatinine level in Bt as compared to non-Bt and control. Concerning male and female offspring, a significant increase in both urea and creatinine levels were observed in Bt fed group as compared to control. The results of kidney functions in this study is not in agreement with those obtained by Kilic & Akay [13] who observed that there were no significant differences among the groups in urea and uric acid for both of males and females, but creatinine was differed in non-Bt for males and in Bt for females from the other groups. Reference [2] found that uric acid, urea and creatinine in Bt group were significantly different from the other groups after 45 and 91 days. Results showed changes in lipid profile of blood. As it can be seen, male rats after 1.5 months fed on Bt, non-Bt and control groups exhibited a significant increase (P ≤ 0.05) in cholesterol, triglycerides, VLDL cholesterol and total lipids, but, no significant differences were observed in HDL cholesterol, LDL cholesterol, cholesterol/HDL and LDL/HDL. Whereas, after 3 months a significant increase (P ≤ 0.05) were observed in all lipid blood profile except for few such as HDL and LDL cholesterol where they showed no significant differences compared to control. As for female rats, after 1.5 months, results showed a significant decrease in some parameters such as (triglycerides, VLDL cholesterol, cholesterol/HDL and LDL/HDL), and a significant increase in some parameters such as (cholesterol and HDL cholesterol) in Bt fed groups. No significant differences were observed in all lipid parameters after 3 months of feeding for female rats. For male and female offspring groups, a significant increase was detected in all parameters except for HDL cholesterol as compared to control. Our results for lipid profile analysis disagreed with Rayan, et al. [2] who reported that all lipid parameters of rats’ blood feeding on “MON810-Ajeeb YG” were increased after 91 days of starting the experiment , except for HDL concentration. Lipids have an important role in the body; they provide the body with energy, prevent heat loss, hormones precursors and act as functional and structural components in the biomembranes. So any alternation in lipid parameters levels in the blood could lead to clinical disorder as stated by Adamu, et al. [17]. It is important to highlight the reason of cholesterol elevation, it may be attributed to blockage of liver bile ducts, reducing its secretion to the duodenum, that cause cholestasis as reported by Rai, et al. [18]. AFP levels concerning male and female rats after 1.5 months showed no significant increase in AFP for Bt group as compared to control. Whereas, a significant increase in AFP (P ≤ 0.05) was observed in both Bt male and female groups after 3
Table 3 . Rats blood biochemical analysis after 1.5 & 3 months.
Each value is mean ± SE; *Means within a raw with different superscripts are significantly different (P ≤ 0.05).
Table 4. Rats’ offspring blood biochemical analysis.
Table 5. Blood picture of rats after 1.5 & 3 months.
Each value is mean ± SE, and expressed as % of body weight; *The same letter in the same row is not significant different at (P ≤ 0.05).
months. Similarly, a significant increase existed for both male and female offspring groups. It should be noticed from the present research that AFP was elevated in rats after 3 months but it was within the normal range when compared to Kores, et al. [19] who recognized that AFP concentrations were elevated in rats’ blood treated with different toxins, where it ranged from 0.014 in control to 980 µg/ml in treated rats. IgE levels indicated a significant increase in Bt groups in both male and female rats after 1.5 and 3 months. Also, a significant rise in IgE was detected in both male and female offspring. IgE results were increased in Bt when compared to other groups but it still in the normal range. This study was in agreement with Domingo [20] who stated that no evidence of production Cry9C-specific IgE after 13 weeks of feeding study with GM corn CBH351. Similarly, soybean-specific IgE was not detected in rats’ blood after 15 weeks of feeding on GM soybean as determined by Teshima, et al. [21].
3.4. Haematology
No, significant differences were observed concerning the blood picture of male rats after 1.5 months between Bt and non-Bt groups and control except for few parameters such as WBC, PLT and MPV (Table 5). Similarly, no significant differences concerning the blood picture of
Each value is mean ± SE. *The same letter in the same row is not significant different at (P ≤ 0.05).
females were observed after 1.5 months between Bt fed groups and control except for very few parameters such as RDW-SD and PCT. After 3 months, a significant increase in nearly all tested blood parameters in the male group fed both Bt and non-Bt corn was observed as compared to control, except for RBC and HCT which showed a significant decrease. MPV did not show any significant differences in Bt group as compared to control and non-Bt fed groups. On the other hand, female rats after 3 months of feeding did not show clear significant changes in their blood picture except for few parameters such as HCT, MCV and PLT. Thus male rats exhibited the biggest significant change after 3 months of feeding Bt in their blood picture. Contradictorily to the aforementioned results the female offspring fed Bt corn exhibited more significant changes in blood picture as compared to male offspring (Table 6). Some parameters in the blood may be increased if there were disorder in
Table 6 . Blood picture of rats’ offspring feeding on diets for 50 days.
Each value is mean ± SE; ND: Not Detected. *The same letter in the same row is not significant different at (P ≤ 0.05).
the body tissues. Increasing of WBC concentrations in blood may be due to infection, inflammation, allergies or tissue death as listed by AACC [22], also PLT concentrations increased if the tissues were exposed to inflammation, cancer or anemia as published by AACC [22]. These results were differed from the results obtained by Hammond, et al. [15] who noticed that there were no statically significant differences in haematology study of rats feeding on grains from glyphosate tolerant corn for 13 week.
4. Conclusion
Obviously, the insertion of the Cry1Ab genes from the soil bacteria named Bacillus thuringiensis resulted in changes in the chemical analysis of Bt corn from its conventional counterpart “Ajeeb”. Further, from subchronic feeding study, it can be seen that there were a lot of alternations in the organs weights, haematology and serum biochemical analysis in Bt group after 1.5 months but changes were increased after 3 months and offspring. There were severe changes in the histopathological examination of liver tissues. These changes may be due to the endotoxins that were produced in the Bt corn.
Acknowledgements
I am particularly grateful to Dr. Noha M. Zahran, lecturer of Histology and Cell Biology, Faculty of medicine, Alexandria University of her help during this work.
REFERENCES
- C. James, “Global Status of Commercialized Biotech/GM Crops: 2012,” ISAAA, 2012, Brief No. 44, p. 18.
- A. M. Rayan, A. A. Gab-Alla, Z. S. El-Shamei, A. A. Shatta and E. A. Moussa, “Morphological and Biochemical Changes in Male Rats Fed on Genetically Modified Corn (Ajeeb YG),” Journal of American Science, Vol. 8, No. 9, 2012, pp. 1117-1123.
- K. R. Ostlie, et al., “Bt Corn & European Corn Borer: Long-Term Success through Resistance Management,” 2008. http://www.extension.umn.edu/distribution/cropsystems/dc7055.html
- A. Tenuta, M. Sears, F. Meloche and A. Schaafsma, “A Grower’s Handbook Controlling European Corn Borer with BT Corn Technology,” 2011, pp. 1-16.
- OECD, “Consensus Document on Safety Information on Transgenic Plants Expressing Bacillus Thuringiensis— Derived Insect Control Proteins,” Organization for Economic Cooperation and Development, Vol. 42, 2007, pp. 1-110.
- EFSA, “Guidance Document of the Scientific Panel on Genetically Modified Organisms for the Risk Assessment of Genetically Modified Plants and Derived Food and Feed,” European Food Safety Authority Journal, Vol. 99, 2006, pp. 1-100.
- EFSA, “Review on Safety & Nutritional Assessment of Genetically Modified Plant and Derived Food and Feed: The Role of Animal Feeding Trials, Report of the EFSA GMO Panel Working Group on Animal Feeding Trials,” Food and Chemical Toxicology, Vol. 46, Suppl. 1, 2008, pp. S2-S70. http://dx.doi.org/10.1016/j.fct.2008.02.008
- EFSA, “Scientific Opinion of the Panel on Genetically Modified Organisms (GMO) on Guidance for Risk Assessment of Food and Feed from Genetically Modified Plants,” European Food Safety Authority Journal, Vol. 9, No. 5, 2011, pp. 1-37.
- EC, “Regulation (EC) 1829/2003 of the European Parliament and of the Council of 22 September 2003 on Genetically Modified Food and Feed,” Official Journal of the European Communities, Vol. L268, 2003, pp. 1-23.
- E. M. Abdo, O. M. Barbary and O. E. Shaltout, “Chemical Analysis of BT Corn ‘Mon-810: Ajeeb-YG®’ and Its Counterpart Non-Bt Corn ‘Ajeeb’,” Journal of Applied Chemistry, Vol. 4, No. 1, 2013, pp. 55-60.
- FOSIE, “Food Safety in Europe: Risk Assessment of Chemicals in Food and Diet,” Food Chemical & Toxicology, Vol. 40, No. 2, 2002, pp. 139-427.
- G. E. Séralini, R. Mesnage, E. Clair, S. Gress, J. S. de Vendômois and C. D. Dominique, “Genetically Modified Crops Safety Assessments: Present Limits and Possible Improvements,” Environmental Sciences of European, Vol. 23, No. 1, 2011, pp. 1-10.
- A. Kilic and T. M. Akay, “A Three Generation Study with Genetically Modified Bt Corn in Rats: Biochemical and Histopathological Investigation,” Food and Chemical Toxicology, Vol. 46, No. 3, 2008, pp. 1164-1170. http://dx.doi.org/10.1016/j.fct.2007.11.016
- S. I. Taluker, “Histopathology Techniques: Tissue Processing and Staining,” Mymensingh Medical College, Department of Pathology, Mymensingh, 2007, p. 11.
- B. Hammond, R. Dudekb, J. Lemena and M. Nemetha, “Results of a 13 Week Safety Assurance Study with Rats Fed Grain from Glyphosate Tolerant Corn,” Food and Chemical Toxicology, Vol. 42, No. 6, 2004, pp. 1003- 1014. http://dx.doi.org/10.1016/j.fct.2004.02.013
- AACC, “Liver Profile,” 2013. http://labtestsonline.org/understanding/analytes/liver-panel/tab/test
- S. Adamu, et al., “Changes in the Serum Profiles of Lipids and Cholesterol in Sheep Experimental Model of Acute African Trypanosomosis,” African Journal of Biotechnology, Vol. 7, No. 2, 2008, pp. 2090-2098.
- D. K. Rai, P. K. Rai, A. Gupta, G. Watal and B. Sharma, “Cartap and Carbofuran Induced Altrations in Serum Lipid Profile of Wistar Rats,” Indian Journal of Clinical Biochemistry, Vol. 24, No. 2, 2009, pp. 198-201. http://dx.doi.org/10.1007/s12291-009-0036-8
- R. Kroes, J. M. Sontag, S. Sell, G. M. Williams and J. H. Weisburger, “Elevated Concentrations of Serum AlphaFetoprotein in Rats with Chemically Induced Liver Tumors,” Cancer Research, Vol. 35, No. 5, 1975, pp. 1214- 1217.
- J. L. Domingo, “Toxicity Studies of Genetically Modified Plants: A Review of the Published Literature,” Critical Reviews in Food Science and Nutrition, Vol. 47, No. 8, 2007, pp. 721-733. http://dx.doi.org/10.1080/10408390601177670
- R. Teshima, H. Akiyama, H. Okunuki, J. Sakushima, Y. Goda, H. Onodera, J. Sawada and M. Toyoda, “Effect of GM and Non-GM Soybeans on the Immune System of BN Rats and B10A Mice,” Journal of the Food Hygienic Society of Japan, Vol. 41, No. 3, 2000, pp. 188-193. http://dx.doi.org/10.3358/shokueishi.41.188
- AACC, “Complete Blood Count,” 2013. http://labtestsonline.org/understanding/analytes/cbc/tab/test