Food and Nutrition Sciences
Vol. 3 No. 10 (2012) , Article ID: 23394 , 12 pages DOI:10.4236/fns.2012.310187
Use of the Medifast Meal Replacement Program for Weight Loss in Overweight and Obese Clients: A Retrospective Chart Review of Three Medifast Weight Control Centers (MWCC)
![]()
1Medifast, Inc., Owings Mills, USA; 2Private Practice, Clifton Park, New York, USA.
Email: ccoleman@choosemedifast.com
Received August 10th, 2012; revised September 10th, 2012; accepted September 17th, 2012
Keywords: Meal Replacements; Weight Loss; Compliance; Body Composition; Obesity
ABSTRACT
Objective: A chart review was performed to evaluate the effectiveness of the Medifast (MD) meal replacement (MR) plan in a Medifast Weight Control Center (MWCC) on body weight, body composition, and other health measures at 4, 12, 24 weeks, and final weight loss visit. Methods: Charts included adults aged 18 - 70 (n = 446) with a BMI ≥ 25 kg/m2 who attended one of three MWCCs and were following the MD MR program. Data were collected electronically and included weight, systolic and diastolic blood pressure, pulse, lean muscle mass (LMM), body fat mass, % body fat, and abdominal circumference. Compliance measures included attendance at weekly visits, intake of MRs and supplements, food journals, and ketone testing. Results: Significant weight loss and % weight loss were achieved at all time points with clinically significant weight loss (>5%) occurring in just 4 weeks. Additionally, significant improvements in body composition were seen at all time points coupled with increases in % total body weight as LMM (% LMM improved by 3.5%, 9.8%, 16.0%, and 13.9%, respectively). Blood pressure and pulse were significantly improved, demonstrating the clinical benefit for clients. Multivariate regression revealed a strong inverse relationship between weight change, % compliance with attendance, and the number of weeks that MRs were taken as recommended as well as a positive association with number of ketone tests. Conclusion: The MD MR plan, combined with the support and accountability available in the MWCC, is an efficacious program that promotes significant weight loss and improvements in body composition. These results reveal significant associations between components of compliance and weight loss, but particularly highlight the importance of attendance, a focus of the MWCC model compared to non-clinic models.
1. Introduction
The number of overweight and obese Americans in the United States has increased dramatically over the last few decades. The US as a whole ranks ninth in the world standings of countries with the highest prevalence of overweight and obese adults, age 20 and over [1]. According to the 2008 National Health and Nutrition Examination Survey (NHANES), just over 74% of Americans are overweight, defined as having a body mass index (BMI) of greater than or equal to 25 kg/m2. Of this population, more than 34% are obese with a BMI greater than or equal to 30 kg/m2 [2]. The etiology of obesity is multifaceted. Among many, the compulsive consumption of food, an inability to restrain from eating despite the desire to do so [3], the prevalence of easily accessible high-calorie food choices [4], and inactivity [5] are the main behavioral and environmental determinants of this epidemic. Emerging research suggests other factors may also contribute, such as the environment in utero [6], genetics [7], and the flora of the gut [8]. Being overweight or obese is linked to a multitude of comorbidities, including heart disease, stroke, diabetes, some forms of cancer, gallbladder disease, osteoarthritis, gout, breathing problems, high cholesterol, hypertension, complications of pregnancy, infertility, and depression [9]. The prevalence of obesity continues to increase throughout our society despite significant action to combat this condition.
Behavioral interventions to control food intake and increase physical activity are currently the most feasible and effective strategies for weight management [10]. Providing a structured approach to obesity management has been found to further complement a restricted diet, resulting in successful weight loss and weight-loss maintenance [11]. Previously, a dose-response relationship between the level of supervision and weight loss has been demonstrated: Individuals with the most supervision lost more weight than those receiving less supervision [12]. Along with other factors, researchers have concluded that empowering individuals to maintain scheduled visits, adhere to meal replacement prescriptions, and keep daily records of food intake and physical activity promote significant weight loss [13]. The Medifast Weight Control Centers (MWCC) offer clients structured support, including the benefits described.
As part of a structured approach to obesity treatment, meal replacements (MR) have been shown to be a safe and effective tool for limiting calorie intake and promoting weight loss and weight maintenance among overweight and obese people. Benefits of MRs include builtin portion control, ease of use, and convenience. A metaanalysis of 6 randomized controlled trials using portioncontrolled MRs as part of a reduced calorie diet (>800 to <1600 kcal) for weight management demonstrated their safety, weight loss efficacy, maintenance of weight loss efficacy, and improved weight-related risk factors of disease [14]. The Medifast (MD) MR plan features a combination of MD MRs and “conventional” food choices; it has been shown to be safe and effective for weight loss in obese individuals [15]. Additionally, evidence supports the use of MD MRs combined with appetite suppressant medication as an effective strategy for helping overweight or obese patients lose weight in a medically supervised weight-control program [16].
The increasing population of overweight and obese people has led to exponential growth in the number of available commercial weight-loss programs. These employ a variety of strategies, including the use of MRs. Several commercial programs have been studied; research publications include those of both proponents and critics [17-24]. In general, the main criticisms of commercial weight-loss programs include cost [25], attrition rates [26], modest weight loss results, and overall suboptimal evidence to support their use [25]. Programs that have been studied have reported varying weight loss results of 5% - 15% [25-29].
The MD MR plan is a low-calorie, nutritionally-balanced, commercially available weight loss plan that consists of 5 portion-controlled MD MRs plus one self-prepared “Lean and Green MealTM”. At Medifast Weight Control Centers (MWCC), the structured MD MR plan is offered along with individualized 1-on-1 counseling and support. No medications are prescribed at the MWCC and medical supervision is provided by the client’s own health care provider. Each MWCC client undergoes a health review, a screening service offered at the MWCC to evaluate health and help identify concerns that may need additional evaluation/management by the client’s healthcare provider. The health review includes a general overview of the client’s health history and lab work (comprehensive metabolic panel and complete blood count). The primary purpose of this service is to provide the client a comprehensive look at their current health status. In this study we seek to evaluate the MD MR plan used in the MWCC.
2. Methodology
2.1. Medifast Weight Control Centers
At the MWCC a high level of support is provided to clients, including medical oversight and individual, weekly counseling sessions. These sessions include a number of features that create accountability and provide feedback to clients while still allowing for program personalization by MWCC counselors: ketone testing, weigh-ins, blood pressure (BP) measurement, food journal reviews, lifestyle lessons, time for comments or questions, and MR selection for the upcoming week. Clients who choose to purchase optional body composition analysis (lean muscle mass (LMM), body fat mass (BFM), and percent body fat (% BF)) as a part of their program are measured using bioelectrical impedance every four weeks. This measurement provides additional details about the client’s weight loss and serves as another tool counselors can use to provide personalized feedback.
At the MWCC a three phase approach to weight management is emphasized:
Medifast Jump Start 5 & 1 Plan (MD Plan): Active weight loss using the MD Plan includes 5 MD MRs and one self-prepared “Lean and Green MealTM” which includes 5 - 7 oz of lean protein, 3 servings (~1½ cups) of non-starchy vegetables, and up to 2 fat servings, for a total of 800 - 1000 kcal per day. The MD MRs range from 90 - 110 calories each, are low fat, low on the glycemic index, provide an approximate 1:1 ratio of carbohydrate to proteins, and are either soy or whey protein based. The length of the active weight loss phase (the MD Plan) is individualized for each client based on their weight loss goal.
Transition: After active weight loss, clients gradually decrease their use of the MD MRs and begin increasing calories from a variety of food groups to meet estimated energy needs for weight maintenance. For charts used in this review, the length of the Transition phase was predetermined by the amount of weight lost and was either 8, 12, or 16 weeks for a weight loss of less than 50 pounds, 51 - 100 pounds, and more than 100 pounds, respectively.
Maintenance: Following Transition, each client is provided a structured meal plan lasting 52 weeks. Maintenance incorporates the ongoing use of MD MRs with conventional foods and is based on individual estimated energy needs to help maintain weight over time.
2.2. Study Design
This study is a systematic retrospective chart review of clients participating in the MD Plan at three different MWCC locations in Texas between 2007 and 2010. This study was conducted in two stages. A pilot study was performed using 75 charts to establish the data collection process and to determine the likely exclusion rate so the formal study could be adequately powered; otherwise data gathered from the pilot study were not used in the formal study.
2.3. Subjects
Client charts were considered “evaluable” if the following criteria were met: adult males and females aged 18 - 70 years, following the MD Plan, had a BMI ≥ 25 kg/m2, entered a weight management program at one of the three selected MWCC locations between 2007 and 2010, and had a signed health information consent form. Exclusion criteria were as follows: following a plan other than the MD Plan, completed the initial consultation but did not participate further, did not get baseline labs performed, the program was stopped for medical reasons unrelated to the MD Plan, no signed health information consent form or the presence of a written request to revoke consent, or if clients were currently an active participant at the MWCC.
2.4. Data Collection
Electronic data collection using PASW Data Collection 5.6 was used to reduce input error and negate the need for inputting data from a paper instrument, further reducing input error. The data abstraction tool was evaluated during the pilot study for any necessary changes to improve accuracy and ease of data entry. To minimize data entry error, data gathered during the pilot study was checked by a second staff person. The same study staff that performed the pilot study performed the formal chart review.
Primary endpoints included body weight and body composition (LMM expressed as a % of Total Body Weight (TBW), BFM, and % BF). Secondary endpoints included clinical measures (BP, pulse, and abdominal circumference (AC)), and compliance-related data (attendance, ketone testing, MR usage, food journal completion, and omega-3 supplement usage). Data were collected for each time point: baseline, 4 weeks, 12 weeks, 24 weeks, and final visit (FV). FV describes the last weekly visit each individual attended during active weight loss. Start and end dates and weights for Transition and Maintenance were collected. Other data collected included demographics (age, gender, marital status, reason for weight loss), past medical history, medications, laboratory results, goal weight, goal date, and the prescribed number of program weeks.
2.5. Power and Chart Extraction Procedure
The sample was more than sufficiently powered to have a 95% chance of detecting a 5% change in body weight (i.e., main outcome) from baseline to final visit, with an assumed standard deviation of 10%. The standard deviation was a conservative estimate based on previous research performed using MD products [15]. With an alpha of 0.05, 52 client charts were needed to power for the main outcome, weight. In an effort to ensure the sample was adequately powered to assess longitudinal changes of the secondary outcomes, a minimum of 117 charts was needed. This sample of 117 was the largest needed of the secondary outcomes and was necessary to assess changes in BP. This represented having a 95% chance to detect a 5 mmHg change in BP, with an assumed standard deviation of 15 mmHg and an alpha of 0.05.
In order to account for unusable charts (due to inadequate or incomplete information or failure to meet inclusion/exclusion criteria), 250 client charts from three MWCC locations were reviewed, for a possible total of 750 charts. Client charts were systematically selected for review such that every second chart dated January 2007 and beyond was pulled until not more than 150 evaluable charts were obtained from each the 3 MWCC locations, for a total evaluable sample of not more than 450 charts.
The total number of charts included in the analysis is 446. A total of 730 were reviewed and 284 were removed based on the exclusion criteria.
2.6. Statistical Analysis
Due to timing inconsistencies in the assessment of body composition and its optional nature, there were smaller sample sizes for this measurement than for other anthropometric indices. In order to maximize the sample size for body composition, measures taken at weeks 3, 4 and 5 were pooled for week 4 data, weeks 11, 12 and 13 were pooled for week 12 data and weeks 23, 24 and 25 were pooled for week 24 data. This pooling of data allowed for a maximum sample without compromising the validity of the data or the conclusions drawn from the results.
For anthropometric and biochemical outcomes, average change(s) from baseline were calculated (both absolute and % change) for the following time-points: weeks 4, 12, 24, and FV. To examine within-person longitudinal changes, Wilcoxon signed-rank tests were employed. The Wilcoxon test is used to test changes in a single sample with non-parametric data (i.e., non-parametric paired t-test).
For assessment of compliance, the attendance variable (i.e., % of time compliant with prescribed attendance) was created using the number of weeks a client actually attended appointments divided by the number of weeks a client was prescribed to attend. Percent compliance variables were also created for the other 4 compliance factors using the total incidences of each variable over the period of the program divided by number of weeks attended (e.g., 15 food journals received over 20 weeks attended = 75% compliant). Alternatively, all compliance variables (with the exception of attendance) were examined as count variables (i.e. number of occurrences) in a second set of multivariate regression analyses (described below).
Random effects regression models were used to examine the association between compliance factors and weight change (i.e., between baseline and final visit). Random effects allows for robust modeling with a subject-specific interpretation, and adjustment for unmeasured betweenindividual heterogeneity (with the assumption that heterogeneity does not correlate with outcome). % compliance variables were first examined individually in bivariate models. Then, all compliance variables were added to one multivariate model, using two approaches: one approach in which all % compliance variables were used (i.e., each individual variable controlled for attendance) and one in which all compliance factors were simply count variables (described above). A stepwiselike approach was used for multivariate modeling during which variables were dropped or kept after examining proxies for model efficiency (Wald Chi2 and number of variables).
Significance was defined as p < 0.05. Analyses were conducted using SPSS Version 14.0 and Stata Version 10.
3. Results
3.1. Subjects
Client charts were obtained from 3 MWCC locations in Texas: Plano, Allen and Highland Village (35%, 30.9% and 33.9%, respectively). The majority of clients in the 446 person sample were female (86.5% vs. 13.5% male) and married (70.6%). The average age was 47 years (Table 1). Most (95.7%) reported that it was a personal decision (vs. spousal or doctor encouragement) that prompted their first visit to a MWCC.
3.2. Prescribed Program Length, Attendance, and Retention
Clients were prescribed active weight loss programs
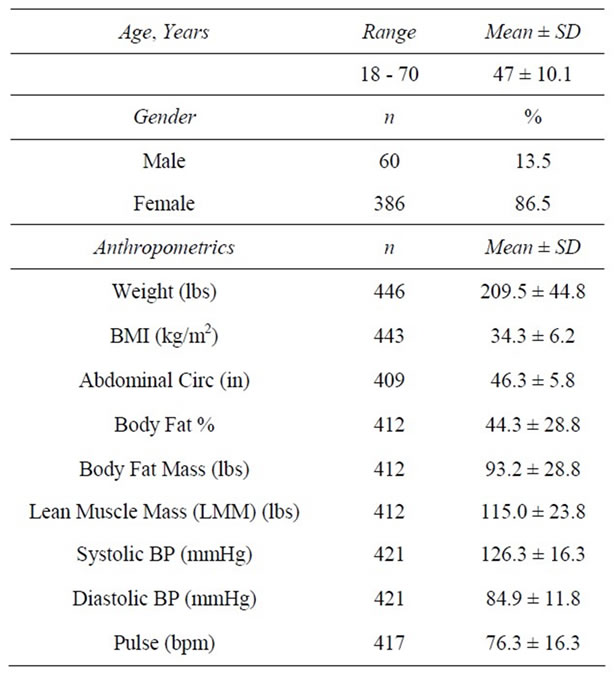
Table 1. Baseline characteristics.
ranging from 5 to 67 weeks (x̅ = 18.2 ± 9.2) based on the estimated time needed to achieve individualized goal weights. The average length of time spent in the active weight loss phase was 19.6 ± 13.5 weeks. 87.7% of those prescribed at least 4 weeks of active weight loss attended the Week 4 visit (Table 2). 64.4% of those prescribed at least 12 weeks attended the Week 12 visit (Table 3) and 43.8% of those prescribed at least 24 weeks attended the Week 24 visit (Table 4). Results are shown for clients that attended at 4, 12, and 24 weeks during the active weight loss phase. Results for the final visit (during active weight loss), for which time varies by client, are also shown and include data for clients whose final visit occurred: 1) before week 4; 2) on week 4, 12, or 24; and 3) between or after weeks 4, 12, or 24 (Table 5). (As stated above, the average length of time from baseline to final visit was 19.6 ± 13.5 weeks. The range for baseline to final visit was 3 days to 85 weeks.) As part of their overall weight management program, clients were provided Transition and Maintenance plans to follow after completion of the active weight loss phase (described above, in the Methods section). One hundred fifty-four individuals began, and spent an average of 7.9 ± 5.4 weeks, in the Transition phase. Ninety-one individuals started the Maintenance phase; the average length of Maintenance was 16.3 ± 16.3 weeks (range: 0 to 63 weeks). There were no adverse events noted during the review of the charts. The most common side effects were constipation and fatigue, reported by 15.4% (n = 67) and 8.3% (n = 36) of clients, respectively.
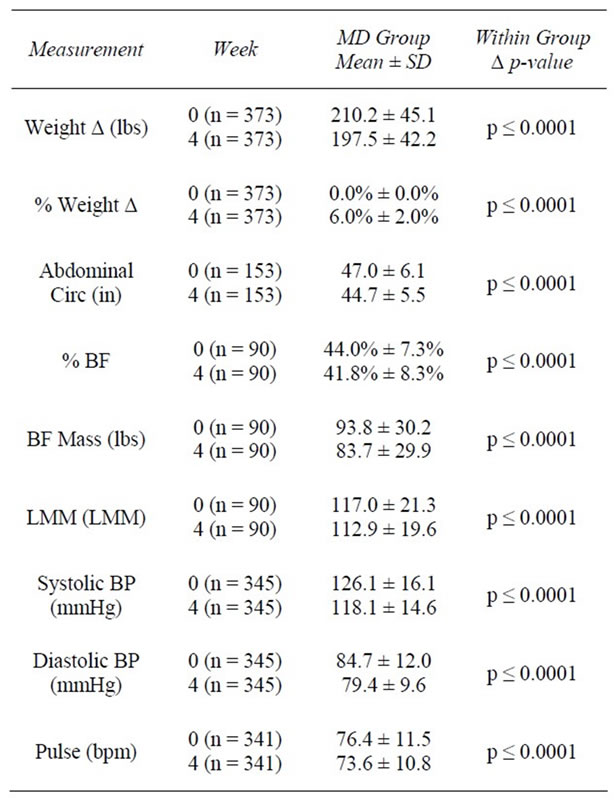
Table 2. Weeks 0 - 4.
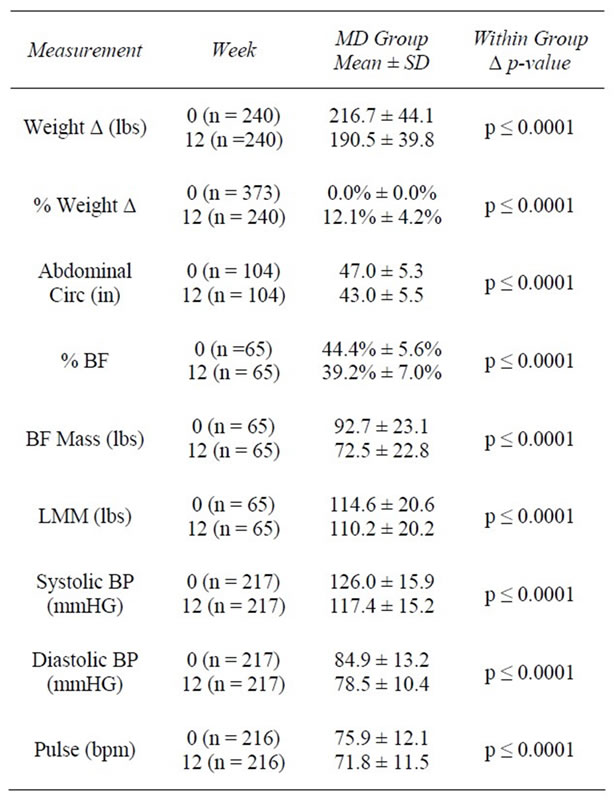
Table 3. Weeks 0 - 12.
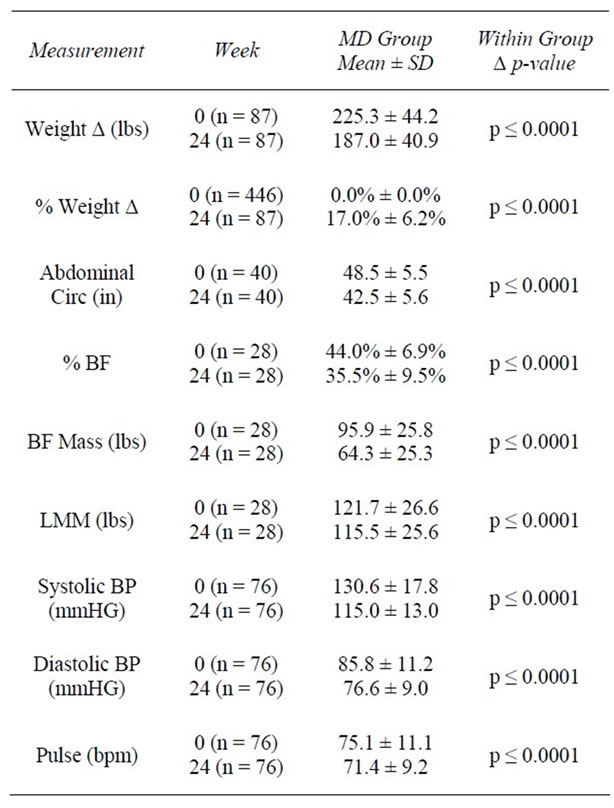
Table 4. Weeks 0 - 24.
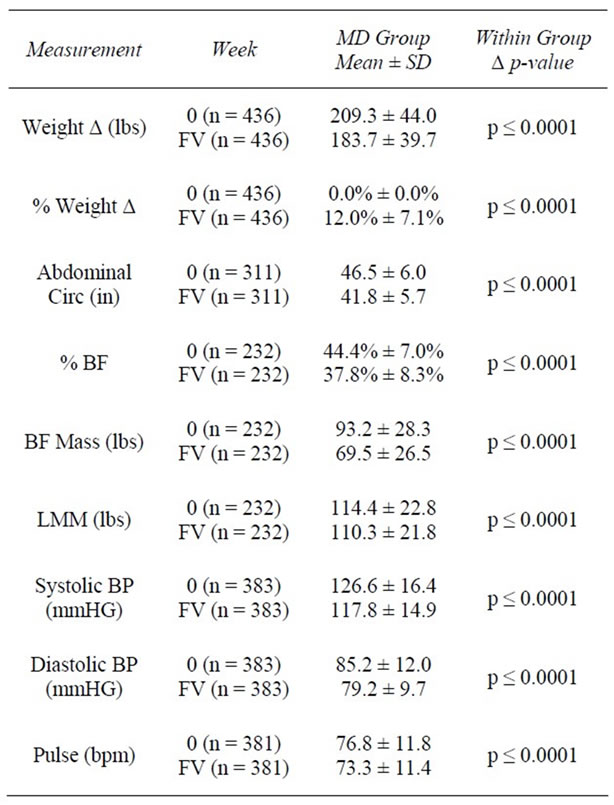
Table 5. Weeks 0 - FV.
3.3. Weight
At baseline, the average weight of clients was 209.5 ± 44.8 lbs with an average BMI of 34.3 ± 6.23 kg/m2. One hundred twelve (25.3%) were overweight (BMI ≥ 25 and <30 kg/m2), 160 (36.1%) had Class I Obesity (BMI ≥ 30 and <35 kg/m2); 105 (23.7%) had Class II Obesity (BMI ≥ 35 and <40 kg/m2), and 66 (14.9%) had Class III Obesity (BMI ≥ 40 kg/m2). At 4 weeks, clients had lost an average of 12.7 ± 5.1 lbs (−6.0%) from baseline weight (z = 16.7, n = 373, p < 0.0001). At 12 weeks, clients had lost an average of 26.2 ± 11.7 lbs (−12.1%) from baseline (z = 13.4, n = 240, p < 0.0001). Among those remaining at 24 weeks (n = 87), an average loss of 38.2 ± 16.0 lbs (−17.0%) was achieved. As previously noted, final visit (FV) describes the last weekly visit each individual attended during active weight loss. At FV, an average decrease of 25.7 ± 17.1 lbs (−12.0%) from baseline had been achieved among all participants (n = 436) (Tables 2-5).
Following active weight loss, 154 clients entered transition with a mean weight of 169.6 ± 32.2 lbs. During Transition, clients regained a modest amount of weight (1.0 ± 4.4 lbs; z = 2.8, p = 0.005); however, at the end of Transition, significant weight loss from baseline was sustained (−33.9 lbs, −16.2%; z = 10.8, p < 0.0001).
Ninety-one individuals entered Maintenance, starting this phase of the program with an average weight of 169.0 ± 28.2 lbs. Participants gained an average of 4.1 lbs (+2.5%; z = −6.0; p < 0.0001); however, significant weight loss was maintained from baseline (−31.5 lbs, −15.1%; z = 8.2; p < 0.0001).
3.4. Body Composition, Percent Body Fat and Lean Muscle Mass
Following the first 4 weeks of weight loss, % BF decreased on average 2.2%, representing a 5.6% reduction from baseline (z = −7.6, n = 90, p < 0.0001). LMM, in lbs, decreased 3.3% from baseline (z = −7.2, n = 90, p < 0.0001); however, when examining LMM as a proportion of TBW, percent lean muscle (% LMM) increased 3.5% from baseline (z = −7.0, n = 86, p < 0.0001) (Table 2, Figure 1).
By 12 weeks, % BF decreased from 44.4% to 40.2%, representing a 12.1% reduction from baseline (z = 7.0, n = 65, p < 0.0001). Similar to results seen at 4 weeks, total LMM decreased at 12 weeks; however, the % LMM in relation to TBW increased by 9.8% from baseline (z = 6.5, n = 56, p < 0.0001). By 24 weeks, BFM was reduced by 31.6 lbs (z = 4.1, n = 28, p < 0.0001) and % BF had decreased by 8.5% from baseline (z = 4.6, n = 28, p < 0.0001). Consistent with weeks 4 and 12, total LMM decreased (−6.3 lbs; z = 4.1, n = 28, p < 0.0001); however, % LMM as a proportion of TBW increased by 16.0% (z = 3.4, n = 17, p = 0.001) (Tables 3 and 4, Figure 1).
Overall, clients lost significant amounts of BFM and LMM between baseline and final visit (−23.5 lbs and −4.1 lbs, respectively); however, when expressed as a proportion of TBW, % BF decreased over the course of the program, while % LMM increased. Specifically, % BF was reduced from 44.3% to 37.8%, representing a 15% reduction between baseline and final visit (z = 13.1, n = 232, p < 0.0001). LMM, as a proportion of TBW, rose from 55.4% to 62.9%, representing a 13.9% increase during the program (z = 12.9, n = 233, p < 0.0001) (Table 5, Figure 1).
3.5. Abdominal Circumference
In the first 4 weeks of active weight loss, AC (inches) was reduced from an average of 46.3 ± 5.8 inches to 44.7 ± 5.4 inches, representing a 4.6% decrease (z = −10.1, n = 153, p < 0.0001). At 12 weeks, AC had decreased by an average of 4 inches or 8.5% from baseline (z = −8.8, n = 104, p < 0.0001). By 24 weeks, clients had lost an average of 6 inches or 12.3% of their baseline AC (z = −5.5, n = 40, p < 0.0001). When all FV data were considered, clients reduced their abdominal measurements an average of 4.7 inches (−9.9%) from baseline (z = −15.0, n = 311, p < 0.0001) (Tables 2-5).
3.6. Blood Pressure
At baseline, systolic BP (SBP) was 126.3 ± 16.3 millimeters of mercury (mmHg), and diastolic BP (DBP) was 84.9 ± 11.8 mmHg. After 4 weeks of active weight loss, SBP decreased by 8.0 ± 15.3 mmHg and DBP decreased by 5.3 ± 11.7 mmHg (z = −8.7, n = 345, p < 0.0001 and z = 8.7, n = 345, p < 0.0001, respectively), reducing average BP to 118/79 mmHg (Table 2). Average BP continued to significantly decrease over time from baseline. By
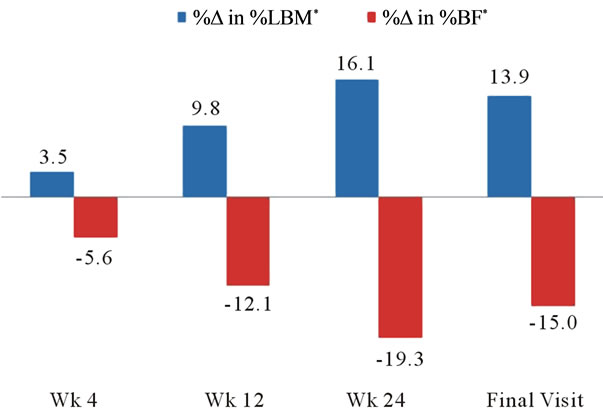
Figure 1. Changes in body composition. *%Δ was significant at all time points at p ≤ 0.001.
week 12, average SBP was 117.2 ± 15.2 mmHg and average DBP was 78.4 ± 10.3 mmHg (p < 0.0001) (Table 3). By week 24, average SBP decreased to 115.1 ± 12.8 mmHg (down 15.6 mmHg and 10.9% from baseline; z = −6.1, n = 76, p < 0.0001) and average DBP was 76.5 ± 9.0 mmHg (down 9.2 mmHg and 9.6% from baseline; z = −6.1, n = 76, p < 0.0001) (Table 4). For the 383 members with baseline and final visit measurements, both SBP and DBP were significantly reduced from baseline. SBP decreased to an average of 117.8 mmHg (6.1%; z = 9.6, n = 383, p < 0.0001) and DBP to 79.2 mmHg (6.0%; z = 9.7, n = 383, p < 0.0001) (Table 5). At baseline, 90 (21.4%) of 421 clients had a normal BP reading (SBP < 120 and DBP ≤ 80 mmHg), whereas 331 (78.6%) had an elevated BP reading (SBP ≥ 120 and/or DBP ≥ 80 mmHg). Of those with elevated BP, 173 (41.1%) had prehypertension (SBP ≥ 120 and < 140 or DBP ≥ 80 and <90 mmHg), and 158 (37.5%) had hypertension (SBP ≥ 140 or DBP ≥ 90). From baseline to week 4, of the 345 available BP measurements, 44.3% (n = 153) showed improvement, 45.5% (n = 157) showed no change, and 10.1% (n = 35) showed poorer BP results (Table 6). Of those with BP improvement, 43.8% (n = 67) improved from prehypertension to normotension, 19.0% (n = 29) improved from hypertension to normotension, and 37.3% (n = 57) improved from hypertension to prehypertension (Table 6).
This trend continued through the 12 and 24 week time points. For the 383 clients that had baseline and final visit measurements, 43.3% (n = 166) showed no change, 45.4% (n = 174) showed improvement, and 11.2% (n = 43) showed poorer BP results. For the 174 that saw a positive change, 39.7% (n = 69) improved from prehypertension to normotension, 23.0% (n = 40) improved from hypertension to normotension, and 37.4% (n = 65) improved from hypertension to prehypertension (Table 6).
3.7. Pulse
At baseline, average resting pulse was 76.7 ± 11.5 beats per minute (bpm). By week 4, pulse was significantly reduced by 2.9 bpm to an average of 73.5 ± 10.8 bpm, a 3% reduction from baseline (z = −5.1, n = 341, p < 0.0001). By week 12, average pulse was 71.8 ± 11.5 bpm, a decrease of 4.1 bpm (4.5%) from baseline (z = −4.9, n = 216, p < 0.0001); representing an additional (and statistically significant) 1.1% reduction from the 4 week measurement. While there were no significant changes in pulse between weeks 12 and 24, the reductions achieved during the first 12 weeks were sustained, for an average pulse at 24 week of 71.2 ± 9.4 bpm, a 3.7% decrease from baseline (z = −2.8, n = 76, p = 0.005). At the final
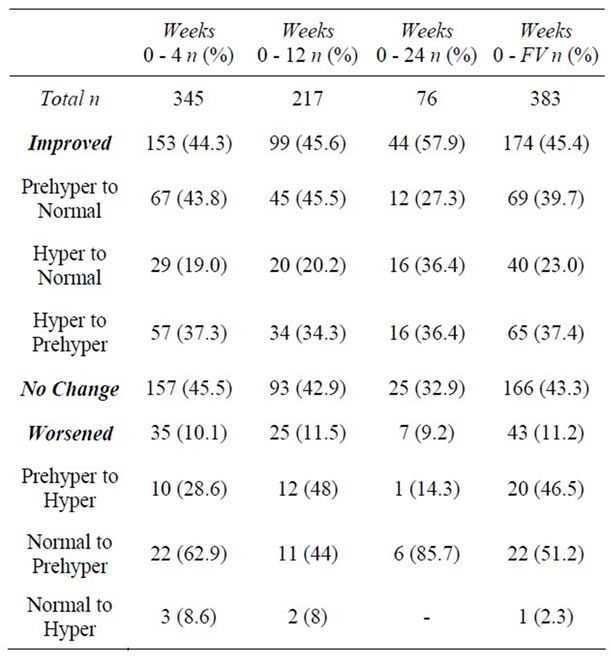
Table 6. Changes in blood pressure category.
visit, pulse was reduced by 3.5 bpm from baseline to 73.3 ± 11.4 bpm (−3.4%; z = -5.5, n = 381, p < 0.0001).
3.8. Compliance
Compliance was assessed using 5 different factors: attendance at weekly visits, weekly food journal completion, the number of times omega-3 supplements were taken as recommended, the number of times 5 meal replacements were consumed as recommended, and the number of ketone tests taken.
On average, clients attended one weekly visit as prescribed throughout the entire course of treatment (±0.7). Compliance with attendance was highest during the first 4 weeks of active weight loss and decreased over time; 86.5% of individuals (n = 351/406) attended all 4 visits during the first four weeks, with an average of 4.6 ± 1.6 visits during this time frame. Just under half of those still in the study (n = 142/285; 49.8%) attended all 8 visits during weeks 5 - 12, with an average of 7.7 ± 2.8 visits during these 8 weeks. During weeks 13 - 24, 31.3% (n = 35/112) attended all 12 weekly visits, with an average of 10.6 ± 4.0 visits during this time.
Overall, clients returned a food journal for an average 53% of the weeks they attended. During the first 4 weeks, 32.3% (n = 131/406) returned a food journal at each visit, with an average of 3.1 ± 2.0 during this time. During weeks 5 - 12, 18.2% (n = 52/285) returned a food journal at each weekly visit with an average of 4.7 ± 3.8 food journals during this time. During the final 12 weeks of active weight loss, an average of 6.4 ± 5.6 food journals were returned, with only 10.7% (n = 12/112) returning a food journal for all of these weeks.
During active weight loss 5 MRs were to be consumed daily as part of the MD Plan. Each week, clients selfreported their compliance with the MRs. Among those who attended weekly visits, average compliance with MRs was 70%. Similar to attendance and food journals, compliance with MRs was best during the first 4 weeks with 42.6% (n = 173/406) reporting perfect (i.e., 100%) compliance. During weeks 5 - 12, this dropped to 27% (n = 77/285); however, this proportion remained relatively stable for the remainder of the active weight loss phase with 25% reporting perfect compliance (n = 28/112) during weeks 13 - 24.
As part of the weight loss regimen, two omega-3 supplements (providing 2440 mg of fish oil) were to be taken daily. As with the MRs, clients self-reported their compliance each week. Overall, clients reported perfect compliance an average of 76% of the weeks they attended. During the first 4 weeks, 54.2% (n = 220/406) of clients reported 100% compliance with the supplements. This remained relatively consistent through the next 8 week period (weeks 5 - 12) at 51.9% (n = 148/245) and decreased slightly during weeks 13 - 24 with 42.9% (n = 48/112) having reported taking all prescribed supplements.
Ketone testing at each visit was also part of the compliance assessment. For the duration of the active weight loss phase, clients were tested for ketones 96% of the weeks attended. During the first 4 weeks, 83.7% (n = 340/406) were tested for ketones with an average of 4.4 ± 1.5 tests during this time frame. During weeks 5 - 12, 81.1% (n = 231/285) of clients were tested weekly for ketones, with an average of 7.4 ± 2.8 during this 8 week period. Ketone testing remained high during the final 12 weeks of the weight loss phase at 77.7% (n = 87/112), with an average of 10.2 ± 2.8 tests during this period.
Using bivariate random effect (RE) regression models, the relationship between weight change (baseline to FV) and each of the 5 compliance factors was examined. Weight change was inversely associated with clients’ % compliance with attendance, food journals, MRs, and omega-3 supplementation (see statistical analysis section above for details regarding variable creation); however, it was not associated with ketone testing (Table 7).
Two sets of multivariate regressions were employed. In the first set, all % compliance factors were entered as variables in a multivariate regression in order to examine the independent effects of the individual compliance components on weight change (dependent variable), while controlling for the remaining factors. The only % compliance factors that remained statistically associated with weight change were attendance (β = −17.0, p < 0.0001) and omega-3 supplementation (β = −11.5, p = 0.05; Model Wald Chi-Square = 46.9, df = 5, R2 = 0.087). In the second set of multivariate regressions, the compliance factors were represented as count measures with one exception, attendance; this variable remained as % compliance so as to control for the varying lengths of prescribed programs (i.e., number of weeks attended/number of weeks prescribed to attend). In all of the models using the second approach, the R-squared values (a measure of the ability of the independent variables to explain the variance in the dependent variable) were significantly higher compared to that from the first set. Using this second set of compliance variables, a stepwise-like approach was used to decide which variables to keep and drop.
The most efficient model revealed a strong inverse relationship between weight change and % compliance with attendance (β = −41.5, p < 0.0001) and the number of weeks that MRs were taken as recommended (β = −1.3, p = 0.001). Additionally, a positive association with number of ketone tests was found (β = 2.9, p < 0.0001; Model Wald Chi-Square = 147.7, df = 3, R2 = 0.224) (Table 8).
4. Discussion
The use of portion-controlled MR plans [14] and structured weight loss programs that provide a high level of
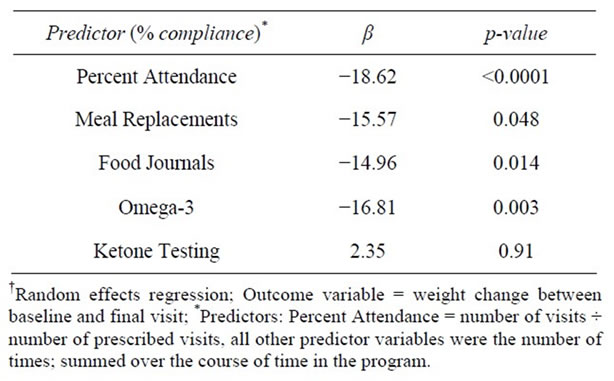
Table 7. Predictors of weight change-bivariate RER†.
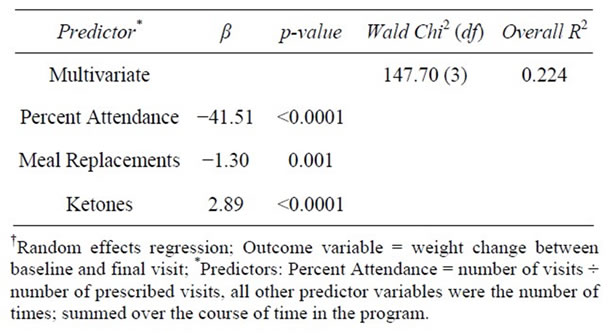
Table 8. Predictors of weight change-multivariate RER†.
support [30] have both been shown to independently predict weight loss success in the shortand long-term. This study sought to evaluate the combined effect of using MRs with a structured weight-loss plan and lifestyle program on body weight, body composition, and healthrelated outcomes.
The combination of portion-controlled meal replacements and a structured lifestyle program featuring individual weekly visits offered through the MWCC yielded robust weight loss and weight maintenance results. Clinically significant weight loss, defined by the Institute of Medicine as a loss of at least 5% of starting body weight in one year [31,32], was achieved by clients at all time points (4, 12, 24 wks and FV). After 24 weeks, clients reduced their total body weight by an average of 38 lbs, representing a 17% decrease. Weight loss of this nature is comparable to that obtained with double-drug obesity pharmacotherapy [33], yet without the potential health risks and side effects. Moreover, considering the phenomenon of universal weight regain, clients were able to keep off an average of 97.5% of lost body weight by the end of the maintenance phase, which lasted 16 weeks. This is significantly better than maintenance results noted in the literature for other commercial diet plans [34,35].
One of the distinguishing features of the MD plan, perhaps more important than the weight loss itself, is the targeted loss of body fat. Consistent with previously published research results [15], favorable changes in body composition, particularly loss of the body fat compartment, were observed at all time points by MWCC clients. By week 24, clients had achieved an 8.5% decrease in body fat, which was equivalent to a 31.5 lbs reduction of fat tissue. Other MR plans have shown much less favorable results; in one, only a 2.9% decrease in body fat was reported over the same period in a sample with a similar baseline BMI [36]. In another study comparing a MR program and a structured diet and exercise program, % body fat decreases were only 0.6% and 1.4% respectively after 22 weeks [37].
Even more astounding than the targeted loss of body fat was the proportional gain in lean muscle mass at all time points. Sustaining lean muscle mass is a critical physiologic mechanism for maintaining weight loss, as muscle provides a higher contribution to resting metabolic rate than does fat [38-40]. The preservation of lean muscle tissue and targeted elimination of fat is fostered by the balanced macronutrient composition of the MD plan.
Rivaling the significance of targeted fat loss and simultaneous preservation of lean muscle tissue is the accompanying reduction in visceral fat from the midsection, with significant reductions in abdominal circumference at all time points measured. Abdominal fat has been shown to be an independent risk factor for metabolic syndrome and cardiovascular disease [41], and contributes to health disease risk comparable to smoking [42]. Previous research has shown that a relatively modest decrease in waist circumference (WC) of ≥3 cm yielded significant improvement in cardiometabolic risk factors [43]. This magnitude of decreasing AC was exceeded at all time points, highlighting the potential clinical benefit for MWCC clients. These results are consistent with previous findings obtained by the MD plan versus an isocaloric control group [15]. In that study, reductions in markers of inflammation and oxidative stress, two known risk factors for cardiovascular disease and cancer [44], were also found.
In alignment with previously published health-related outcomes for the MD Plan, statistically significant improvements were obtained for all cardiovascular outcome variables (systolic and diastolic BP, pulse, and AC) at all time points throughout the study. Reductions in systolic and diastolic BP were robust enough to shift many clients from a prehypertensive state to a normotensive state (120/80 mmHg). These improvements in BP and the resulting shift in BP categories occurred for some after only 4 weeks of weight loss, indicating improvements in health outcomes can occur quickly on this program. Additionally, between 44.3% and 57.9% of clients saw an improvement in their blood pressure category at the various time points, with nearly 2/3 of those becoming normotensive by their final visit.
4.1. Limitations
While the time frame and sample size of this study are sufficient to demonstrate significant improvements in weight and other relevant outcomes for the overall clinical benefit of MWCC clients, there are limitations. This study is a retrospective chart review of the MD plan in the MWCC, making randomization and the use of a control group impossible. While the majority of the sample is female, this is representative of the persons who typically become clients at the MWCC. There is a decreasing sample size over time and lack of long-term follow-up beyond the maintenance period recorded here. The sample size decreased over time for two main reasons: 1) Over time there were fewer clients with prescribed weight-loss programs of longer lengths (i.e. 12 and 24 weeks) and 2) Clients who chose to leave the program before the end of their prescribed number of program weeks for a variety of reasons (e.g. goal achievement, lack of results, financial and time constraints, etc.) However, attrition is common for commercial weight-loss plans and long-term weight loss research in general [21, 45].
In addition to program attrition, due to the optional nature of body composition testing along with client time constraints at the appointed measurement visit, instrument availability, or client refusal; body composition analysis may have occurred at different intervals, or not at all, which resulted in an even smaller sample size for these measurements. To evaluate potential bias because body composition testing was a purchasable option, we examined characteristics and other relevant outcomes for those with any body composition data and those without. Interestingly, it was found that those who opted to have body composition measured at baseline did not lose significantly more body weight than those who did not. However, when those with follow-up body composition measurements were compared to those without, it was found individuals with follow-up data had significantly better compliance and significantly greater weight loss results. While these findings reveal that the body composition results are not representative of the study sample as a whole, the magnitude and significance of the results are consistent with previously published results [25].
Lastly, although the data for weight maintenance were recorded, the sample size is relatively small compared to the baseline sample, and the duration in the maintenance period is relatively short. Additional prospective studies with defined body composition measurement parameters and follow-up of clients through a longer defined maintenance period would serve to confirm the body composition results and the program’s ability to maintain long-term weight loss.
4.2. Summary
Robust weightand health-related results were achieved by adherence to MD MR recommendations and attendance at weekly 1-on-1 support sessions offered through the MWCC. The weight loss and fat loss achieved by MWCC clients was not only significant, but translated into concrete health benefits, as demonstrated by improvements in BP. Adherence to MR recommendations (β = 15.57, p = 0.048) and attendance (β = 18.62, p < 0.001) were the strongest predictors of weight-loss success. The MD plan may bolster success by fostering ease of use among clients, and therefore compliance, on both a shortand long-term basis [14,46]. This supports the existing research demonstrating the benefit of MRs in weight management [47]. Simply speaking, “showing up” was found to be the strongest predictor of weight loss. Clients who attended appointments at least once a week lost significantly more weight at 6 months (17.5%) than those who attended appointments less frequently (13.3%). These results underscore the importance of combining a structured MR program with a highly supportive environment to promote clinically significant weight loss, successful weight loss maintenance, and improvements in cardiovascular health outcomes.
5. Disclosures
C. Coleman, J. Kiel, C. Sonzone, N. Fuller, and L. Davis were employees of Medifast, Inc., the sponsor of this research, when this study was conducted. A. Mitola is a paid consultant biostatistician for Medifast, Inc.
6. Acknowledgements
We would like to thank the MWCC staff at the Allen, Plano, and Highland Village locations for their cooperation and assistance in completing this study.
REFERENCES
- A. Alwan, “Global Status Report on Noncommunicable Diseases,” World Health Organization, 2010. http://www.who.int/nmh/publications/ncd_report2010/en
- C. L. Ogden and M. D. Carroll, “Prevalence of Overweight, Obesity, and Extreme Obesity, among Adults: United States, Trends 1960-1962 through 2007-2008,” National Health and Nutrition Examination Survey, National Center for Health Statistics: Health-E Stats, 2010. http://www.cdc.gov/nchs/data/hestat/obesity_adult_07_08/obesity_adult_07_08.pdf
- M. S. Westerterp-Plantenga and E. M. R. Kovacs, “The Effect of (-)-Hydroxycitrate on Energy Intake and Satiety in Overweight Humans,” International Journal of Obesity, Vol. 26, No. 6, 2002, pp. 870-872.
- B. A. Swinburn, I. Caterson, J. C. Seidell and W. P. T. James, “Diet Nutrition and the Prevention of Excess Weight Gain and Obesity,” Public Health Nutrition, Vol. 7, No. 1A, 2004, pp. 123-146.
- B. Arsenault, J. Rana, K. Khaw, et al, “Physical Inactivity, Abdominal Obesity and Risk of Coronary Heart Disease in Apparently Healthy Men and Women,” International Journal of Obesity, Vol. 34, No. 2, 2010, pp. 340-347. doi:10.1038/ijo.2009.229
- L. J. Prior and J. A. Armitage, “Neonatal Overfeeding Leads to Developmental Programming of Adult Obesity: You Are What You Ate,” The Journal of Physiology, Vol. 587, No. 11, 2009, pp. 2419-2419. doi:10.1113/jphysiol.2009.174045
- S. Ramachandrappa and I. Farooqi, “Genetic Approaches to Understanding Human Obesity,” The Journal of Clinical Investigation, Vol. 121, No. 6, 2011, pp. 2080-2086. doi:10.1172/JCI46044
- F. Tsai and W. Coyle, “The Microbiome and Obesity: Is Obesity Linked to Our Gut Flora?” Current Gastroenterology Reports, Vol. 11, No. 4, 2009, pp. 307-313. doi:10.1007/s11894-009-0045-z
- “What is Obesity?” 2 June 2009. http://www.obesity.org/information/what_is_obesity.asp
- J. Jakicic, et al., “Appropriate Interventions Strategies for Weight Loss and Prevention of Weight Regain for Adults,” Medicine & Science in Sports & Exercise, Vol. 41, No. 2, 2001, pp. 2145-2154. doi:10.1097/00005768-200112000-00026
- L. Grant and L. Gotthelf, “Successful Weight Maintenance in a Telephone-Based Treatment Program,” Obesity Research, Vol. 12, No. A44, 2004, p. A44.
- L. Gotthelf, J. Anderson and B. O’Brien, “Weight Loss in Overweight or Obese Individuals with Different Structured Interventions in an Intense Behavioral Program,” Obesity Research, Vol. 12, No. A40, 2004, p. A40.
- E. A. Furlow and J. W. Anderson, “A Systematic Review of Targeted Outcomes Associated with a Medically Supervised Commercial Weight-Loss Program,” Journal of the American Dietetic Association, Vol. 109, No. 8, 2009, pp. 1417-1421. doi:10.1016/j.jada.2009.05.003
- S. B. Hemsfield, C. A. J. Van Mierlo, H. C. M. Van der Knaap, M. Heo and H. I. Frier, “Weight Management Using a Meal Replacement Strategy: Meta and Pooling Analysis from Six Studies,” International Journal of Obesity, Vol. 27, No. 5, 2003 pp. 537-549. doi:10.1038/sj.ijo.0802258
- L. M. Davis, C. D. Coleman, J. Kiel, J. Rampolla, T. Hutchisen, L. Ford, W. S. Anderson and A. Hanlon-Mitola, “Efficacy of a Meal Replacement Diet Plan Compared to a Food-Based Diet Plan after a Period of Weight Loss and Weight Maintenance: A Randomized Controlled Trial,” Nutrition Journal, Vol. 9, 2010, pp. 11-20. doi:10.1186/1475-2891-9-11
- C. K. Haddock, W. S. Poston, J. P. Foreyt, J. J. DiBartolomeo and P. O. Warner, “Effectiveness of Medifast Supplements Combined with Obesity Pharmacotherapy: A Clinical Program Evaluation,” Eating and Weight Disorders Vol. 13, No. 2, 2008, pp. 95-101.
- G. D. Foster, K. E. Borradaile, S. S. V. Veur, K. LehShantz, R. J. Dilks, E. M. Goldbacher, T. L. Oliver, C. A. Lagrotte, C. Homko and W. Satz, “The Effects of a Commercially Available Weight Loss Program among Obese Patients with Type 2 Diabetes,” Postgraduate Medicine, Vol. 121, No. 5, 2009, pp. 113-118. doi:10.3810/pgm.2009.09.2046
- C. Wilborn, J. Beckham, B. Campbell, T. Harvey, M. Galbreath, P. La Bounty, E. Nassar, J. Wisman and R. Kreider, “Obesity: Prevalence, Theories, Medical Consequences, Management, and Research Directions,” Journal of the International Society of Sports Nutrition, Vol. 2, No. 2, 2005, pp. 4-31. doi:10.1186/1550-2783-2-2-4
- S. A. Jebb, A. L. Ahern, A. D. Olson, L. M. Aston, C. Holzapfel, J. Stoll, U. Amann-Gassner, A. E. Simpson, N. R. Fuller, S. Pearson, N. S. Lau, A. P. Mander, H. Hauner and I. D. Caterson, “Primary Care Referral to a Commercial Provider for Weight Loss Treatment versus Standard Care: A Randomised Controlled Trial,” Lancet, Vol. 378, No. 9801, 2011, pp. 1485-1492. doi:10.1016/S0140-6736(11)61344-5
- C. Collins, J. Jones and D. Sherwood, “Formulated Meal Replacements: A Comparison of the Nutritional Adequacy of Available Products,” Nutrition and Dietetics, Vol. 66, No. 1, 2009, pp. 12-19. doi:10.1111/j.1747-0080.2008.01312.x
- A. M. Coppen, J. A. Risser and P. D. Vash, “Metabolic Syndrome Resolution in Children and Adolescents after 10 Weeks of Weight Loss,” Journal of the Cardiometabolic Syndrome, Vol. 3 No. 4, 2008, pp. 205-210. doi:10.1111/j.1559-4572.2008.00016.x
- J. S. Bland and F. Dibiase, “Physiological Effects of a Doctor-Supervised versus an Unsupervised Over-theCounter Weight-Loss,” Journal of Nutritional Medicine, Vol. 3, No. 3-4, 1992, p. 285. doi:10.3109/13590849208997984
- J. W. Anderson and M. A. Jhaveri, “Reductions in Medications with Substantial Weight Loss with Behavioral Interventions,” Current Clinical Pharmacology, Vol. 5, No. 4, 2010, pp. 232-238. doi:10.2174/157488410793352030
- R. B. Kreider, C. Rasmussen, C. M. Kerksick, C. Wilborn, et al, “A Carbohydrate-Restricted Diet during Resistance Training Promotes More Favorable Changes in Body Composition and Markers of Health in Obese Women with and without Insulin Resistance,” The Physician and Sports Medicine, Vol. 39, No. 2, 2011, pp. 27-40. doi:10.3810/psm.2011.05.1893
- A. Tsai and T. Wadden, “Systematic Review: An Evaluation of Major Commercial Weight Loss Programs in the United States,” Annals of Internal Medicine, Vol. 142, No. 1, 2005, pp. 56-66.
- F. R. Volkmar, A. J. Stunkard, J. Woolston and R. A. Bailey, “High Attrition Rates in Commercial Weight Reduction Programs,” Archives of Internal Medicine, Vol. 141, No. 4, 1981, pp. 426-428.
- C. K. Martin, L. Talamini, A. Johnson, A. M. Hymel and O. Khavjou, “Weight Loss and Retention in a Commercial Weight Loss Program and the Effect of Corporate Partnership,” International Journal of Obesity, Vol. 34, No. 4, 2010, pp. 742-750. doi:10.1038/ijo.2009.276
- A. L. Ahern, A. D. Olson, L. M. Aston and S. A. Jebb, “Weight Watchers on Prescription: An Observational Study of Weight Change among Adults Referred to Weight Watchers by the NHS,” BMC Public Health, Vol. 11, 2011, p. 434. doi:10.1186/1471-2458-11-434
- S. C. Bischoff, A. Damms-Machado, C. Betz, S. Herpertz, et al., “Multicenter Evaluation of an Interdisciplinary 52- Week Weight Loss Program for Obesity with Regard to Body Weight, Comorbodities and Quality of Life: A Prospective Study,” International Journal of Obesity, Vol. 36, No. 4, 2012, pp. 614-624. doi:10.1038/ijo.2011.107
- T. Wadden, R. Neiberg, M. Vitolins, et al., “Four-Year Weight Losses in the Look Ahead Study: Factors Associated with Long-Term Success,” Obesity, Vol. 19, No. 10, 2011, pp. 1987-1998. doi:10.1038/oby.2011.230
- P. R. Thomas, “Weighing the Options: Criteria for Evaluating Weight Management Programs,” National Academy Press, Washington DC, 1995. doi:10.1037/10510-000
- D. J. Goldstein, “Beneficial Health Effects of Modest Weight Loss,” International Journal of Obesity and Related Metabolic Disorders, Vol. 16, No. 6, 1992, pp. 397- 415.
- FDA, “VI-0521 (Qnexa®) Advisory Committee Briefing Document,” Endocrinologic and Metabolic Drugs Advisory Committee Meeting, Mountain View, 22 Feburary 2012.
- M. Lowe, T. Kral and K. Miller-Kovach, “Weight-Loss Maintenance 1, 2 and 5 Years after Successful Completion of a Weight-Loss Programme,” The British Journal of Nutrition, Vol. 99, No. 4, 2008, pp. 925-930. doi:10.1017/S0007114507862416
- C. Rock, S. Flatt, N. Sherwood, N. Karanja, B. Pakiz and C. Thomson, “Effect of a Free Prepared Meal and Incentivized Weight Loss Program on Weight Loss and Weight Loss Maintenance in Obese and Overweight Women: A Randomized Controlled Trial,” Journal of the American Medical Association, Vol. 304, No. 16, 2010, pp. 1803- 1811. doi:10.1001/jama.2010.1503
- X. Wang, G. Miller, S. Messier and B. Nicklas, “Knee Strength Maintained Despite Loss of Lean Body Mass during Weight Loss in Older Obese Adults with Knee Osteoarthritis,” Journals of Gerontology Series A: Biological Sciences & Medical Sciences, Vol. 62A, No. 8, 2007, pp. 866-871. doi:10.1093/gerona/62.8.866
- R. Kreider, M. Serra, S. Jonnalagadda, et al., “A Structured Diet and Exercise Program Promotes Favorable Changes in Weight Loss, Body Composition, and Weight Maintenance,” Journal of the American Dietetic Association, Vol. 111, No. 6, 2011, pp. 828-843. doi:10.1016/j.jada.2011.03.013
- L. Garby, J. Garrow, J. Webster, et al., “Relation between Energy Expenditure and Body Composition in Man: Specific Energy Expenditure in Vivo of Fat and Fat-Free Tissue,” European Journal of Clinical Nutrition, Vol. 42, No. 4, 1998, pp. 301-305.
- K. Nelson, R. Weinsier, C. Long and Y. Schutz, “Prediction of Resting Energy Expenditure from Fat-Free Mass and Fat Mass,” The American Journal of Clinical Nutrition, Vol. 56, No. 5, 1992, pp. 848-856.
- J. Cunningham, “A Reanalysis of the Factors Influencing Basal Metabolic Rate in Normal Adults,” The American Journal of Clinical Nutrition, Vol. 33, No. 11, 1980, pp. 2372-2374.
- A. Kotronen, H. Yki-Järvinen, T. Sørensen, et al., “Comparison of the Relative Contributions of Intra-Abdominal and Liver Fat to Components of the Metabolic Syndrome,” Obesity, Vol. 19, No. 1, 2011, pp. 23-28. doi:10.1038/oby.2010.137
- V. Ajay and D. Prabhakaran, “Coronary Heart Disease in Indians: Implications of the Interheart Study,” The Indian Journal of Medical Research, Vol. 132, No. 5, 2010, pp. 561-566.
- B. Balka, P. Picard, S. Vol, L. Fezeu and E. Eschwège, “Consequences of Change in Waist Circumference on Cardiometabolic Risk Factors over 9 Years: Data from an Epidemiological Study on the Insulin Resistance Syndrome (DESIR),” Diabetes Care, Vol. 30, No. 7, 2007, pp. 1901-1903. doi:10.2337/dc06-2542
- A. Fernandez-Sanchez, E. Madrigal-Santillan, M. Bautista, et al., “Inflammation, Oxidative Stress, and Obesity,” International Journal of Molecular Sciences, Vol. 12, 2011, pp. 3117-3132. doi:10.3390/ijms12053117
- C. Finley, C. Barlow, F. Greenway, C. Rock, B. Rolls and S. Blair, “Retention Rates and Weight Loss in a Commercial Weight Loss Program,” International Journal of Obesity, Vol. 31, No. 2, 2007, pp. 292-298. doi:10.1038/sj.ijo.0803395
- L. Cheskin, A. Mitchell, T. Lycan, et al., “Efficacy of Meal Replacements versus a Standard Food-Based Diet for Weight Loss in Type 2 Diabetes: A Controlled Clinical Trial,” The Diabetes Educator, Vol. 34, No. 1, 2008, pp. 118-127. doi:10.1177/0145721707312463
- ADA, “Evidence Analysis Library,” 2012. http://www.adaevidencelibrary.com