Food and Nutrition Sciences
Vol. 2 No. 7 (2011) , Article ID: 7239 , 6 pages DOI:10.4236/fns.2011.27105
Free Glutamate Content of Condiment and Seasonings and Their Intake in Bogor and Jakarta, Indonesia
![]()
1Southeast Asian Food and Agricultural Science and Technology (SEAFAST) Center, Bogor Agricultural University, Bogor, Indonesia; 2Department of Food Science and Technology, Faculty of Agricultural Engineering and Technology, Bogor Agricultural University, Bogor, Indonesia; 3Department of Community Nutrition, Faculty of Human Ecology, Bogor Agricultural University, Bogor, Indonesia.
Email: *nuri@seafast.org
Received May 21st, 2011; revised July 26th, 2011; accepted August 3rd, 2011.
Keywords: Condiments, Free Glutamate Intake, Monosodium Glutamate, MSG Survey, Seasonings
ABSTRACT
Free glutamate has been known as flavor enhancer. Commercially, free glutamate is available in form of monosodium glutamate (MSG) crystal. Seasoning or premix may also contain free glutamate or MSG. The aim of the present study was focus on the deter-mination of the usage and potential/actual exposure of consumers to free glutamate from condiment and seasonings. There were several steps of the study, i.e. survey, laboratory analyses, data analyses, and evaluation of total exposure of free glutamate from condiment and seasonings. The survey was conducted to the 110 households in Bogor (rural) and 112 households in Jakarta (urban). The samples of condiment/seasoning were analyzed by using high performance liquid chromatography (HPLC) with fluorescent detector. The condiment/seasonings were categorized into 15 types, i.e. sweet soy sauce, salty soy sauce, fermented soybean paste, tomato sauce, MSG, premix seasoning, fermented fish/shrimp paste, chili sauce, ready to use seasoning, seasoned flour, dip and sauce, mayonnaise and mustard, spread, oyster and fish sauce, and teriyaki and others. The results of condiment/seasonings survey revealed that sweet soy sauce, MSG, and premix seasoning were used by most of households (±71% or more than 80 households) both in Bogor and Jakarta. The laboratory analyses of free glutamate from condime-nt/seasonings revealed that the highest free glutamate content was found in MSG (733.29 mg/g). Beside MSG, there were three other condiments that also had high free glutamate content, i.e. premix seasoning (70.77 mg/g in Bogor and 63.66 mg/g in Jakarta), oyster and fish sauce (46.76 mg/g in Bogor), and ready to use seasoning (15.71 mg/g in Jakarta). Although the average condiment/seasonings usage in Bogor (5.39 g/cap/day) was lower than that in Jakarta (9.62 g/cap/day), but the free glutamate intake from condiment/seasonings in Bogor (847.04 mg/cap/day) was higher than that in Jakarta (615.87 mg/cap/day). This was due to the high contribution of MSG that used in higher amount in Bogor.
1. Introduction
Monosodium glutamate (MSG) is a flavor enhancer which has been used effectively for nearly a century to bring out the best flavor of food. Its principal component is an amino acid called glutamate. Glutamate is found naturally in protein containing foods such as meat, poultry, and milk. Only free glutamate (in salt form with sodium or potassium) is effective in enhancing the flavor off foods. Some ingredients used in food processing such as autolyzed yeast, calcium caseinate, and hydrolyzed protein are known to contain free glutamate or MSG.
MSG is sold as fine white crystal substance, similar to appearance of salt or sugar. MSG and many ingredients that naturally contain MSG or added MSG such as premix seasoning have been deliberately added to foods as flavor enhancer at different level consumers.
Center for Food Safety and Applied Nutrition (CFSAN)-Food and Drugs Administration (FDA) has recognized that MSG and related substances are safe food ingredients for most people when eaten at customary levels [1]. This is also in line with the report of the Federation of American Societies for Experimental Biology (FASEB), once glutamate is ingested, our bodies make no distinction between the origins of the glutamate [2]. But still, their use in foods has been a controversial in the past thirty years because of the reports of adverse reaction in people who have eaten foods that contain MSG, although recent findings do not confirm the adverse reaction in respond to MSG consumption.
Addition of MSG or related products to their food has become a part of cooking habit in Indonesia. A survey conducted by [3] revealed that 2941 of 3063 (96%) households in six districts (2 districts in West Java, 2 districts in West Kalimantan, and 2 districts in South Sulawesi) in Indonesia were regular users of MSG; 73% (1853 households) of them used MSG in their cooking 5 - 7 days/week, and 31.9% (939) used MSG 2 - 4 days/week.
The aim of the present study was to determine the usage and potential/actual exposure of consumers to free glutamates from condiment and seasonings. No scientific study on free glutamate content in condiments have been conducted, although there were some information on popular publication reported MSG content in noodle based foods and snacks. Yayasan Lembaga Konsumen Indonesia (Indonesian Consumer Foundation) claimed that the MSG content in meat ball with noodle, noodle soup, and fried noodle were 1840 - 1900 mg/bowl, 2250 - 2780 mg/bowl, and 2900 - 3400 mg/bowl, respectively [4]. Other semi popular publication by [5] informed MSG content in snack. This publication described that Public Interest Research and Advocacy Center (PIRAC) has done survey on 13 brands of snack that frequently consumed by children. The MSG content on 13 brands of snack was ranged at 0.46% - 1.20%. In both publications, there were no information on the method of survey, analyses and calculation of MSG, as well as sampling size.
2. Materials and Methods
2.1. Study Area
The study was conducted in Jakarta as urban area and Bogor, a district of West Java Province, as rural area. The number of respondent in each area (N) is calculated using following formula:

where: 1.96 was Z value for or 95% confidence limit; P was estimated prevalence of free glutamate consumption (0.5); d was desired precision 0.1 for ±10%. By taking that calculation, the respondent of each survey area amounted to 110 respondents (Bogor) and 112 respondents (Jakarta), hence the total respondent was 222.
2.2. Survey Method
The information covered on the questionnaire of condiment usage includes type of condiment and seasonings and frequency of using them. The condiment and seasonings were categorized into 15 categories as follows: 1) Sweet soy sauce, 2) Salty soy sauce, 3) Tauco (fermented soybean paste), 4) Tomato sauce, 5) MSG, 6) Premix seasoning, 7) Fermented fish/shrimp paste, 8) Chili sauce, 9) Ready to use seasoning, 10) Seasoned flour, 11) Dip and sauce, 12) Mayonnaise and mustard, 13) Spread, 14) Oyster and fish sauce, and 15) Teriyaki and others. To help respondents memorizing the type of condiment and seasonings, the interviewers were equipped with set of photograph of condiment and seasoning types. Additional information was also added into the questionnaire i.e. category of socio-economic status, level of education of the head of household and the wife, the household’s income, and the “food expenditure”.
2.3. Data Survey Analyses
Data survey analyses were started from data verification and input. Based on the data obtained from survey, the condiment and seasoning usage of each category was calculated for total respondent and per capita in each area.
2.4. Laboratory Analysis
2.4.1. Sampling Plan
The sampling plan was developed based on percentage of consumption of each condiment/se-asoning. The criteria used for condiment/seasonings to be sampled were contributing to total consumption of more than 0.5% total consumption or consumed by more than 40% respondents although their consumption less than 0.5%. Sample for analyses was prepared as composite sample calculated based on minimum 90% of the total proportion of each condiment/seasoning in each area. There were 20 samples of condiment/seasonings consisted of 8 samples from Bogor and 12 samples from Jakarta area. An exception for MSG, which the same sample was used for Bogor and Jakarta, hence total samples analyzed was 19.
2.4.2. Sampling Methods for Condiment/Seasoning
Condiment/seasonings of Bogor were purchased in Bogor area, either from traditional markets or retailers, with different packages, whereas those of Jakarta were purchased from a supermarket in Jakarta area. The products with the same brand name and type but from different packages were mixed together using a blender and coded as sub-sample with the brand name. Each sample of condiment/seasonings was then made by weighing each subsample with different brand name according to the sample proportion of sampling plan. The final samples (single or composite) were then stored in freezer until used for analysis.
2.4.3. Analyses Method of Free L-Glutamic Acid Content
Free L-glutamic acid content was determined by the method of [6]. The method consisted of three steps, i.e. extraction, dansylation, and analysis by reverse phase high performance liquid chromatography (RP-HPLC). Free L-glutamic acid content (mg/g) in sample was then calculated by using formula:

where: w was weight of free L-glutamic from standard curve (µg); F was dilution factor (57,500); W was sample weight (g). Standard curve was made for every two weeks. Each standard solution was analyzed in three replicates (from derivatization to HPLC analysis). Each area plotted for standard curve was an average of three measurements. Each sample of condiments/seasonings was analyzed in two replicates (from extraction to derivatization-HPLC analysis). The result was reported as an average of two measurements.
2.4.4. Analyses Method of Moisture Content
Moisture content was measured by gravimetric method following the AOAC Method [7].
2.4.5. Data Analyses and Evaluation of Total Exposure to Free Glutamate
Data on the intake or exposure to MSG from condiment/ seasonings of the representative population was analyzed by using the data obtained from the survey and laboratory analysis. Free glutamate intake from condiment/ seasonings was also analyzed based on socio economic status, income, food expenditure, education, and quantity of consumption. Data analyses were done using SPSS (Statistical Package for the Social Sciences) version 13.0 for Windows. It included coding, editing, entry, and analyses. Before analyses proceeded, the data were evaluated for their distribution to determine if the data follow normal distribution. Data distribution was tested using normality data test (Kolmogorov-Smirnov). The test used significance value (Sig.). If t > 0.05 the data considered as normal data, but if t < 0.05 the data considered as not distributed normally. Data distributed normally was tested using t-test to differentiate between 2 variables and analysis of variance (ANOVA) to differentiate between several variables. The abnormally distributed data was tested using non-parametric analyses with two independent sample test (Mann-Whitney U), test for several independent samples (Kruskal Wallis H), and two related samples tests (Wilcoxon). The Mann-Whitney U was used to evaluate the difference in condiment/seasoning usage in household and free glutamate usage from condiment/seasoning at household between areas. KruskalWallis H was used to evaluate the difference in condiment/seasoning usage in household and free glutamate usage from condiment/seasoning at household based on respondent characteristics in Bogor and Jakarta.
3. Results
3.1. The Characteristics of the Household
The socio-economic status of household was compared between poor and non-poor. Based on this category, most of the household samples in Bogor were categorized as poor (64%) and at the opposite only 27% in Jakarta.
The household income was measured by added up income from the entire of household member in one month. There were 69% samples have income more than 2,000,000 rupiah (Rp)[1]/month in Jakarta, while 55% samples have income less than Rp 500,000/month in Bogor.
The food expenditure is a good indicator for community welfare. The higher proportion of income spent for food, the lower the status of welfare. About 75% household in Bogor spent their income for food of less than Rp 500,000/month, meanwhile only ±16% in Jakarta. On the contrary, about 38% household in Jakarta had food expenditure more than Rp 1,000,000/month (data was not shown).
The level of education of respondent for condiment usage survey was generally higher in Jakarta than in Bogor. The head of household was mostly a primary school education (51%) in Bogor and 81% samples were had education more than senior high school in Jakarta. The same figure was also occurred for the housewife, where 51% compared to 13% of them was in primary school level. The higher education level of the head and housewife contribute to the earning income as well as quality of food choices in the household.
3.2. Condiment Usage
Tables 1 and 2 demonstrate the average consumption of condiment/seasoning per capita in Bogor and Jakarta, respectively. Within the types, there were three condiment/seasonings used by more than 80 (±71%) households in both areas, i.e. sweet soybean sauce, MSG, and premix seasoning. While, others such as chili sauce, fermented fish/shrimp paste, tomato sauce, fermented soybean paste, ready to use seasoning, seasoned flour were only commonly used by 65 (58%) or less households in Jakarta and 58 (53%) or less in Bogor.
However in term of the condiment/seasonings consumption per capita, sweet soybean sauce was the highest amount used both in Bogor (2.29 g/cap/day) and in Jakarta (4.99 g/cap/day), followed by MSG in Bogor (1.10 g/cap/day) and chili sauce in Jakarta (1.47 g/cap/day in Jakarta). There was interesting figure on MSG and premix seasoning in Bogor and Jakarta. The amount of MSG used in Bogor (1.10 g/cap/day) was higher than in Jakarta (0.74 g/cap/day). In contrast, the amount of premix seasoning used in Bogor (0.46 g/cap/day) was lower than in Jakarta (0.84 g/cap/day). It is indication that as flavor enhancer, the Jakarta people prefer to use premix seasoning than MSG.
3.3. Free Glutamate Content in Condiment/Seasonings
The laboratory analyses of free glutamate from condiment/seasonings revealed that free glutamate was not only found in MSG but also from other condiment/seasonings. The highest free glutamate content was found in MSG (733.29 mg/g), followed by premix seasoning (70.77 mg/g in Bogor and 63.66 mg/g in Jakarta), ready to use seasoning, oyster and fish sauce, seasoned flour, and fermented shrimp paste with the content of free glutamate of more than 10 mg/g. All other condiment/seasonings also contained free glutamate of less than 10 mg/g. The free glutamate content from condiment/seasonings in Bogor and Jakarta was depicted on Tables 1 and 2.
3.4. Free Glutamate Intake from Condiment/Seasonings
Based on the condiment/seasonings usage and the free glutamate content from condiment/se-asonings, the average of free glutamate intake from condiment/seasoning usage was estimated as depicted in Table 3. The average of free glutamate intake from condiment/seasonings both in Bogor and Jakarta was 730.41 mg/cap/day. The total of free glutamate intake from condiment/seasonings in Bogor was 847.04 mg/cap/day. It was significantly (p = 0.002) higher than that in Jakarta (615.87 mg/cap/day). The highest contribution of free glutamate intake was from MSG i.e. 94.99% (804.63 mg/cap/day) in Bogor and 88.47% (544.88 mg/cap/day) in Jakarta. The premix seasoning provides the second highest contribution to free glutamate intake both in Bogor (32.60 mg/cap/day) and Jakarta (53.38 mg/cap/day). All others condiment/ seasonings contributed only less than 1% to the consumption of free glutamate.
The condiment/seasonings usage in Jakarta area (9.62 g/cap/day) was significantly higher (p = 0.000) than in Bogor (5.39 g/cap/day) as shown in Table 3. However, in contrast, the free glutamate intake from condiment/ seasonings in Bogor was significantly higher than that of in Jakarta. The higher free glutamate intake in Bogor was contributed by higher usage of MSG in Bogor household.
4. Discussion
Previous survey on MSG intake in 6 Districts (2 districts in West Java, 2 districts in West Kalimantan, and 2 districts in South Sulawesi) in Indonesia and sample size 3,063 households done by [3]. The survey was focus on MSG only and revealed that the average MSG intake by children under-five, infant, pregnant woman, and lactating mother were 0.22, 010, 0.39, and 0.40 g/cap/day, respectively. The MSG intake was calculated based on the food consumed and the MSG used for cooking the corresponding food. In this previous study, free glutamate containing seasoning was not included.
Other study on MSG intake was conducted by [9] to identify and estimate intake of potential vehicles for vitamin A in four provinces (West Java, South Sumatra,
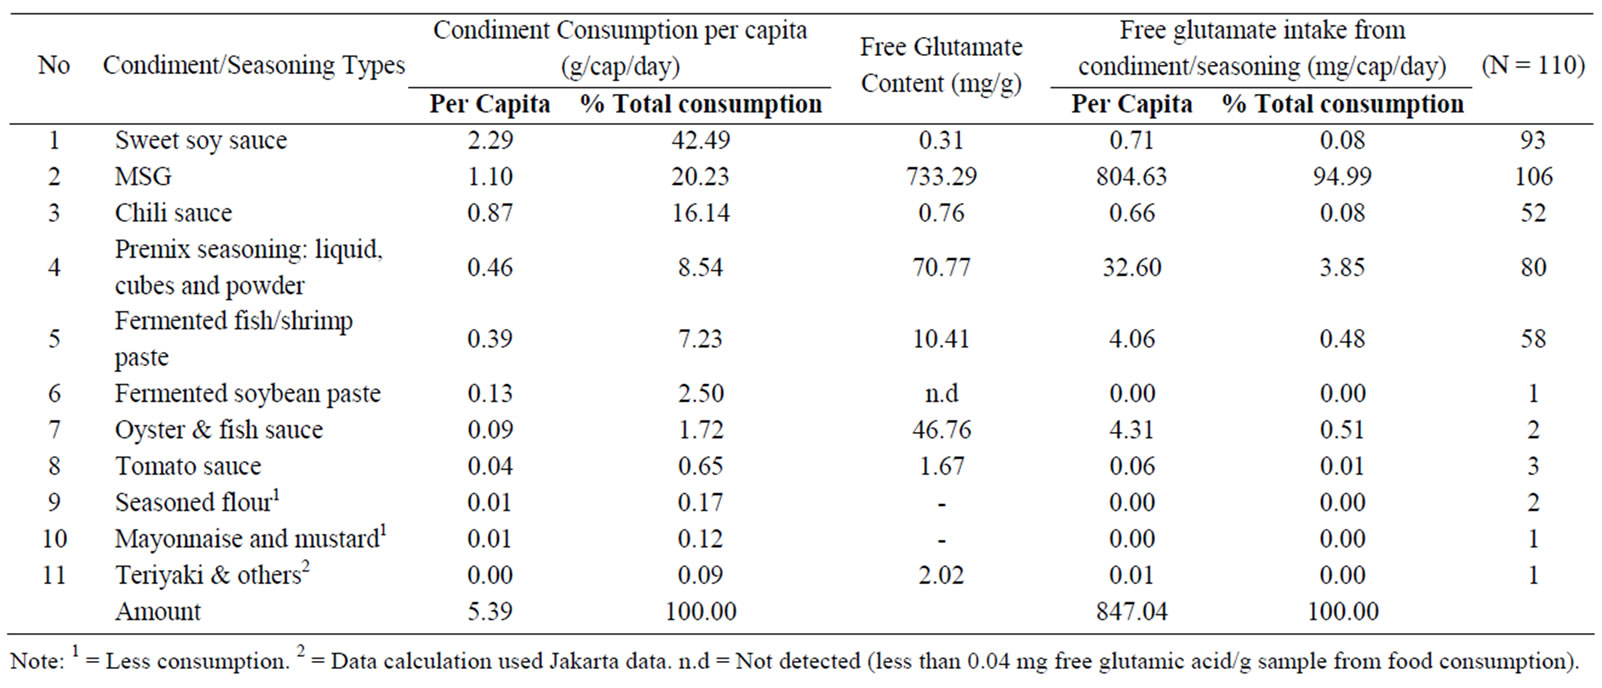
Table 1. Average consumption of condiment/seasonings per capita of the household and its free glutamate intake in Bogor.
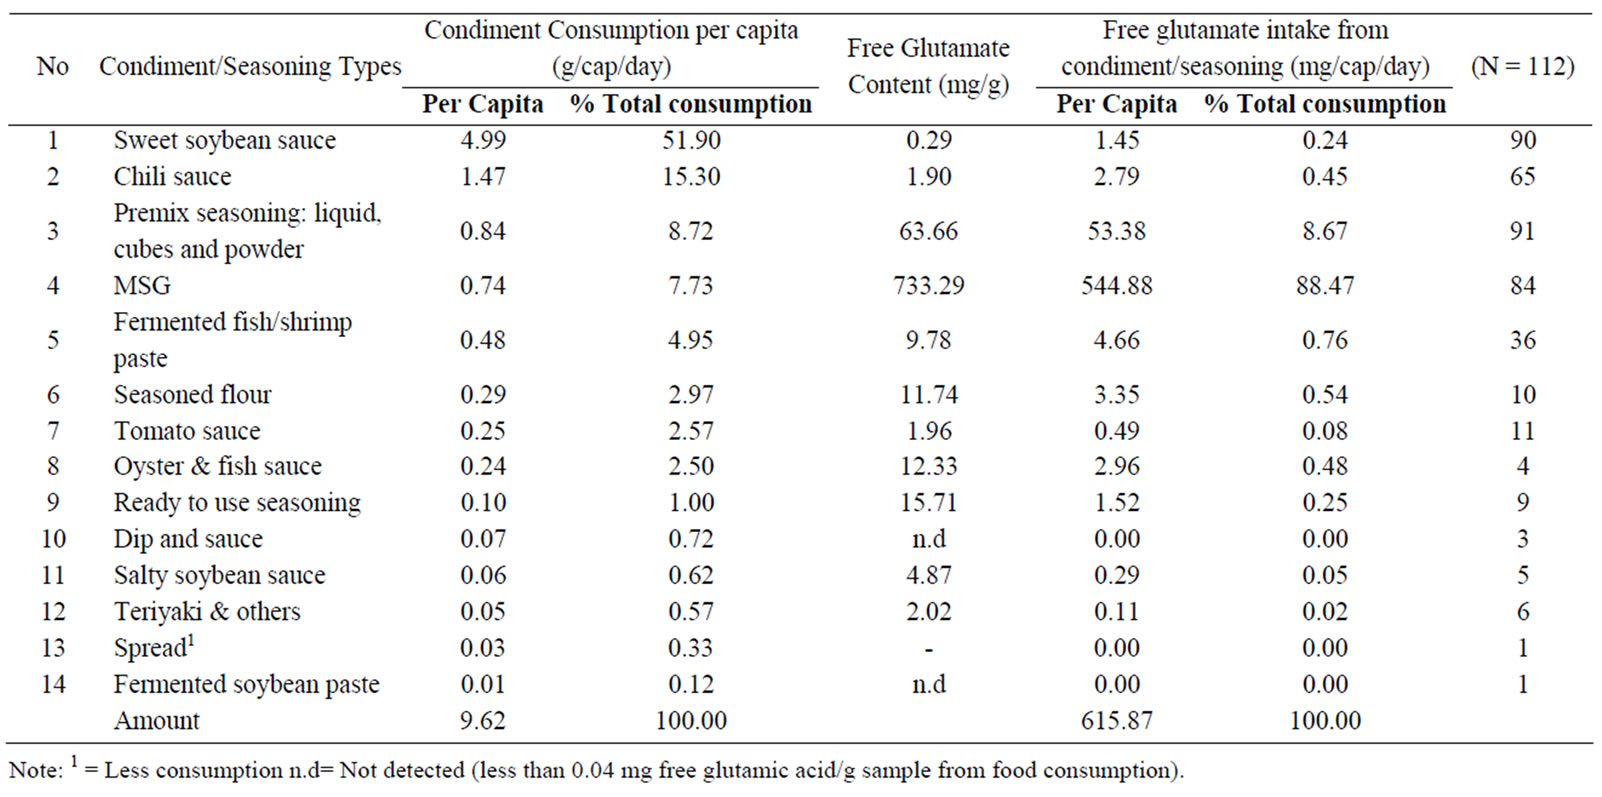
Table 2. Average consumption of condiment/seasonings per capita of the household and its free glutamate intake in Jakarta.
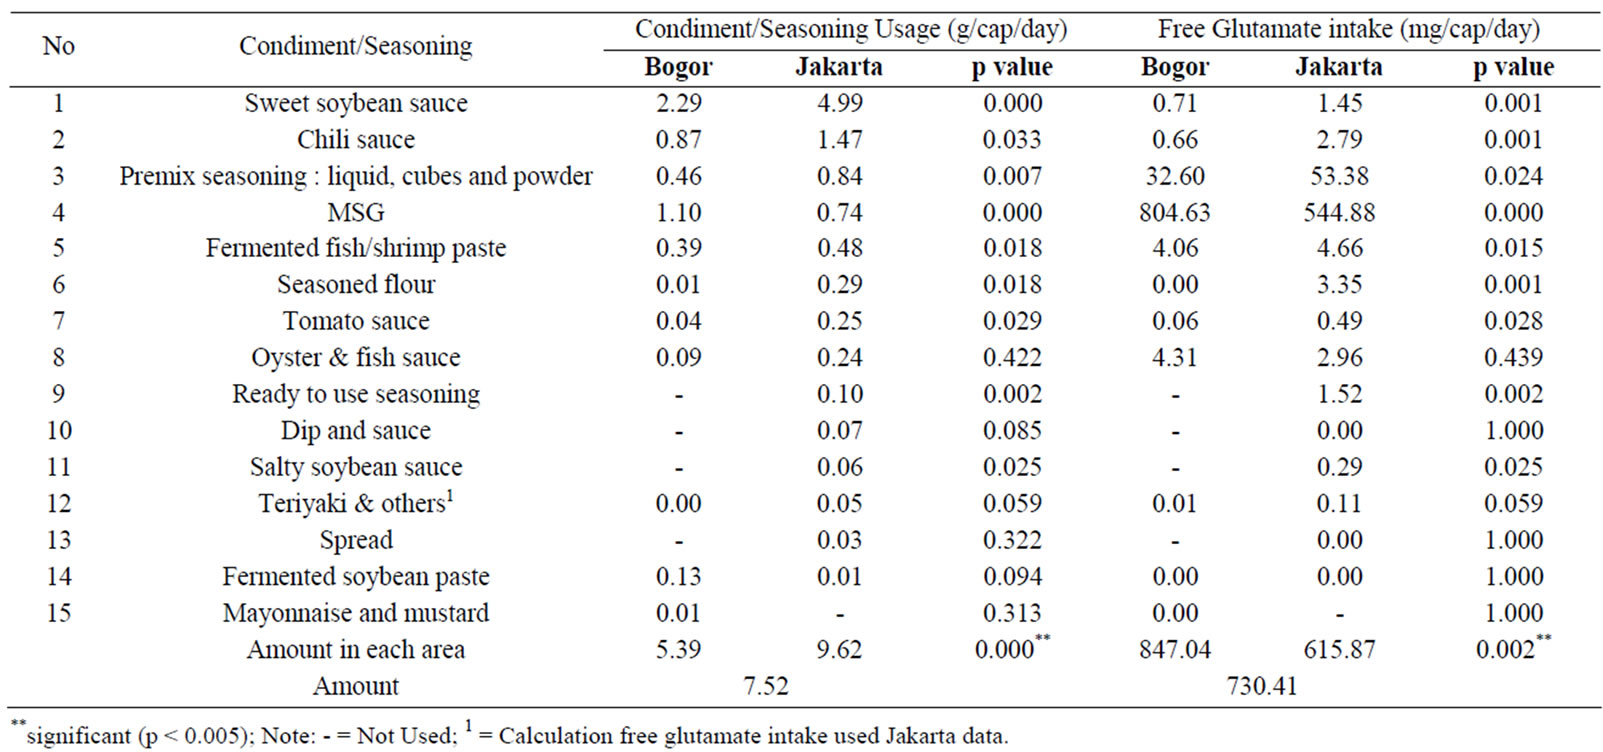
Table 3. Average free glutamate intake from condiment/seasoning usage.
South Sulawesi, and East Nusa Tenggara) involving 5040 respondents. This study was also focus on MSG. Free glutamate containing seasonings was not included in this study. MSG consumption was estimated from the predicted MSG content in the foods containing MSG. The result showed that MSG was consumed commonly by mother and children, both poor and non poor, in three provinces of study area that are West Java, South Sumatra, and South Sulawesi (92% - 99%). The average intake of MSG consumption among mothers was 4.59 g/day, and among children was 4.05 g/day. The average intake of MSG for mother was higher for non poor (4.93 g/day) than that for poor family (4.16 g/day). It was also occurred for children which is the average intake of MSG for non poor family was 4.19 g/day and the poor one was 3.93 g/day. The average intake of MSG was also higher for mothers in rural area than that in urban, which is 4.95 g/day and 4.24 g/day, respectively.
In comparison to both previous studies, the present study had a different result for the free glutamate intake from MSG which the intake was 0.804 g/cap/day in Bogor and 0.544 g/cap/day in Jakarta. The differences between the present study and other previous studies could occur because the different approaches to calculate the free glutamate intake. In this study, the free glutamate intake was calculated based on the real content of free glutamate in condiment/seasonings.
This present study also shows that the condiment/ seasonings usage by respondent in Jakarta was more varied than that in Bogor. The preference type of condiment/seasonings usage by respondent in Jakarta differ from Bogor, where Jakarta respondent prefer premix seasoning to MSG and vice versa in Bogor respondent.
The free glutamate intake from condiment/seasonings was higher in Bogor than in Jakarta although the condiment/seasonings usage in Bogor was lower than in Jakarta. The higher free glutamate intake from condiment/ seasonings related to the amount of MSG usage in Bogor that was higher than in Jakarta. So, it could be concluded that the exposure of consumers to free glutamate from condiment and seasonings in Bogor as a rural area was higher than in Jakarta as an urban area.
The condiment usage and free glutamate intake was also related by the socio-economic status of respondent, i.e. economic background, household income, food expenditure and education level (data were not shown). The result showed that higher socio-economic status of respondents tends to the higher of condiment usage and lower of free glutamate intake. The term the higher of condiment usage means the more varied of condiment and seasonings were used by respondents, not the amount of the condiment/seasonings used.
5. Conclusions
The preference type of condiment/seasonings usage by respondent in Jakarta differ from Bogor, where Jakarta respondent prefer premix seasoning to MSG, and vice versa in Bogor respondent. The exposure of consumers to free glutamate from condiment and seasonings in Bogor as a rural area was higher than in Jakarta as an urban area. The condiment usage and free glutamate intake was related by the socio-economic status of respondent.
6. Acknowledgements
The authors thank the South East Asian Association of Glutamate Sciences (SEAAGS), International Glutamic Technical Committee (IGTC) for financial support, and Desty Gitapratiwi for preparation of the manuscript.
REFERENCES
- U.S. Department of Health and Human Services, “FDA and Monosodium Glutamate. Food and Drug Administration, FDA Backgrounder,” 1995. http://vm.cfsan.fda.gov/~lrd/msg.html
- Federation of American Societies for Experimental Biology (FASEB), “Analysis of Adverse Reaction to Monosodium Glutamate (MSG),” Report, Life Sciences Research Office, Federation of American Societies for Experimental Biology, Washington DC, 1995.
- M. Saidin, A. Sutarto, R. Raoef, H. Soekarno, S. Noer and Muhilal, “Consumption of Seasoning in Food in Rural Area: A Study as Basic Information for Vitamin A Fortification,” Journal of the Indonesia Nutrition Association, Vol. 15, No. 1, 1990, pp. 14-22.
- I. T. Budiarso, “Waspadalah, Monosodium Glutamat/ Vetsin Faktor Potensial Pencetus Hipertensi dan Kanker,” 2001. http://groups.google.com/group/kesehatan/msg/5cf9ca7e2d3137b0
- A. Prawoto, “Delapan Produk Makanan Ringan Mengandung zat Berbahaya,” 2003. http://www.mail-archive.com/forum@alumni-akabogor.net/msg00687.html
- A. Rhys-Williams, S. Winfield and R. Belloli, “Rapid, Specific Method for Diethylstilbestrol Analysis Using an In-Line Photochemical Reactor with High-Performance Liquid Chromatography and Fluorescence Detection,” Journal of Chromatography, Vol. 235, No. 2, 1982, pp. 461-470. doi:10.1016/S0021-9673(00)85910-5
- Association of Official Analytical Chemist (AOAC), “Official Method of Analysis of the Association of Official Analytical Chemist International,” 16th Edition, 5th Revision, AOAC International, Gaithersburg, Maryland, 1999.
- Hardinsyah, S. Madanijah, D. Sukandar, A. Khomsan and Y. Heryanto, “Individual Dietary Intake of Potential Foods for Vitamin A Fortification,” Center for Food and Nutrition Policy Study, Bogor Agricultural University, Ministry of Health, Ministry of Industry and Trade, Unicef Indonesia, 2005.
NOTES
1 USD = Rp 10,000.