International Journal of Medical Physics, Clinical Engineering and Radiation Oncology
Vol.07 No.02(2018), Article ID:84914,12 pages
10.4236/ijmpcero.2018.72022
Investigation of Temperature Dependence of Polymer Gels for Use with Scanning Magnetic Resonance Imaging
Hiraku Kawamura1,2,3*, Kazuya Shinoda4, Hiraku Fuse1, Takaoki Takanashi2, Yoshikazu Shimada1, Yoshiyuki Ishimori1, Masahiko Monma1, Katsumi Miyamoto4, Hitoshi Sato1, Tatsuya Fujisaki1, Takeji Sakae5, Akira Matsumura5
1Department of Radiological Sciences, Ibaraki Prefectural University of Health Sciences, Ibaraki, Japan
23D Gel Dosimeter Research Laboratory, Innovation Center, RIKEN, 2-1, Hirosawa, Wako, Saitama, Japan
3Faculty of Health Sciences, Tsukuba International University, Ibaraki, Japan
4Department of Radiological Technology, Tsukuba Medical Center Hospital, Ibaraki, Japan
5Graduate School of Comprehensive Human Science, University of Tsukuba, Ibaraki, Japan

Copyright © 2018 by authors and Scientific Research Publishing Inc.
This work is licensed under the Creative Commons Attribution International License (CC BY 4.0).
http://creativecommons.org/licenses/by/4.0/


Received: March 22, 2018; Accepted: May 27, 2018; Published: May 30, 2018
ABSTRACT
Polymer gels are three-dimensional dosimetric tools. The purpose of the present study was to investigate the temperature dependence of polymer gels during scanning Magnetic Resonance Imaging. Prepared gels were irradiated with a 6MV X-ray beam at intensities ranging from 0 to 20 Gy in order to investigate their dose-R2 and dose-R1 responses. Irradiated gels were evaluated from 1.5-T magnetic resonance R2 and R1 images for each 5˚C change in temperature from 5˚C to 41˚C, and then the four-field box technique irradiation plan was used to deliver a total dose of 4 Gy using the same beam weight in each direction to the prepared gels. The profile of the dose map generated from the four-field irradiated gel data at 20˚C was then compared with the planned data. The dose-R2 response curve was linear up to 20 Gy at 20˚C, with a slope of 1.17 Gy−1・s−1. The slopes of the fitted curves of the dose-R2 decreased as gel temperature increased. The slopes of the dose-R1 curves were more parallel than the slopes of the dose-R2 curves between 5 and 41˚C. The difference in the full width of half maximum of the gel profile data obtained using the four-field box technique at 20˚C and the planned data were below 5% on average. The dose map from the irradiated gels obtained using the dose-R2 curve was the same as that from the planned data under the same temperature conditions. Measurement of difference between various temperatures is significant with dose accuracy. It is suitable to evaluate the gel dosimeter under the thermal equilibrium condition, MRI room temperature from the point of view of the stability of the irradiated gels.
Keywords:
Polymer Gel Dosimetry, Temperature Dependence, MRI Scanning

1. Introduction
Polymer gels provide new three-dimensional (3D) dosimetric tools that hold promise for the 3D measurement of 3D doses during clinical radiotherapy, thus enhancing quality assurance. Radiotherapy is complex and requires precise monitoring [1] - [6] . Measurements using an ion chambers are precise, but an ion chamber is a point-detector, and thus is not suited to 3D dosimetry.
The clinical use of current polymer gel dosimeters faces several problems, including the temperature stability of polymer gels under irradiation and during dosimetric evaluation using Magnetic Resonance Imaging (MRI). Polymer gel dosimetry evaluated using MRI is conducted in low temperature environments because the gels melt at temperatures over approximately 25˚C, providing poor spatial information and inaccurate dosimetric results. Precise measurements of polymer gels in clinical settings are thus needed in order to determine the temperature dependence of polymer gels.
MRI is commonly used to evaluate the dose received by irradiated polymer gels. The spin-spin relaxation rate (R2 = 1/T2, s−1) and spin-lattice relaxation rate (R1 = 1/T1, s−1) provide the degree of polymerization of the irradiated gels and the radiation dose. This study investigated the dependence of R2 on the dose received by polymer gels exhibiting a higher dose response than R1. The fundamental properties of the temperature dependence of R1 of polymer gels remain unknown. This study was designed to investigate the fundamental temperature effects on R1 and R2 by investigating the differences in temperature properties between the dose and R1, and the dose and the R2 calibration curve.
Several clinical irradiation studies using polymer gels have been conducted to date [6] - [13] , but fundamental investigations of the temperature dependence of these gels are needed prior to the clinical application of gel dosimetry. To determine the feasibility of polymer gel dosimetry in clinical radiotherapy, we attempted to investigate the temperature-dependent properties of the polymer gels under simulated clinical irradiation conditions using a Radiation Treatment Planning System (RTPS).
2. Materials and Methods
2.1. Gel Preparation
BANG-3-type (Bis, Acrylamide, Nitrogen and Gelatin) polymer gels (BANG3PRO; MGS Research, Inc., Guilford, CT), and PAGAT (Polyacrylamide Gel and THPC) gels [14] were prepared. The BANG-3 type polymer gels were prepared using a BANG kit. The unmodified gel melted at 55˚C; thus, several additives were used [15] . PAGAT gels were prepared using 89% w/w water, 3% acrylamide, 3% N,N’-methylenebisacrylamide (Bis), 5% gelatin (300 bloom) and 5 mM tetrakis (hydroxymethyl) phosphonium chloride (THPC). Gelatin was added to water, followed by heating at 50˚C on a hot plate/magnetic stirrer. After the solution became clear, it was cooled to 45˚C and Bis was added. After the Bis dissolved completely, THPC was added.
Prepared gels were poured into polyethylene-terephthalate (PET) vials and containers. Vials were 45 × 30 × 30 mm3 and were used for dose-R2, R1 calibration. Containers were 177 × 74 × 74 mm3 and were used to measure clinical irradiations by 3D dose distribution. Gels in the PET vials and containers were stored wrapped in aluminum foil in a refrigerator at 4˚C until irradiation, as the gels melt at high temperature.
2.2. Design of Gel Phantom for Specific Treatment Plan and Simulated Clinical Irradiation Studies
Figure 1 shows a gel phantom using PAGAT gel for clinical irradiation. The phantom was 200 × 140 × 125 mm3, made of Styrofoam, and housed the gel container. The phantom was filled with water and then scanned in A-helical scan mode using an X-ray CT device (Aquilion LB; Toshiba Medical Systems, Tochigi, Japan) during the treatment plan. CT exposure conditions were as follows: tube voltage, 120 kV; tube current, 400 mA; exposure time, 0.5 s; slice thickness, 3.0 mm; and imaging field of view, 550 × 500 mm2. The number of slices per CT image was 70.
Treatment plans were prepared using the RTPS system (Pinnacle3; Philips
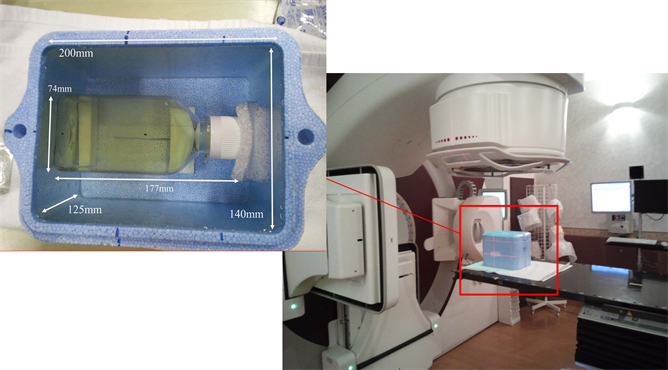
Figure 1. The photograph of gel phantom of the size 200 × 140 × 125 mm3 is shown. The PAGAT gel container was set on the gel phantom in the center position. The size of the PAGAT gel container is 177 × 74 × 74 mm3 (including neck).
Healthcare, Andover, MA) and used a four-field box irradiation technique (Figure 2). The four-field box technique (crossfire) irradiation plan prescribed a total dose of 4 Gy and the same beam weight in each direction. The four beam irradiation calculations assumed the treatment of esophageal cancer and determined the dosimetric results of the polymer gel.
2.3. Irradiation Using Photon Beams for Dose Calibration and Clinical Irradiation
The prepared BANG-3-type gels and PAGAT gels were irradiated with a 6 MV X-ray beam on a linear accelerator (ELEKTA Synergy; ELEKTA, Stockholm, Sweden) at Tsukuba Medical Center Hospital.
Plan dose map (left, blue) was exported from RTPS and dose map from R2 image (right, red) was calculated from in-house program. This figure was shown that crossfire 4 beams irradiation calculations supposed that treatment of a esophageal cancer and dosimetric result of polymer gel using 6 MV photon beam. The profiles between plan dose and dose map from R2 were compared.
First, the polymer gels in PET vials were irradiated with no collimator at the isocenter of a 300 × 300 × 300 mm3 water tank to calibrate the dose versus R2 and R1 from 0 to 20 Gy in the beam axis. After irradiation, gels were stored in a

Figure 2. Treatment plan image was shown that four-field box technique. The sky blue box of the upper image was surrounded a gel phantom and the red box of all images was surrounded a gel container within fabricated polymer gels. Treatment plan was made by acquired X-ray CT images.
refrigerator at 4˚C until MRI scanning.
Second, gel phantoms were irradiated with 6 MV X-ray beams at the isocenter in order to simulate clinical irradiation. The average dose rate was 300 MU/min (Figure 1).
2.4. R1 and R2 Measurements Using MRI
MRI measurements for dose evaluation of the gels were performed on a 1.5-T Siemens AVANTO 1 day after irradiation. Irradiated gels were positioned in a quadrature (QD) coil for scanning.
For R2 measurements, gels were imaged using a multi-echo fast spin echo pulse sequence. Ten echoes of the sequence were used (echo time: TE = 15 to 150 ms; echo time interval, 15 ms). For each scan, a repetition time (TR) of 1000 ms was used, with a 1 mm2 resolution (field of view (FOV) = 192 mm, matrix number = 192 × 192) using 5-mm-thick planes. The obtained data were used to calculate T2 images using the MapIt program (Siemens) [16] .
For R1 measurements, gels were imaged using a 3D volumetric interpolated breath-hold examination (3D-VIBE) sequence (TE = 1.62 ms, TR = 15 ms). For each scan, a resolution of 0.5 mm2 was used (FOV = 192 mm, matrix number = 384 × 384) using 5-mm-thick planes, the same as for R2. R1 and R2 images was created to invert these pixel values using the original program.
The Styrofoam container described earlier was set in the QD coil and filled with water at 5.0˚C. Irradiated gel samples in vials and in containers were individually set in the center of the Styrofoam container and the water temperature in the container was raised from 5.0˚C to 41.0˚C at 5.0˚C /min.
2.5. R2, R1 versus Dose Linearity of the Polymer Gel Calibration Curve
The obtained data were used to calculate R2 images using the MapIt program. Two-dimensional (2D) R1 and R2 images were constructed from the T1 and T2 images using an in-house program. Data points for the dose R2, R1 characteristic curve were obtained by averaging the R2 values from the region of interest (ROI) in the polymer gel.
2.6. Comparison between the RTPS Data and the R2 and R1 Images
The acquired R2 images were converted into dose images using calibration data from the dose-R2 curve. Dose images from the R2 images of the irradiated gels in the center profile were compared with the calculated plan data from the RTPS with four-box irradiation fields from the simulated clinical situation (Figure 2).
3. Results
3.1. Temperature Dependency of R2 versus Dose Linearity of the Polymer Gel Calibration Curve
Figure 3 shows the R2 values of the BANG polymer gels as a function of photon dose between 0 and 20 Gy. Each R2 calibration curve was fit to a straight line for doses below 20 Gy. The fitted straight line for photon dosimetry at 20˚C had a gradient of 1.17 Gy−1∙s−1 and an intercept of 3.87 s−1, and the coefficient of correlation was 0.998.
Figure 4 shows the R2 values of the BANG polymer gels as a function of dose between 5.0˚C and 40˚C. The fitted straight line of the data collected at 0 Gy provided a gradient of −0.19˚C−1∙s−1 and an intercept of 8.10 s−1, and fitting of the data collected at 20 Gy provided a gradient of −0.96˚C−1∙s−1 and an intercept of 47.45 s−1. The coefficient of correlation of the 0 Gy data was 0.894 and that of the 20 Gy data was 0.991.
3.2. Temperature Dependency of R1 versus Dose Linearity of the Polymer Gel Calibration Curve
Figure 5 shows the R1 values of the BANG polymer gels as a function of photon doses between 0 and 20 Gy. Each R1 calibration curve was fit to a straight line for

Figure 3. Dose-R2 responses using different temperature conditions. Error bars are omitted because of overlapping bars and plots.

Figure 4. R2-temperture responses of the BANG-type gel dosimeter using different photon dose conditions. Error bars are omitted because of overlapping bars and plots.
doses below 20 Gy. Data points were obtained by averaging the R1 values in the polymer gel. The fitted straight line for data collected at 20˚C had a gradient of 0.034 Gy−1∙s−1 and an intercept of 0.72 s−1. The coefficient of correlation was 0.962.
Figure 6 shows the R1 values of the BANG polymer gels as a function of dose between 5.0˚C and 40˚C. The fitted straight line of the data collected at 0 Gy had a gradient of −0.020˚C−1∙s−1 and an intercept of 1.12 s−1, whereas the data collected at 20 Gy had a gradient of −0.029˚C−1∙s−1 and an intercept of 1.94 s−1. The coefficient of correlation of the 0 Gy data was 0.925 and that of the 20 Gy data was 0.985.
The dose uncertainties (%) of R1 and R2 between 5˚C and 39˚C are shown in Table 1. An increase in temperature results in large dose uncertainties of R1 and R2. The temperature-related errors in dose are 8.3% for R1 and 7.5% for R2. The dose-related error of the dose response results of the gel is below 8% at temperatures below 20˚C.
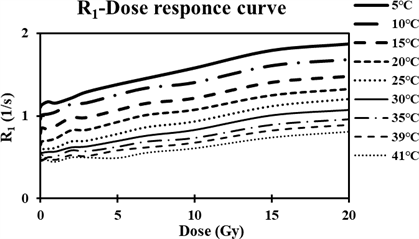
Figure 5. Dose-R1 response curves using different temperature conditions. Error bars are omitted because of overlapping bars and plots.

Figure 6. R1-temperture responses using different photon dose conditions. Error bars are omitted because of overlapping bars and plots.

Table 1. Dose uncertainties (%) of R1 and R2 between 5˚C and 39˚C from the dose response results.
Dose uncertainties (%).

Figure 7. The dose profile (right) of the crossfire 4 beam-irradiated gels and the planned dose data. The profile of the gels is similar to that of the planned data.
3.3. Dose Profile Comparison between Dose Images Obtained Using R2 Images of Polymer Gel and Dose Images Obtained Using RTPS
Figure 7 shows the dose profile for PAGAT polymer gel on a planned RTPS of the oblique center line of the four-field box technique and planned data for comparison. The full width at half maximum (FWHM) of the GEL (20˚C), GEL (5˚C), and Plan (RTPS) curves were 57.48 mm, 55.22 mm and 58.48 mm, respectively. The dose-related error of the results obtained using the gel at irradiation doses over 2 Gy at 20˚C is 4.87% on average and the error at 5˚C is 5.18% on average.
4. Discussion
4.1. Temperature Dependency of R2, R1 versus Dose Linearity of the Polymer Gel Calibration Curve
The results confirmed dose R1 and dose R2 linearity between 0 to 20 Gy. The dose-R2 gradient was steeper at low temperature, as reported previously [10] [11] . Dose-R1 curves with respect to temperature have not previously been reported and were found to parallel the dose-R2 gradient.
Dose gradient with temperature is less pronounced in the dose R1 curves than in the dose R2 curves and therefore the temperature dependence has less effect on dose R1 linearity than on dose R2 linearity. In contrast, the gradient of the R1 dose linearity was 40 times smaller than that of the R2 dose linearity. Furthermore, the overall standard deviation (SD) and coefficient of variation (calculated by dividing the R2 or R1 value by SD) of the R1 images are larger than that of the R2 images. The dose images obtained from the R1 images included more noise when compared with the dose images obtained from the R2 images. Therefore, the dose images obtained from the R1 images were less precise compared with the dose images obtained from the R2 images.
R2 and R1 are dependent on both the correlation time (τc) and the Larmor frequency (ω) from the Bloembergen-Purcell-Pound (BPP) relaxation theory [17] [18] [19] . τc of the gels shows an inverse correlation with their temperature: raising the temperature correspondingly decreases the τc of the gels. T1 and T2 are dependent on an inverse relationship with viscosity [17] . Here, I assumed that an increase in temperature decreased the viscosity of the gels. Therefore, the gel R1 and R2 values decreased as temperature increased, resulting in a larger τc, and the gradients (Figure 4 and Figure 5) changed gradually with temperature. The change in the gradients of the dose R2 curves was assumed to depend on both the viscosity of the gels arising from the degree of polymerization and the temperature.
4.2. Dose Profile Comparison between Dose Images Obtained Using R2 and Dose Images Obtained Using RTPS
The dose profile is presented in Figure 7 and shows differences in the temperature dependence and a comparison of the dose profile obtained by gel dosimetry and the RTPS plan. The dose images obtained from the R2 polymer gel data are precise regarding the process of conversion from the R2 images to the dose image using the same temperature dose R2 curve. Because the prepared gels melt at high temperature, it was difficult to maintain the inside of the gels at a constant temperature as required during scanning MRI. Although BANG gels have a high R2 gradient, with changing temperature, they are less stable than PAGAT gels for the experiment to irradiated gels using RTPS. Methacrylic acid-based gel dosimeters such as BANG gel have the disadvantage of temperature dependency, in contrast to acrylic acid-based gel dosimeters such as PAGAT. BANG gels melt above 25˚C, while PAGAT gels melt at about 30˚C. At high and low temperatures, dose images were less precise and disagreed with the RTPS plan dose data. In this study, the dose-related error at irradiation doses over 2 Gy at 20˚C was less than the error at 5˚C.
The difference in the FWHM of the dose profiles between the gels at 20˚C and the RTPS plan dose data was 0.51 mm, whereas at 5˚C, the difference was 1.8 mm, despite the dose error of the dose response at low temperature being smaller than at high temperature, as shown in Table 1. The inhomogeneity related to the temperature of the irradiated gels in the containers may have caused the high dose error at low temperature. In addition, it is difficult to maintain a constant low temperature inside the gel phantom during MRI scanning and thus the temperature inhomogeneity inside the large phantom rose during exposure to the scanning RF pulse [20] . The temperature inhomogeneity resulting from RF exposure in a high field MRI scanner is large. Accordingly, dose evaluation using high field MRI scanning gives rise to data with large uncertainties. Dosimetric evaluation at MRI room temperature is required due to the stability of the scans during scanning MRI. Thus, it is necessary to maintain a constant at temperature inside the gels for precise measurements.
Future work will be aimed at clinical applications and will assess the temperature-related dose error using γ analysis, dose differences, and distance-to-agreement measurements.
5. Conclusions
This study revealed the temperature dependency of polymer gel dosimeters during scanning MRI. Dose-R1 linearity and dose-R2 linearity were shown between 0 to 20 Gy. These results indicate that temperature dependency has a greater effect on the gradient of the dose-R2 curves than the gradient of the dose-R1 curves.
Although the gradients of dose-R1 curves are more constant than the gradients of dose-R2 curves, the R1 dose images have more noises because of smaller dose gradients.
Comparison of the FWHM in the dose profile of dose images obtained using polymer gels at 20˚C and using the RTPS plan data showed the difference to be below 5%.
Acknowledgements
This work was supported by a Grant-in-Aid for Scientific Research (C) from the Japanese Society for the Promotion of Science and the Ministry of Education, Culture, Sports, Science and Technology of Japan (24601012).
We would like to thank Professor Shin-Ichiro Hayashi of the Department of Clinical Radiology, Faculty of Health Sciences, Hiroshima International University for fabricating the PAGAT gels.
Cite this paper
Kawamura, H., Shinoda, K., Fuse, H., Takanashi, T., Shimada, Y., Ishimori, Y., Monma, M., Miyamoto, K., Sato, H., Fujisaki, T., Sakae, T. and Matsumura, A. (2018) Investigation of Temperature Dependence of Polymer Gels for Use with Scanning Magnetic Resonance Imaging. International Journal of Medical Physics, Clinical Engineering and Radiation Oncology, 7, 261-272. https://doi.org/10.4236/ijmpcero.2018.72022
References
- 1. Baldock, C., De Deene, Y., Doran, S., Ibbott, G., Jirasek, A., Lepage, M., McAuley, KB., Oldham, M. and Schreiner, L.J. (2010) Polymer Gel Dosimetry. Physics in Medicine & Biology, 55, R1-R63. https://doi.org/10.1088/0031-9155/55/5/R01
- 2. Kawamura, H., Sakae, T., Terunuma, T., Ishida, M., Shibata, Y. and Matsumura, A. (2013) Evaluation of Three-Dimensional Polymer Gel Dosimetry Using X-Ray CT and R2 MRI. Applied Radiation and Isotopes, 77, 94-102.https://doi.org/10.1016/j.apradiso.2013.02.011
- 3. Ceberg, S., Gagne, I., Gustafsson, H., Scherman, J.B., Korreman, S.S., Kjaer-Kristoffersen, F., Hilts, M. and Bäck, S.A. (2010) Rapid Arc Treatment Verification in 3D Using Polymer Gel Dosimetry and Monte Carlo Simulation. Physics in Medicine & Biology, 55, 4885-4898. https://doi.org/10.1088/0031-9155/55/17/001
- 4. Novotny, J., Dvorák, P., Spevácek, V., Tintera, J., Novotny, J., Cechák, T. and Liscák, R. (2002) Quality Control of the Stereotactic Radiosurgery Procedure with the Polymer-Gel Dosimetry. Radiotherapy and Oncology, 63, 223-230. https://doi.org/10.1016/S0167-8140(02)00064-6
- 5. Hayashi, N., Malmin, R.L. and Watanabe, Y. (2014) Dosimetric Verification for Intensity-Modulated Arc Therapy Plans by Use of 2D Diode Array, Radiochromic Film and Radiosensitive Polymer Gel. Journal of Radiation Research, 55, 541-552.https://doi.org/10.1093/jrr/rrt139
- 6. De Deene, Y., De Wagter, C., Van Duyse, B., Derycke, S., De Neve, W. and Achten, E. (1998) Three-Dimensional Dosimetry Using Polymer Gel and Magnetic Resonance Imaging Applied to the Verification of Conformal Radiation Therapy in Head-and-Neck Cancer. Radiotherapy and Oncology, 48, 283-291.https://doi.org/10.1016/S0167-8140(98)00087-5
- 7. De Deene, Y., Vergote, K., Claeys, C. and De Wagter, C. (2006) The Fundamental Radiation Properties of Normoxic Polymer Gel Dosimeters: A Comparison between a Methacrylic Acid Based Gel and Acrylamide Based Gels. Physics in Medicine & Biology, 51, 653-673. https://doi.org/10.1088/0031-9155/51/3/012
- 8. Maryanski, M.J., Audet, C. and Gore, J.C. (1997) Effects of Crosslinking and Temperature on the Dose Response of a BANG Polymer Gel Dosimeter. Physics in Medicine & Biology, 42, 303-311. https://doi.org/10.1088/0031-9155/42/2/004
- 9. Scheib, S.G., Schenkel, Y. and Gianolini, S. (2004) Absolute Dose Verifications in Small Photon Fields Using BANGTM Gel. Journal of Physics: Conference Series, 3, 228-231. https://doi.org/10.1088/1742-6596/3/1/034
- 10. Spevacek, V., Novotny, J.Jr., Dvorak, P., Novotny, Jr., Vymazal, J. and Cechak. T. (2001) Temperature Dependence of Polymer-Gel Dosimeter Nuclear Magnetic Resonance Response. Medical Physics, 28, 2370-2378. https://doi.org/10.1118/1.1410124
- 11. Hrbacek, J., Spevacek, V., Novotny, Jr. and Cechak, T. (2004) A Comparative Study of Four Polymer Gel Dosimeters. Journal of Physics: Conference Series, 3, 150-154. https://doi.org/10.1088/1742-6596/3/1/015
- 12. Fuse, H., Shinoda, K., Inohira, M., Kawamura, H., Miyamoto, K., Sakae, T. and Fujisaki T. (2015) Utilization of Polymer Gel as a Bolus Compensator and a Dosimeter in the Near-Surface Buildup Region for Breast-Conserving Therapy. Review of Scientific Instruments, 86, Article ID: 096103. https://doi.org/10.1063/1.4930554
- 13. Kawamura, H., Shinoda, K., Fuse, H., Terunuma, T., Miyamoto, K., Sakae, T. and Matsumura, A. (2013) Comparison between Polymer Gel Dosimetry and Calculated Dose with Small Field in Stereotactic Irradiation. Journal of Physics: Conference Series, 444, Article ID: 012031. https://doi.org/10.1088/1742-6596/444/1/012031
- 14. Vandecasteele, J. and De Deene, Y. (2013) On the Validity of 3D Polymer Gel Dosimetry: III. MRI-Related Error Sources. Physics in Medicine & Biology, 58, 63-85. https://doi.org/10.1088/0031-9155/58/1/63
- 15. Murakami, Y., Nakashima, T., Watanabe, Y., Akimitsu, T., Matsuura, K., Kenjo, M., et al. (2007) Evaluation of the Basic Properties of the BANGkit Gel Dosimeter. Physics in Medicine & Biology, 52, 2301-2311. https://doi.org/10.1088/0031-9155/52/8/017
- 16. Mamisch, T.C., Trattnig, S., Quirbach, S., Marlovits, S., White, L.M. and Welsch, G.H. (2010) Quantitative T2 Mapping of Knee Cartilage: Differentiation of Healthy Control Cartilage and Cartilage Repair Tissue in the Knee with Unloading-Initial Results. Radiology, 254, 818-826. https://doi.org/10.1148/radiol.09090335
- 17. Nelson, T.R. and Tung, S.M. (1987) Temperature Dependence of Proton Relaxation Times in Vitro. Magnetic Resonance Imaging, 5, 189-199. https://doi.org/10.1016/0730-725X(87)90020-8
- 18. Bloembergen, N., Purcell, E.M. and Pound, R.V. (1948) Relaxation Effects in Nuclear Magnetic Resonance Absorption. Physical Review, 73, 679-721. https://doi.org/10.1103/PhysRev.73.679
- 19. Gore, J.C., Kang, Y.S. and Schulz, R.J. (1984) Measurement of Radiation Dose Distributions by Nuclear Magnetic Resonance (NMR) Imaging. Physics in Medicine & Biology, 29, 1189-1197. https://doi.org/10.1088/0031-9155/29/10/002
- 20. De Deene, Y. and De Wagter, C. (2001) Artefacts in Multi-Echo T2 Imaging for High-Precision Gel Dosimetry: III. Effects of Temperature Drift during Scanning. Physics in Medicine & Biology, 46, 2697-2711. https://doi.org/10.1088/0031-9155/46/10/312