American Journal of Plant Sciences
Vol. 4 No. 12 (2013) , Article ID: 40651 , 14 pages DOI:10.4236/ajps.2013.412293
Phenology at the Bear Brook Watershed in Maine, USA: Foliar Chemistry and Morphology
![]()
1School of Forest Resources and Climate Change Institute, University of Maine, Orono, USA; 2School of Forest Resources, University of Maine, Orono, USA.
Email: *ivanjf@maine.edu
Copyright © 2013 Erin Redding et al. This is an open access article distributed under the Creative Commons Attribution License, which permits unrestricted use, distribution, and reproduction in any medium, provided the original work is properly cited.
Received August 30th, 2013; revised October 15th, 2013; accepted November 3rd, 2013
Keywords: Phenology; Tree Nutrients; Nitrogen; Sulfur; Watershed
ABSTRACT
Annual developmental events in biological systems are dependent, in part, on environmental conditions and can be valuable bio-indicators of environmental change. Many studies have been done on the effects of temperature and photoperiod on phenophases, but fewer have explored the consequences of nutrient availability in terrestrial ecosystems on forest phenology. Here we examined phenological phenomena at a long-term experimental forested watershed subjected to decadal-scale ecosystem acidification and nitrogen (N) enrichment. Phenophases of Acer rubrum, Acer saccharum, and Picea rubens in both watersheds were observed throughout the 2010 growing season and included bud burst, flowering (A. rubrum), leaf or needle emergence and unfolding, leaf senescence (Acer spp.), and leaf fall (Acer spp). Clear species-specific phenological patterns were observed, but no treatment effects were evident. Chemical phenology of canopy tree foliage was also examined on a monthly basis from May through October 2010. Nitrogen was the only element that was significantly higher in the WB watershed for all species, although not all months showed significant differences. Other treatment differences in elemental composition of foliage are discussed. Foliar N and P concentrations decreased in all species throughout the growing season, while foliar Ca, K, and Al concentrations increased or were constant. This study found clear species-specific patterns of morphological and chemical phenology with time, but did not show evidence for visible alterations in seasonal development as a result of ecosystem acidification and N enrichment. Treatment effects on chemical phenology, as applied here, showed some responses and warrant further consideration for application to coupled chemical-biological indicators of a changing chemical and physical climate.
1. Introduction to Phenology
Phenology is the study of recurring biological events and their relationships with the environment. Phenological development stages in plants have been defined as morphological events concerning a certain part of a plant during annual growth [1]. Specific phenological development stages can be defined for each species. A phenophase occurs when a phenological development stage reaches a predefined quota (e.g. “one or more breaking leaf buds are visible on the plant”) [1,2]. The timing of phenophases is under the influence of environmental factors such as temperature [3,4], light [5-8], soil, and water supply [9,10], as well as biotic factors and genetics. The science of phenology is an essential component of climate change research because phenophases can be key bio-indicators of shifting climate [11,12].
Historical phenological data are rare, but those that exist can provide valuable insights on drivers of biological change. Long-term records such as those of Japanese cherry blossoming [13], the Marsham family of Norwich, Norfolk, UK [14], Henry David Thoreau [15], and Aldo Leopold [16,17] have been intermittently continued by various observers and still inform studies today. These records allow researchers to look beyond the “invisible present” [18] and see that phenology has not been constant; species’ phenologies change with climate [15,16].
Global average temperature rose 0.35˚C from the 1910s to the 1940s [19]. An increasing rate of warming has taken place over the last 25 years, and from 1970 to the present, global average temperature has risen 0.55˚C. The average temperature in the northeastern United States has increased by 0.25˚C each decade since 1970 [20]. This is important because in regions where the chilling requirements of species are marginally met, climatic warming could increase temperatures so that chilling requirements are no longer met or rest break may be delayed, leading to a shortened growing period. Where chilling requirements are still readily exceeded despite global warming trends, dormancy break could still occur at the same time, and thermal time requirements would remain unchanged. Budburst could occur earlier, however, due to warmer spring temperatures resulting in a faster accumulation of degree days [7,21]. Thirty years of phenological data from the International Phenological Gardens (IPG), a network of gardens planted with identical clone plants located across northern Europe, demonstrated that, on average, spring events, such as leaf unfolding, have advanced by 6 days and fall events have retreated 4.8 days [11]. The authors concluded that this was probably due to a rise in daily temperature.
Chemical Phenology
The concept of “chemical phenology” has not been used in the broader traditional field of phenology, but can be used as a parallel concept to describe temporal patterns of change in plant tissue composition. Chemical phenology can be considered as the study of patterns of chemical change in biota focusing on how these patterns are influenced by biological, biogeochemical, and physical processes (e.g., weather and climate).
The amounts of essential nutrients in plants can vary depending on species, age, and/or site [22,23]. Within individual plants, concentrations differ among organs and tissues. Foliage generally has the highest percentage of minerals as plant dry weight [23,24]. Nutrient limitations may be best expressed in foliar concentrations compared to other plant tissues since photosynthetic and respiratory machinery are located in the foliage. Overall foliar nutrient concentrations can be sensitive to changes in nutrient deposition, reactivity, or availability in the environment, something we can call the chemical climate. Several studies have shown, for example, that N deposition can result in increased N uptake by trees while reducing plant uptake of cations such as Ca2+ and sometimes Mg2+ in plant tissues [22,25-28].
Foliar nutrient and other chemical concentrations often reveal clear temporal trends across the growing season [29-31]. Many foliar nutrients have unique patterns of change over growing seasons that are specific to plant species and elements. The common temporal trend for foliar N concentrations in trees shows that foliar N concentrations tend to be highest during early stages of seasonal growth and decline with tissue maturation [29-32]. This is because photosynthetic machinery accounts for over half of foliar N, and much of the remainder is indirectly related to photosynthetic function [33]. As leaves mature, they develop more structural apparatus that is based on compounds lacking N, and the N concentration of the foliar tissue declines.
Fernandez et al. (1990) [29] and Tew (1970) [31] found that as the growing season progressed, foliar P and foliar K concentrations also decreased. Both P and K may decrease throughout the growing season due to dilution as foliar biomass expands [34]. Foliar Ca, a key element in the construction of primary cell walls and cell membranes [32], has been found to increase in concentration throughout the growing season [31,34]. Tew (1970) [31] found that foliar Mg concentrations of Populus tremuloides also increased as the season progressed.
How these patterns of foliar nutrient and chemical concentrations respond to shortand long-term changes in the chemical and physical environment is not well understood. Since plant nutrient levels are tightly connected to seasonal growth and development, however, it could be expected that changes in element availability would influence morphological and chemical plant phenology. Sigurdsson (2001) [35] found that three years of increased N availability did not influence Populus trichocarpa budburst or shoot extension phenology. Elevated N availability did, however, delay leaf senescence and fall bud set. The timing of growth cessation was linearly related to foliar N concentration. Larigauderie and Kummerow (1991) [9] found that increased availability of N, P, and K modified vegetative budburst dates of evergreen shrubs, but had no significant effect on flowering intensity or duration. Additional N did not alter the timing of bud break when foliar N concentrations were high compared to optimal concentrations for P. abies [36], but did hasten budburst compared in P. abies when foliar N concentrations were below optimal [37].
The objectives of this research were to provide an initial assessment of potential changes in phenology in response to decadal-scale, whole-watershed N-enrichment and acidification at the Bear Brook Watershed in Maine. Our approach was to utilize traditional phenological development stages, and to explore the use of chemical phenology, in evaluating potential changes in tree function.
2. Methods
2.1. Study Site
The Bear Brook Watershed in Maine (BBWM) is a longterm paired-watershed study site located on the southeast slope of Lead Mountain, Maine, USA (44˚52′ N, 68˚06′ W). Two contiguous watersheds, West Bear (WB) (10.2 ha) and East Bear (EB) (11.0 ha) make up the study’s paired catchment design. A three year calibration period established that the two watersheds were hydrogeochemcially similar prior to the onset of whole-watershed chemical manipulations of WB [38]. Beginning in 1989, the WB watershed has been experimentally manipulated through bimonthly aerial applications of granular ammonium sulfate [(NH4)2SO4] at 25.2 kg·N·ha−1 yr−1 and 28.8 kg·S·ha−1·yr−1. The EB watershed serves as a reference.
There are three cover types in both watersheds of the BBWM: softwood, hardwood, and mixed wood [39]. The current vegetation is the result of natural regeneration following timber harvesting. No harvesting has occurred in over 60 years [40]. The dominant tree species at BBWM are Acer pensylvanicum L., A. rubrum L., A. saccharum Marsh., Betula alleghaniensis Britton, and Fagus grandifolia Ehrh., which dominate the hardwood and mixed wood forests of the lower watershed elevations. Picea rubens Sarg. dominate the softwood stands at the upper elevations. These four species accounted for 99% of the living trees on both watersheds [41].
2.2. Morphological Phenology
In the first component of this study, phenological development stages were followed throughout the 2010 growing season. The study involved sixty co-dominant trees: ten red maple (Acer rubrum), ten sugar maple (Acer saccharum), and ten red spruce (Picea rubens) per watershed as a subset of 100 established tree plots distributed equally across WB and EB watersheds [42]. These species are 3 of the 5 most dominant species at BBWM. American beech (Fagus grandifolia), the most dominant hardwood tree species, was not included due to extensive Nectria infection [41]. For each tree species, five trees were sampled, one per plot, in each of four compartments defined as EB hardwoods, EB softwoods, WB hardwoods, and WB softwoods. Mixed wood stands were not included in the study design for practical reasons. DBH data from the Elvir et al. (2010) [43] study were used to select the largest trees within given plots by species. Only one tree per species was studied per plot. Trees with extensive physical damage were disqualified and the next largest tree was chosen in those instances.
Observation of morphological development began in the last week of March 2010 and continued through October 2010. The frequency of observation was determined by the rate of change in phenology taking place in the field and practical limitations for access to the remote field site. Phenological development phases included bud burst, flowering (A. rubrum), leaf or needle emergence and unfolding (all species), leaf senescence (A. rubrum and A. saccharum), and leaf fall (A. rubrum and A. saccharum). These phenophases were defined based on the observation protocol recommended by the National Phenology Network in 2010 [2].
Observations were consistently made from the southern aspect at ground level using 10 × 42 powered binoculars. If the view was completely blocked by understory foliage, observations were made from the most southern point possible and the exception was noted. Photos of the crown were taken with a 10 mega-pixel point and shoot camera for archiving and to assist in interpretation.
2.3. Chemical Phenology
Chemical phenology was examined for 30 co-dominant trees, five of each species in each compartment. Foliar samples were collected on a monthly basis. Acer saccharum and A. rubrum leaves were collected five times between May and October 2010. Red spruce needles were collected five times between June and November 2010. Foliage was clipped from the mid-crown on the southern aspect of the crown using a pole pruner. This minimized potential differences in physiology between sun and shade leaves. Leaves with apparent insect or disease damage were not included.
All foliar samples were returned to the laboratory immediately upon sampling and gently rinsed by submersion in a deionized water bath. Rinsing was done in order to eliminate potential seasonal differences in dry atmospheric deposition contributions to foliar chemical analyses, recognizing potential tradeoffs to foliar leaching. To minimize this concern, the water bath dip was brief (e.g., < 1 minute). Red and sugar maple samples included petioles. The P. rubens foliage was separated from the branchlet into three age classes: 2010 (current year) foliage, 2009 foliage, and 2008 and older foliage. Bud scale scars and changes in needle length and color along individual shoots were used to identify annual growth increments and needle age [44]. Samples were stored in paper bags and placed in a drying room set at 60˚C for at least two weeks to dry. Needles were separated from twigs after drying. Dried foliage was ground in a Wiley mill through a 40 mesh screen. The Wiley mill was cleaned thoroughly between samples using a brush and vacuum to avoid cross-contamination.
Chemical analyses of all foliar samples were carried out by the Analytical Laboratory of the Maine Agricultural and Forest Experiment Station at the University of Maine. Tissues were dry-ashed at 550˚C in a muffle furnace and taken up in 50% HCl on a hotplate. Elemental analysis was conducted by inductively coupled plasma emission spectroscopy, with the exception of N. Nitrogen was measured by combustion on a LECO CN-2000 analyzer.
2.4. Temperature and Precipitation
Monthly temperature and precipitation data for 2010 and 1971-2000 were taken for the Bangor, Maine station from the Northeast Regional Climate Center NOW DataNOAA Online Weather Data [45].
2.5. Statistical Analyses
Statistical analyses were conducted using R [46]. Foliar element concentrations from both treatments were evaluated using one-way analysis of variance (ANOVA). ANOVA assumptions were tested using visual assessment of linear models as well as the Shapiro-Wilk tests for normality of variance. When differences between treatments, among months, or treatment by month from analyses of variance were significant, means separations between treatments or among months were performed using “TukeyHSD”. A probability of 0.05 was used to confer significance.
3. Results
3.1. Morphological Phenology
Based on visual observations of tree crown morphological characteristics, the progression of phenological development stages in the 2010 growing season revealed notable differences among species. Acer saccharum and A. rubrum both began vegetative budburst and leaf out in early May. Acer rubrum reached full foliar expansion earlier than A. saccharum. Picea rubens did not begin budburst and needle expansion until the last week in May and first week of June. Needle expansion in P. rubens continued through early July. Acer rubrum flowering began the third week of April and lasted until the end of the month. Flowering was not observed in A. saccharum.
Leaf color change was first observed in the first week of September in A. saccharum, and in the second week of September in A. rubrum. All leaves of both species had changed color by the last week of October. Leaf fall began in the last week of September and continued through the last week of October. There were no differences in the morphological phenology observed for A. saccharum, A. rubrum, or P. rubens between EB and WB watersheds (Figure 1). Figures 1 and 2 show the temporal development of leaf color change and leaf fall phenophases, respectively, in Acer spp.
3.2. Chemical Phenology
Foliar Element Differences between Treatments
Monthly measurements of foliar element concentrations were compared by species and watershed in order to assess overall treatment effects on foliar chemistry (Table 1). Foliar N concentrations of the three species in the WB (treated) watershed were significantly greater than tree foliage N concentrations in the EB watershed. There were no significant differences in foliar P concentrations of A. saccharum or current year P. rubens between treatments, but foliar P concentrations of A. rubrum and one year old (i.e. 2009) P. rubens in the WB watershed were significantly higher than in the EB watershed.
There were no significant differences between WB and EB foliar Ca or Mg concentrations of A. saccharum or P.
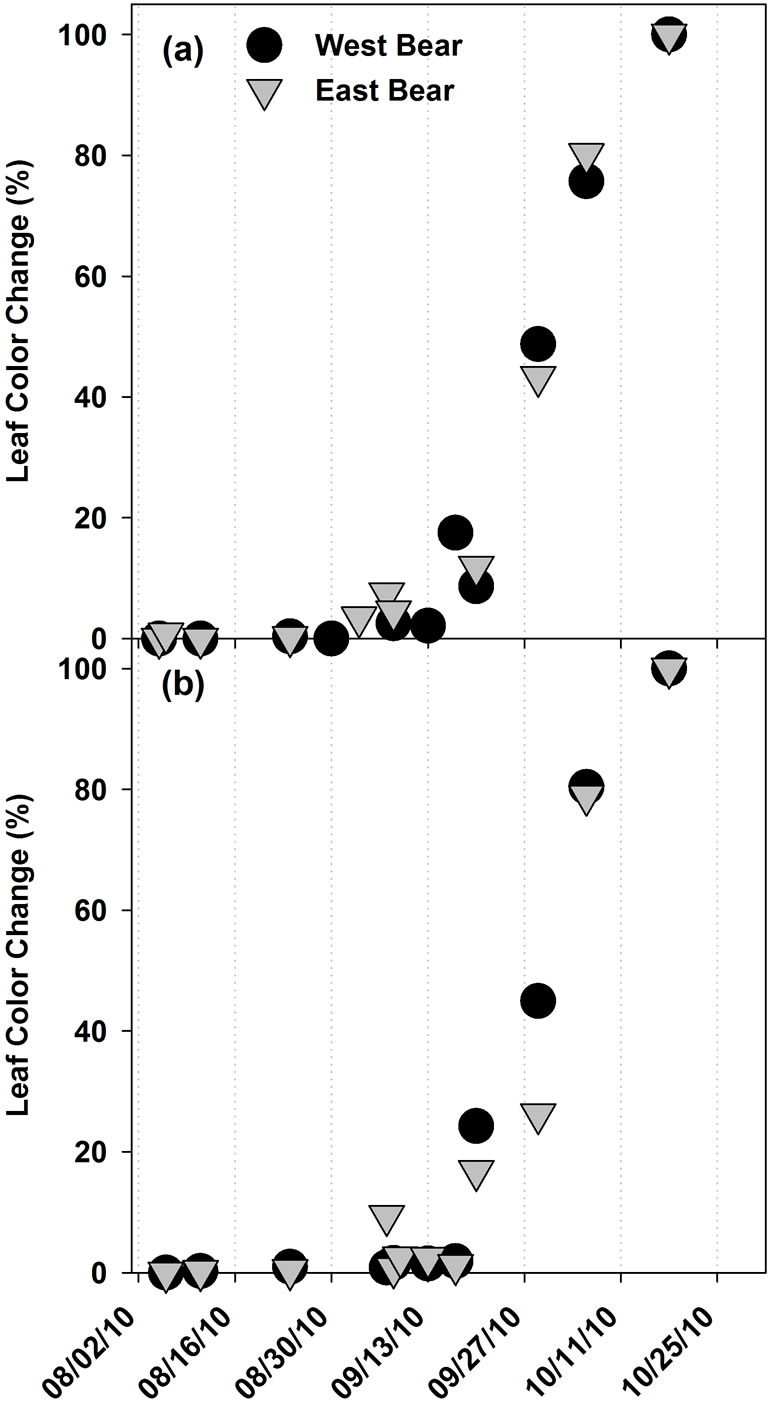
Figure 1. The development of the leaf color change phenophase in (a) A. saccharum, and (b) A. rubrum, at the Bear Brook Watershed in Maine in 2010 (n = 10).
rubens. In contrast, WB A. rubrum did have lower foliar Ca and Mg concentration compared to reference A. rubrum. Foliar K, Al, and B concentrations did not differ between treatments for any species. Foliar Cu concentrations in A. saccharum in the WB watershed were significantly lower than in the EB watershed, but A. rubrum and P. rubens foliage greater than one year old did not significantly differ between treatments.
Foliar Fe concentrations in A. saccharum and A. rubrum were significantly higher in the WB watershed than the EB watershed. Picea rubens foliar Fe concentrations did not differ between treatments for any age class. There were no significant differences between foliar Mn concentrations of A. saccharum or P. rubens between watersheds. Acer rubrum foliage of the WB watershed had significantly lower foliar Mn concentrations than in the EB watershed. Foliar Zn concentrations were significantly higher in A. saccharum in the WB watershed, but there were no treatment differences
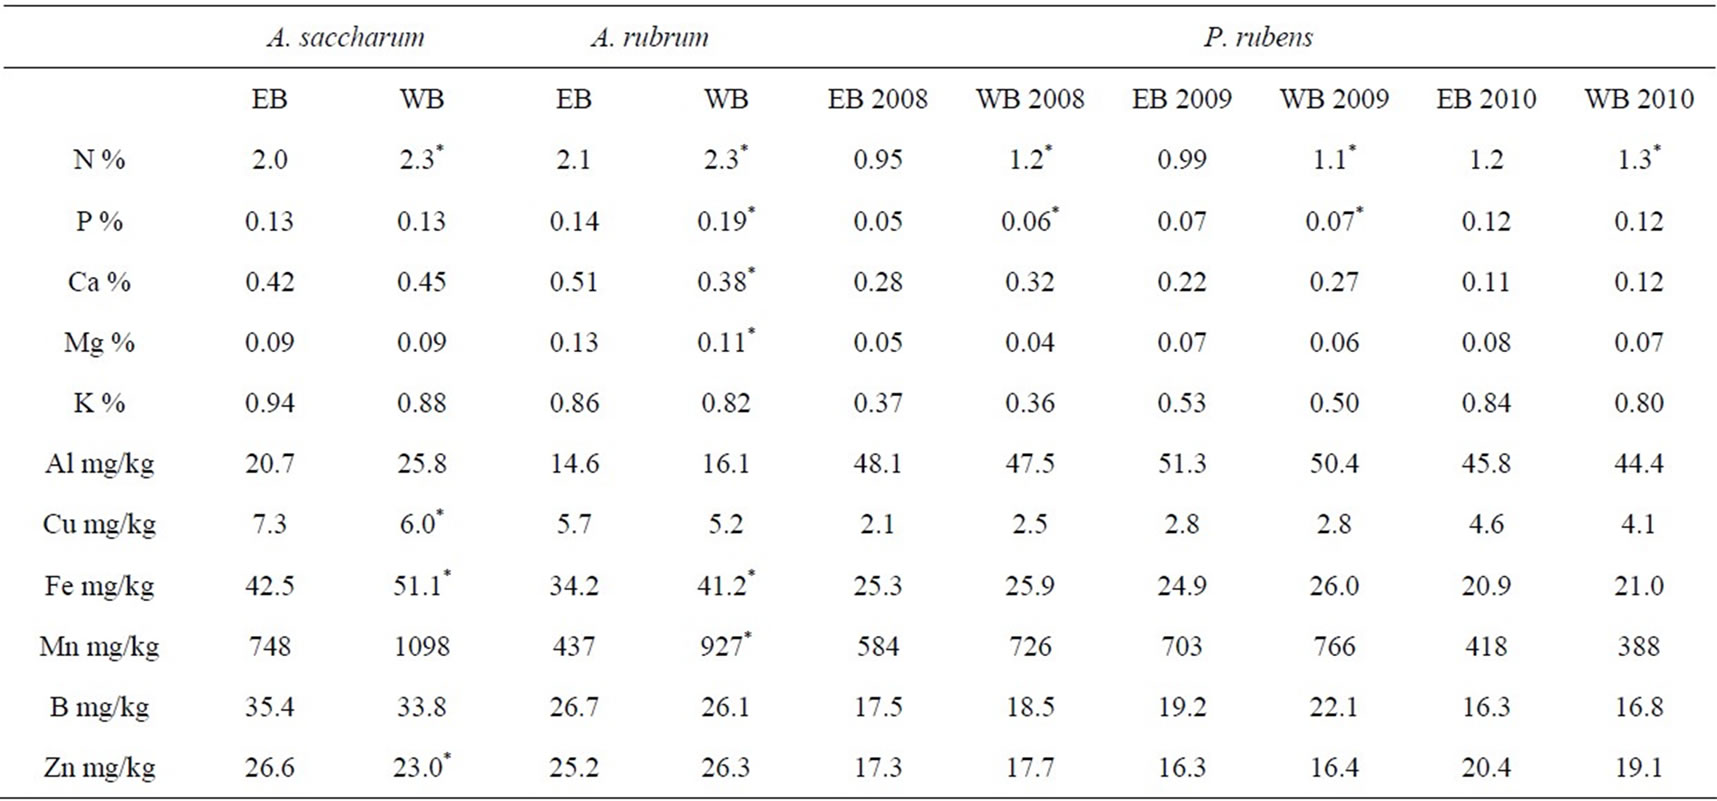
Table 1. Overall seasonal averages (n = 5) of foliar element concentrations for A. saccharum, A. rubrum, and P. rubens in 2010 at the Bear Brook Watershed in Maine.
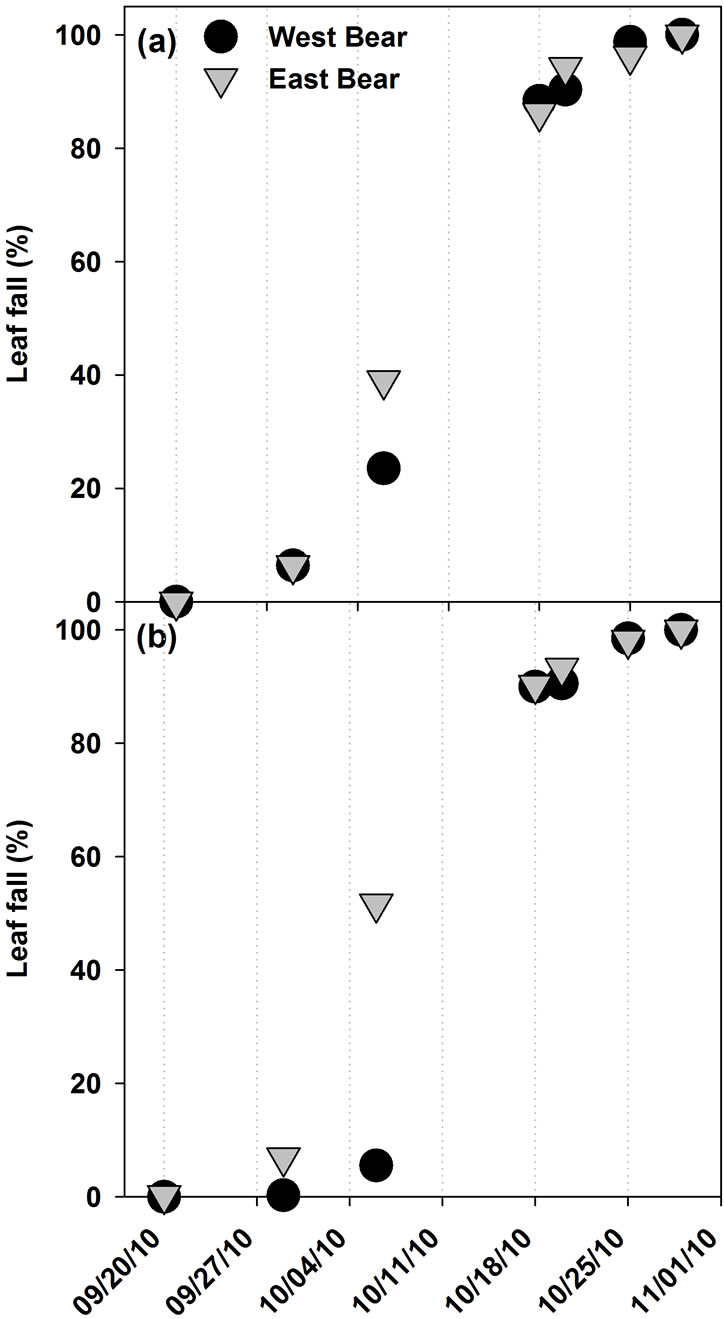
Figure 2. The development of the leaf fall phenophase in (a) A. saccharum, and (b) A. rubrum, at the Bear Brook Watershed in Maine in 2010 (n = 10).
in A. rubrum or P. rubens.
3.3. Seasonal Trends
Seasonal trends in foliar chemistry represent the changes in composition due to physiological as well as environmental factors. These patterns of change, where they exist, can offer insight on drivers of change in the environment and could provide a useful chemical analog to the insights gained from morphological phenology. Increasing foliar element concentration trends indicate that a specific element accumulates within foliar tissue throughout the growing season or that it becomes increasingly available in the environment. A decreasing trend could indicate that an element is taken up at relatively high levels at the beginning of the growing season for use in physiological processes, but its concentration is then diluted due to biomass (i.e., carbon) accumulation without a concomitant increased nutrient uptake. It is also possible that, as the growing season progresses, some elements become less available for uptake due to competitive uptake with other biota and reduced chemical availability in the environment. The absence of a seasonal trend implies that foliar element uptake is proportional to growth.
At BBWM, there was an opportunity to examine chemical phenology in the experimentally manipulated WB watershed subjected to decadal-scale acidification and N enrichment and compare the results to the adjacent reference EB watershed. A significant interaction between treatment and time indicates that the difference between treatments changes during the growing season and represents a treatment effect on chemical phenology. The lack of a significant interaction indicates that the temporal trends of both WB and EB foliar chemistry were relatively parallel, even if they are quantitatively different. For example, foliar N concentration of the WB A. rubrum was only significantly higher than EB in May (Figure 3), though A. rubrum in both watersheds displayed decreasing foliar N concentrations throughout the growing season. Foliar N concentrations also decreased in A. saccharum and current year P. rubens foliage for both treatments throughout the growing season, but there were no significant interactions between treatment and time in these tree species. Nitrogen concentration declined rapidly in the early part of the growing season and then leveled off coincident with full leaf development in
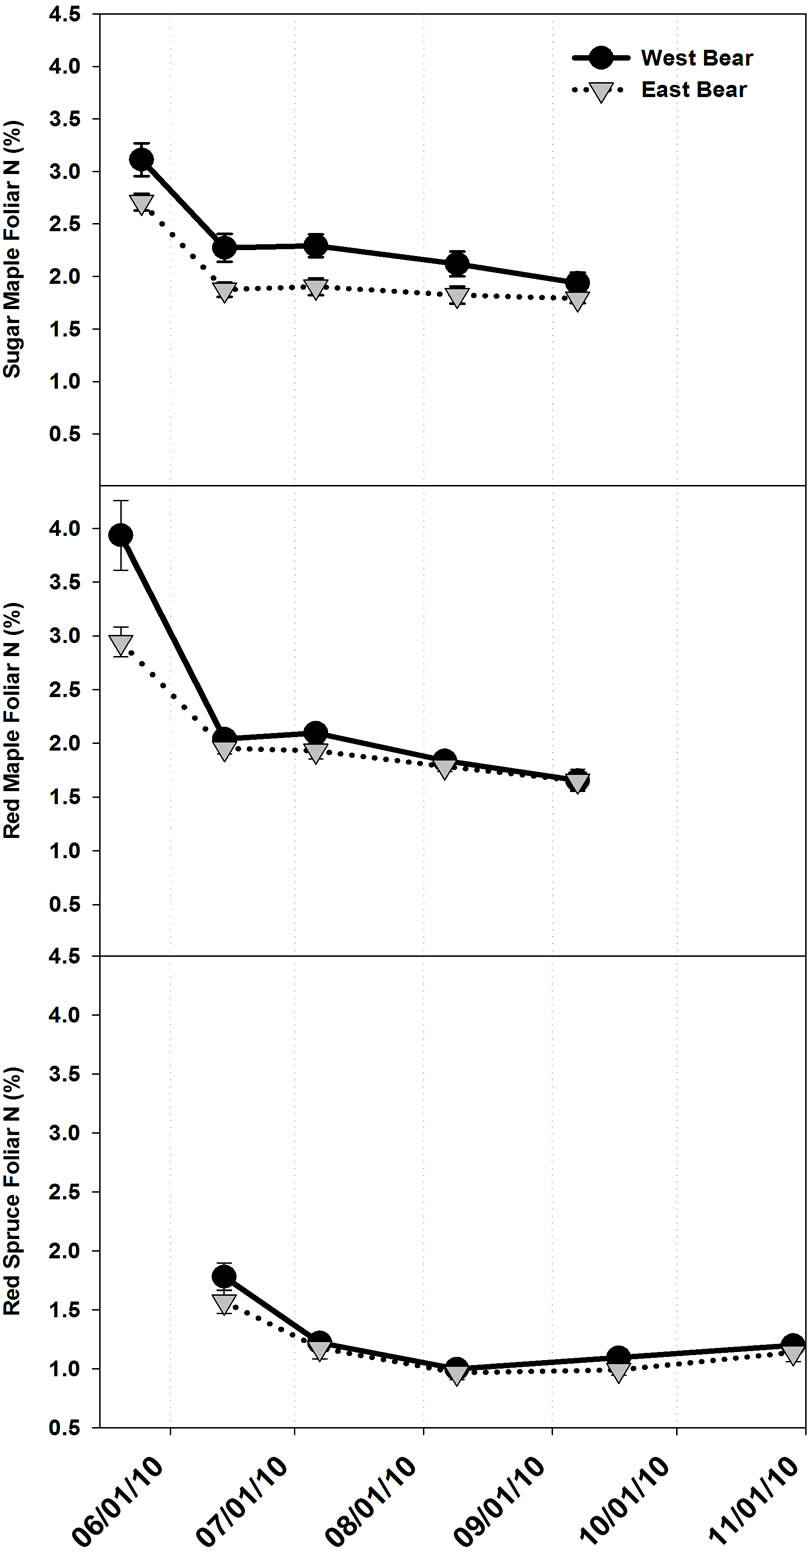
Figure 3. Mean (n = 5) foliar N concentrations throughout the growing season in (a) Acer saccharum, (b) Acer rubrum, and (c) Picea rubens at the Bear Brook Watershed in Maine. Asterisks signify significant difference between treatments. Standard error bars are shown.
all species. A minor exception to that generalization is a slight numerical increase in P. rubens foliar N concentration at the end of the growing season, although the increases were not significant. There were no increasing or decreasing trends in foliar N concentration in older age class P. rubens needles (i.e., 2009 and 2008+) across the growing season, and therefore these time series plots are not shown.
Foliar P concentrations for A. rubrum also displayed a significant interaction between treatment and seasonal trend. Foliar P concentrations of the WB A. rubrum were only significantly higher than EB in May (Figure 4). Foliar P concentrations significantly decreased in Acer spp. and current year P. rubens foliage of both treatments throughout the growing season, with a slight numerical upturn in concentrations of P in P. rubens as seen with foliar N concentrations, although this increase was also
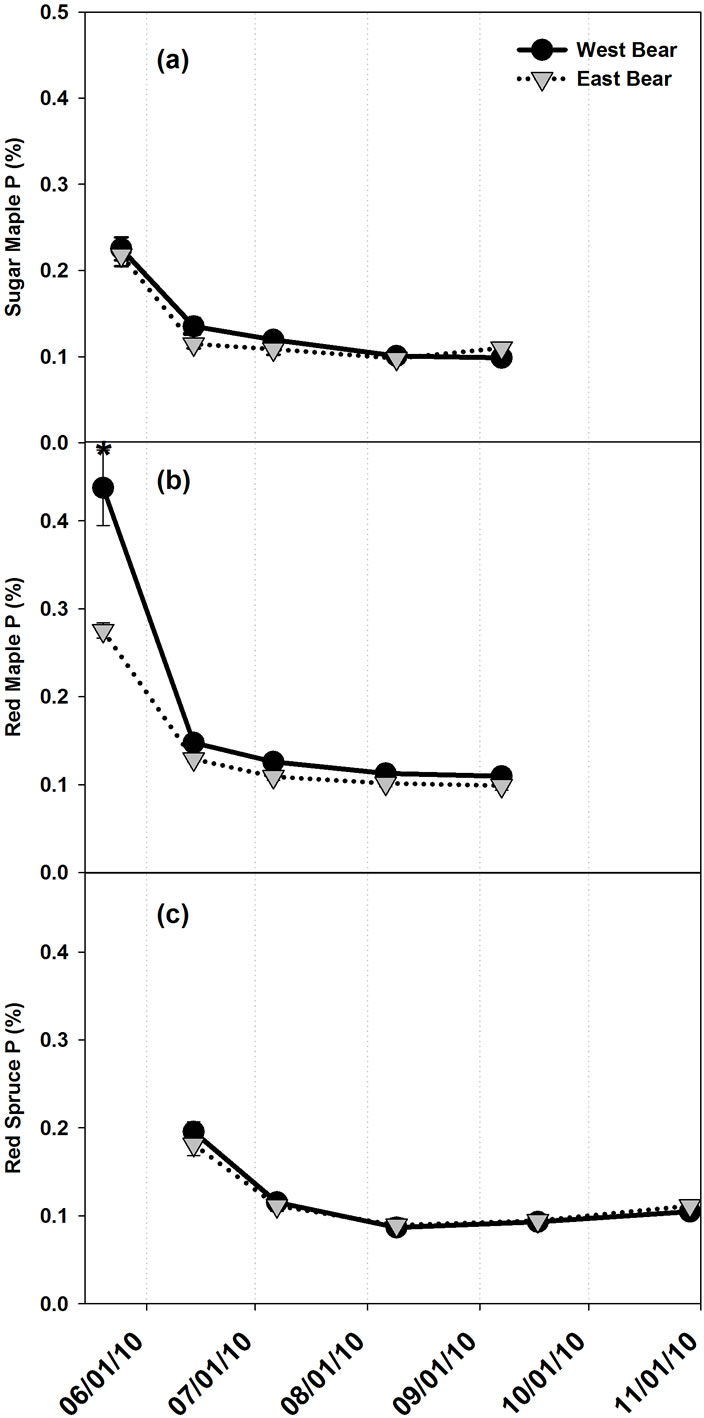
Figure 4. Mean (n = 5) foliar P concentrations throughout the growing season in (a) Acer saccharum, (b) Acer rubrum, and (c) Picea rubens at the Bear Brook Watershed in Maine. Asterisks signify significant difference between treatments. Standard error bars are shown.
not significant. Phosphorus concentration of one year old P. rubens (i.e. 2009) needles of both treatments signifycantly increased throughout the growing season from 0.064% ± 0.004% to 0.081% ± 0.005% in EB and 0.068% ± 0.003% to 0.082% ± 0.002% in WB (not shown). Phosphorus concentration of greater than two year old P. rubens (i.e. 2008+) needles of both treatments significantly increased throughout the growing season from 0.051% ± 0.002% to 0.066% ± 0.002% in EB and 0.061% ± 0.005% to 0.066% ± 0.005% in WB (not shown).
No other foliar element concentrations displayed significant interactions between treatment and seasonal trend. Foliar Ca concentrations increased significantly across the growing season in A. rubrum and current year P. rubens foliage (Figure 5), but there were no signifi-
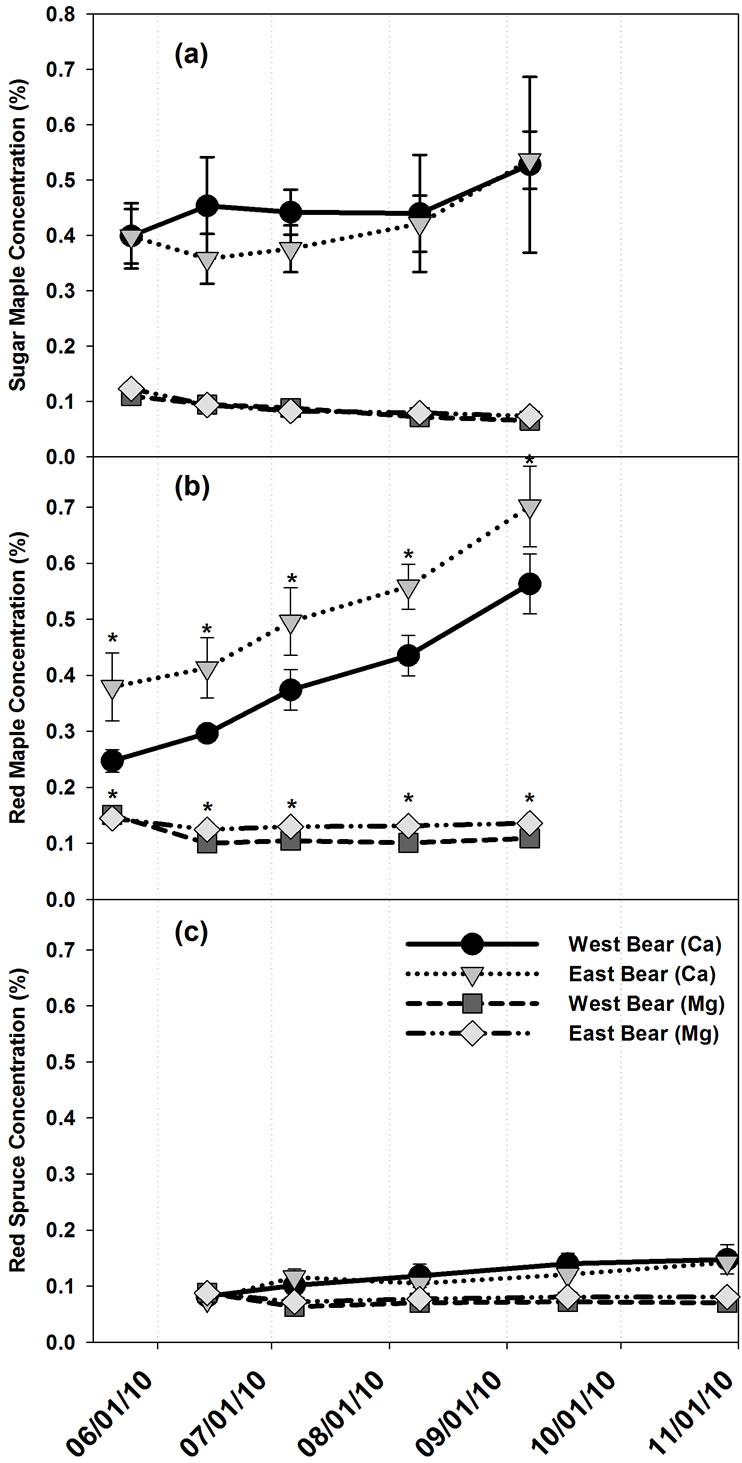
Figure 5. Mean foliar Ca and Mg concentrations throughout the growing season (a) Acer saccharum, (b) Acer rubrum, and (c) Picea rubens at the Bear Brook Watershed in Maine. Asterisks signify significant difference between treatments. Standard error bars are shown.
cant trends over time in foliar Ca concentrations for A. Saccharum or greater than one year old P. rubens foliage. Foliar Mg concentrations significantly decreased in A. saccharum and current year P. rubens foliage throughout the growing season (Figure 5). Acer rubrum foliar Mg concentrations in May were significantly higher than in June, July, or August, but did not significantly differ from September. Older needles than current year P. rubens showed no temporal trends for foliar Mg concentrations.
Table 2 shows a summary of seasonal trends based on results of the ANOVA and Tukey’s HSD test on monthly mean foliar element concentrations. These results summarize the data discussed above for N, P, Ca, and Mg, as well as providing insight on foliar concentrations of elements K, Al, Fe, Mn, B, Zn, and Cu. Foliar K concentrations significantly decreased throughout the growing season for Acer spp. and current year P. rubens foliage, but were constant in P. rubens foliage age classes greater than one year old (i.e. 2009 and 2008+). Foliar Al significantly increased throughout the growing season in all species. Foliar Fe concentrations also significantly increased in P. rubens foliage two years or older, however, they did not follow an increasing or decreasing trend in Acer spp. Or P. rubens foliage less than two years old (i.e., 2009 and 2010). Foliar Mn and B concentrations significantly increased across the growing season in A. saccharum, but did not follow a clear increasing or decreasing trend in A. rubrum or P. rubens foliage. Foliar Zn concentrations significantly decreased throughout the growing season in Acer spp. and 2010 P. rubens foliage. Foliar Cu concentrations did not follow a clear trend in A. saccharum or P. rubens foliage greater than two years old (i.e. 1998), but did decrease throughout the growing season in A. rubrum. Foliar Cu concentrations for one year old P. rubens foliage (i.e. 2009) in October were significantly higher than in July, but there were no other significant differences among months. Foliar Cu concentrations were significantly higher in June than in July or August, but did not significantly differ from September or October.
3.4. Temperature and Precipitation
Average monthly temperatures in Bangor, Maine were higher in 2010 in all months compared to average monthly temperatures from 1971-2000 (Figure 6). The overall mean temperature for 2010 was 8.9˚C compared to 6.8˚C from 1971-2000.
Average monthly precipitation leading up to and during the 2010 growing season was not consistently higher or lower than monthly averages from 1971-2000. The overall precipitation for 2010 was 113.1 cm compared to 101.3 cm from 1971-2000. If only January through September is taken into account, the total pre-
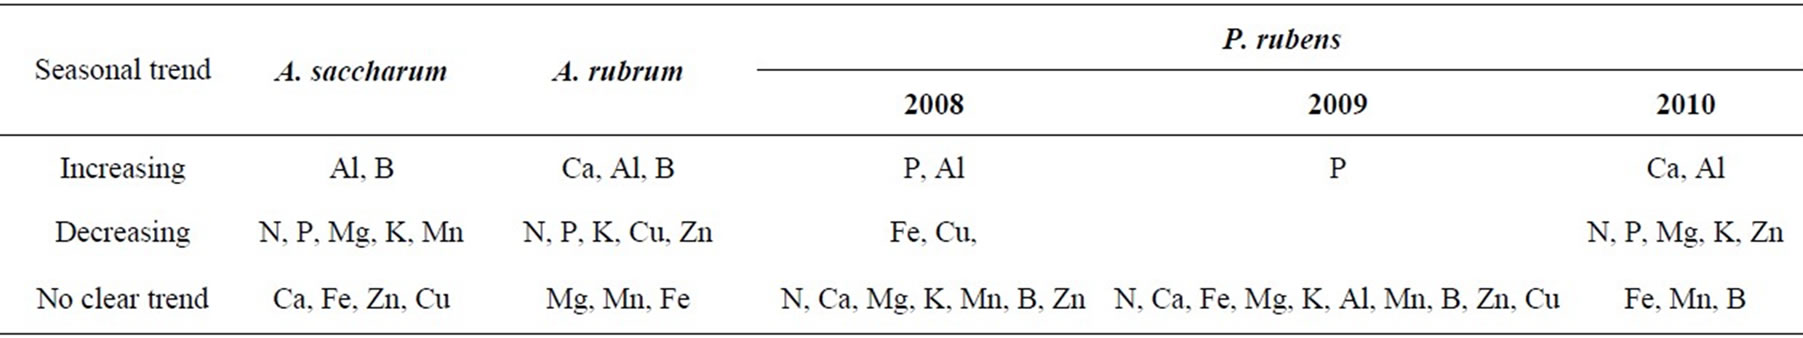
Table 2. Seasonal trends in foliar element concentrations of A. saccharum, A. rubrum, and P. rubens at Bear Brook Watershed in Maine.
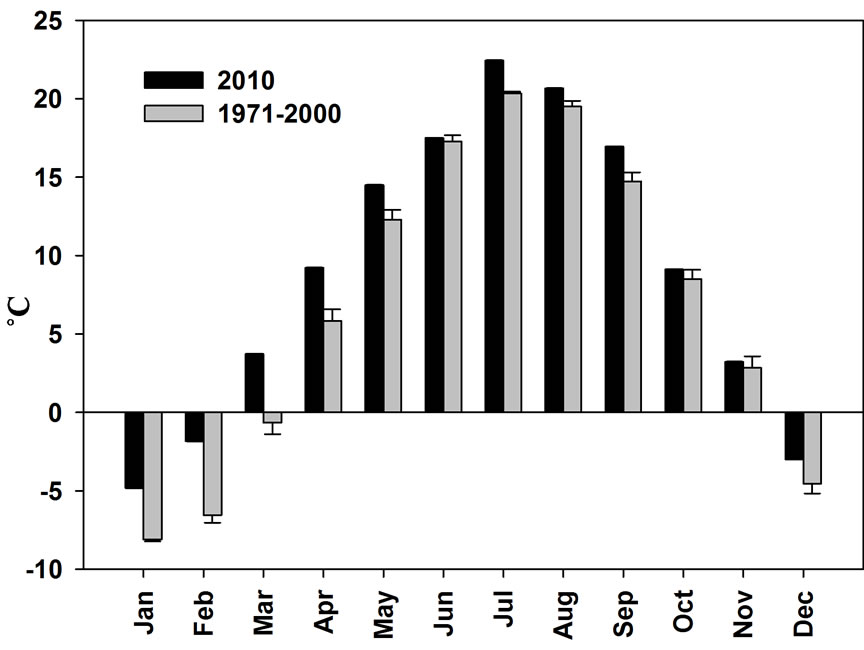
Figure 6. Average monthly temperatures for Bangor, Maine in 1971-2000 and 2010 [45]. Bars represent 1 standard deviation.
cipitation for 2010 was 72.3 cm compared to 74.7 from 1971-2000.
4. Discussion
4.1. Morphological Phenology
Observations of morphological phenology did not show evidence of alterations in seasonal development as a result of ecosystem acidification and N enrichment. It is possible that, if such alterations are occurring, the current experimental design was unable to distinguish these differences. The lack of distinguishable treatment effect supports the viewpoint that spring and fall phenology of temperate trees are strongly dependent upon temperature [3,4,7,11,21,47] and photoperiod [5,8,48], thereby rendering biogeochemical alterations of secondary importance. Clear species-specific patterns of morphological phenology were observed among A. saccharum, A. rubrum, and P. rubens trees at BBWM. The data presented here are valuable in establishing observations of these phenophases for the BBWM site, and contribute to the larger initiative through the USA National Phenology Network’s Nature’s Notebook database [2]. Timing of phenophases for A. saccharum at BBWM were typical for this tree species across much of its native range [49-52]. Dates of bud break and full leaf elongation in A. saccharum at BBWM were within a few Julian calendar days of A. saccharum budburst at Trelease Woods, Illinois, USA reported by Augspurger and Bartlett (2003) [49]. Autumn color change for A. saccharum at BBWM began over two weeks earlier than at Trelease Woods [49], and complete leaf fall occurred approximately one week earlier at BBWM than in Trelease Woods. These locations differ by 4˚ latitude which results in a negligible difference in daily photoperiod, therefore there must be a different environmental factor influencing senescence. One possibility is weather. There was a thunderstorm and heavy rains on October 15, 2010 at BBWM. After this storm, only 5% of leaves remained on A. saccharum trees, and this 5% took over a week to drop. It is possible that leaves that may have stayed on trees several more days in calm weather were mechanically separated by the force of the rain and wind, highlighting the importance of meteorological events in characterizing phenology and the value of long-term records of phenological behavior. Acer rubrum phenology at BBWM was also consistent with reported observations in the literature for this species, with flowering occurring before vegetative bud break [53], and reaching full crown in the last week of May [52]. The fact that A. rubrum leaves reached their full size earlier than A. saccharum may simply be because A. saccharum leaves are often larger than A. rubrum and, therefore, take longer to expand to full size. Leaf fall in A. rubrum experienced the same storm as A. saccharum foliage, which likely accelerated the process of leaf fall. Picea rubens is one of the last trees in its range in the Northeast to begin seasonal growth [54], usually beginning in the first week of June as was recorded at BBWM. This phenological trait can have profound implications for the interaction among forest species, as well as broader ecosystem dynamics. For example, P. rubens is believed to be made less susceptible to attack by spruce budworm (Choristoneura fumiferana), which prefers young foliage, by flushing after A. balsamea [55].
4.2. Chemical Phenology
Typical phenological studies of northern temperate trees focus on development events occurring in the spring or fall [5,8,11,49]. Morphological changes occurring in the middle of the growing season are minimal and occur gradually, making traditional observational data collection problematic. Approaching phenology throughout a growing season by also examining temporal patterns of tissue chemical composition offers a more comprehensive understanding of seasonal changes in tree form and function. The majority of foliar elements in this study displayed discernable temporal trends, which paralleled seasonal morphological development. The study of chemical phenology can also identify changes in tree phenology that are occurring on physiological levels that are not visible in a changing morphology. For example, this study found no differences in visible morphological phenophases within species between treatments at BBWM, but did identify significant interactions between treatment and temporal trends of foliar chemistry. Findings of greater foliar N concentrations for all species in the WB watershed are consistent with the N saturation hypothesis, which predicts that as N availability increases in forests, foliar N concentrations for trees will increase [56]. Several previous studies have also confirmed that chronic N additions result in increased foliar N concentrations in forest species [22,28,30,57,58]. Over half of foliar N concentration is accounted for by the tree’s photosynthetic machinery, and much of the remainder is indirectly related to photosynthetic functions [33]. Photosynthetic machinery is created largely at the beginning of the growing season in new deciduous leaves, and repaired in the beginning of the growing season in perennial conifer needles [59]. The high demand for N in the construction of photosynthetic machinery which is a priority early in the life of a leaf explains why foliar N concentrations were highest during the earliest sampling periods of the growing season. Foliar N concentrations for Acer spp. declined rapidly after the May sampling and leveled off by mid-June, in accordance with complete leaf expansion. This same trend was observed one month later in current year P. rubens foliage, also coinciding with the completion of needle growth. Declining foliar N concentration trends for Acer spp. and current year P. rubens reflect leaf maturation and the increased leaf and needle mass attributable to structural compounds lacking N as they mature. Several other studies on tree species have also found decreasing trends in foliar N concentrations throughout the growing season [29-31]. Fernandez et al. (1990) [29] attributed this trend to dilution as a result of expanding foliar biomass as well. This is supported by a significant increase in foliar C to N (C:N) ratios for Acer spp. and current year P. rubens. Picea rubens foliage greater than one year old (i.e. 2009 and 2008+) did not show foliar N concentration decreases, or increases in foliar C:N ratios, as this foliage was not involved with significant biomass accumulation. It is likely that even higher foliar N concentrations for Acer spp. and current year P. rubens were evident in the first two weeks of May and first week of June, respectively, prior to our first sampling in this study, when leaves were less than 25% expanded.
Findings of greater foliar P concentrations in the WB watershed are likely a result of altered soil P dynamics due to long-term acidification [60]. Foliar P is present in phospholipids, nucleic acids, enzymes, and proteins as well as being an essential component of energy storage and the transfer molecules adenosine diphosphate (ADP) and adenosine triphosphate (ATP) and phosphorolated sugars produced by the photosynthetic carbon reduction (PCR) cycle [61]. It follows that foliar P concentrations decreased throughout the growing season in Acer spp. and current year P. rubens in the same fashion as N. Foliar P concentrations were highest at the beginning of the growing season when leaves were small, and new cells and cellular machinery were being constructed. Foliar P concentrations decreased as leaves developed more cell wall material. This decreasing trend has also been reported in other studies of tree foliar chemistry [29-31]. Significantly increasing foliar P concentrations for P. rubens foliage greater than one year old (i.e. 2009 and 2008+) showed that foliar P in older foliage was not diluted by addition of biomass throughout the growing season and may indicate increasing inorganic P concentrations resulting from lower rates of photosynthesis in older needles.
Foliar N and P concentrations for A. rubrum were the only elements and species to show significant interactions between treatment and time, indicating that the effect of whole watershed manipulation on these foliar nutrient concentrations and the response to treatment changed over time within the growing season. West Bear A. rubrum was able to take advantage of increased N and P availability in the WB watershed by taking up 33% more N and 66% more P than trees in the EB in the month of May. By mid-June, however, foliar N and P concentrations were essentially equal in WB and EB. This trend suggests that A. rubrum at BBWM is limited by N and P and is, therefore, able to utilize the increased N and P available in WB in metabolic processes as well as in enhanced biomass accumulation. Acer saccharum foliar N and P concentrations were significantly greater in WB than in EB throughout the entire growing season. This response could reflect rates of N and P uptake that exceeded rates of biomass accumulation, resulting in higher foliar concentrations for A. saccharum. Acer saccharum foliar Ca and Mg concentrations in both watersheds were in concentration ranges associated with tree decline [62,63], which raises the possibility that A. saccharum at BBWM were more limited by Ca and Mg availability than N or P availability. It is likely that an interaction between treatment effect and temporal trend was not evident in P. rubens because sampling did not begin until mid-June after peak foliar concentrations in juvenile tissue would have occurred in May. Fernandez et al. (1990) [29] found that foliar N concentrations for P. rubens were approximately 75% greater at the end of May than at the end of June, and foliar P concentrations were almost 100% greater at the end of May than at the end of June.
The fact that foliar Ca or Mg concentrations were significantly lower for A. rubrum in the WB compared to the EB watershed could be due to lower soil Ca and Mg availability in the WB compared to EB soils [34,64]. Root morphology differs between Acer rubrum, which has relatively shallow roots, and A.saccharum, which tend to have deeper root systems with a tap root [51,53]. These differences in root morphology could allow tap roots of A. saccharum trees to access available Ca and Mg pools in deeper soil horizons that were not available to A. rubrum. Acer saccharum is more sensitive to soil acidity and base cation amendments than A. rubrum [65]. Therefore, it is possible that the acidity of soils in both watersheds at BBWM was high enough for reactive Al concentrations to interfere with Ca uptake in A. saccharum [66], but did not affect A. rubrum to the same degree. This difference between species may be due to tree species-specific physiology or mycorrhizal colonization [65]. Acer saccharum is the only species at BBWM that is colonized by endomycorrhizal fungi instead of ectomycorrhizal fungi [67,68]. St. Clair and Lynch (1995) [65] found no relationship between percent colonization by endomycorrhizal fungi in fine roots of A. saccharum and tree health status, however, root colonization rate was correlated to foliar N, P, Ca, and Mn concentrations. Comparisons of soil chemistry assessments at BBWM showed that available Ca and Mg did not significantly differ between treatments within softwood forest types in 2006 [64], which could explain why there were no significant differences in foliar Ca or Mg concentrations for P. rubens. Foliar Ca, a key element in the construction of primary cell walls and cell membranes [32], has been found to increase in concentration throughout the growing season in A. balsamea [29], P. rubens [29,69], Populus spp. [33], and A. saccharum [70]. DeHayes et al. (1997) [69] suggested that the increase of foliar Ca concentration is due, in part, to its lack of mobility in the phloem. Foliar Ca concentrations increased in A. rubrum and current year P. rubens foliage due to cell wall de velopment in addition to a lack of resorption before leaf fall. It is somewhat surprising and without explanation that this study found that this increasing trend was not seen for A. saccharum. Magnesium is a component of the chlorophyll molecule, as well as an essential component of cytoplasmic enzymes involved in protein synthesis, cell replication, and respiration [32]. The decreasing trends found in foliar Mg concentration for A. saccharum could be due to dilution as a result of expanding foliage, or a decline in environmental availability. The consistent trends seen for A. rubrum and P. rubens, however, suggest that uptake of Mg could stay constant or even increase due to its participation in many physiological processes that continue throughout the growing season. In contrast, Tew (1970) [31] and St. Clair et al. (2005) [70] found that foliar Mg concentrations increased or were constant as the growing season progressed. Changing conditions of nutrient availability and biological competition for resources with other roots and the microbial community can also result in the treatment response patterns observed.
Foliar K concentrations did not differ by treatment among any species, possibly due to the plant’s ability to transport K among storage organs and foliage. Additionally, K can be absorbed at all locations of the root surface, compared to Ca whose uptake is restricted to the apical region [61]. This allows trees a greater opportunity to take up available K from soil and utilize it among plant tissues, compared to less available, labile nutrients like Ca. Potassium ions have several physiological roles within plant cells [61]. They activate dozens of enzymes, are essential for reaching optimum pH levels within cytoplasm, and are used in the regulation of osmotic potential in plant cells. Foliar K concentrations probably decreased throughout the growing season in current year foliage for all tree species due to dilution as foliar biomass expanded, as seen in N and P [33]. Picea rubens foliage greater than one year old (i.e. 2009 and 2008+) did not show foliar K decreases over time, reflecting a lack of significant growth in these tissues.
Aluminum is not considered an essential nutrient within plants but is important to consider since Al can reduce uptake of Ca through competition for binding sites in the cortical apoplast of fine roots [66]. There were no significant differences in exchangeable Al between WB and EB watershed soils [60], therefore it is not surprising that foliar Al concentrations did not significantly differ between the watersheds. Aluminum can accumulate within plant tissue throughout the growing season [61] as was seen for all species at BBWM. A range of micronutrients were included in tissue analyses for this study given the paucity of intra-annual trend data in tree foliage for many of these elements. Increasing and decreasing trends could reflect dilution due to increased foliar biomass, changing biogeochemical availability in the environment, changing physiological uptake and retention in foliar biomass, or contributions from surface contamination due to atmospheric deposition not fully removed in sample preparation. Foliar Mn is considered a particularly important nutrient associated with decline of Acer saccharum across its native range [62,63]. Interactions with organic C in soil O horizons can complicate our understanding of Mn availability; however, it is possible that foliar Mn concentrations were significantly higher for A. rubrum in the WB watershed due to increased availability of Mn with experimental acidification. It is unclear why A. saccharum does not follow the same pattern as A. rubrum, but it is possible that it is equally stressed in both WB and EB. Foliar Mn concentrations for A. saccharum of both WB and EB were below foliar Mn concentrations associated with tree decline [62,63]. Manganese may not have shown similar trends in softwoods because these trees are rooted in more shallow soils with higher organic matter content allowing organic matter complexation of Mn to limit its bioavailability to P. rubens in both WB and EB.
4.3. Temperature and Precipitation
Temperatures during winter chilling and spring flushing periods, as well as throughout the growing period, can affect timing of bud burst, leaf elongation, and autumn senescence in trees [7,8,47,71,72]. It is important to note that monthly temperatures for 2010 were consistently higher than average monthly temperatures for 1971-2000. Therefore, the morphological phenology data for 2010 could have been influenced by these warmer temperatures such as lengthening the time for trees to reach full chilling requirements, shortening the time to reach temperature sums required for budburst, or delaying autumn leaf senescence. Monthly precipitation in 2010 was not notably different from the 1971-2000 period, making this factor unremarkable for 2010.
5. Conclusion
The phenology of ecological systems has become an increasingly critical area of study for scientists attempting to understand the rate and consequences of environmental change on both the local and global scales. This research examined the consequences of decadal-scale whole-ecosystem experimental acidification and N enrichment on temporal patterns of tree development and foliar chemistry. We found no evidence that biogeochemical changes in the ecosystem due to experimental manipulation have shifted the timing or altered the length of the growing season for A. rubrum, A. saccharum, or P. rubens. It is possible that, if phenological alterations are occurring, the spatial and temporal scale of the experimental design used in this initial investigation was unable to detect these changes. We also explored the temporal patterns of foliar chemistry in trees, referred to here as chemical phenology, as a potential additional component to studying forest phenology. Our findings suggest that A. saccharum, A. rubrum, and P. rubens showed clear temporal patterns of foliar chemistry throughout the growing season, but there was limited evidence that treatments had altered the patterns between watersheds even when absolute concentrations were significantly different. The one exception was for N. We conclude that assessment of temporal trends in foliar chemistry, particularly for the nutrient elements N and P, can reveal effects of ecosystem change that might not be evident using more traditional approaches of a single sample collected late in the growing season. Further consideration of coupled morphological and chemical approaches to phenological assessments is warranted.
6. Acknowledgements
This research has been made possible by the support of the School of Forest Resources, the Center for Research on Sustainable Forests, the Climate Change Institute, & the Department of Plant, Soil, & Environmental Sciences. Funding was also provided by the National Science Foundation Long Term Research in Environmental Biology program (DEB-0639902).
REFERENCES
- R. Brügger, M. Dobbertin and N. Kräuchi, “Phenological Variation of Forest Trees,” In: M. D. Schwartz, Ed., Phenology: An Integrative Environmental Science, Kluwer Academic Publishers, Boston, 2003, pp. 255-267. http://dx.doi.org/10.1007/978-94-007-0632-3_16
- USA National Phenology Network, 2010. https://www.usanpn.org/
- H. Hänninen, “Modeling Dormancy Release in Trees from Cool and Temperate Regions,” In: R. K. Dixon, R. S. Meldahl, G. A. Ruark and W. G. Warren, Eds., Process Modeling of Forest Growth Responses to Environmental Stress, Timber Press, Portland, 1990, pp. 159-165.
- K. Kramer, “Phenology and Growth of European Trees in Relation to Climate Change,” In: H. Leith and M. Schwartz, Eds., Phenology in Seasonal Climates I, Backhuys Publishers, Leiden, 1997, pp. 39-50.
- H. Bӧhlenius, T. Huang, L. Charbonnel-Campaa, A. M. Brunner, S. Jansson, S. H. Strauss and O. Nilsson, “CO/ FT Regulatory Module Controls Timing of Flowering and Seasonal Growth Cessation in Trees,” Science, Vol. 312, No. 5776, 2006, pp.1040-1043. http://dx.doi.org/10.1126/science.1126038
- O.M. Heide, “Daylength and Thermal Time Responses of Budburst during Dormancy Release in Some Northern Deciduous Trees,” Physiologia Plantarum, Vol. 88, 4, 1993, pp. 531-540. http://dx.doi.org/10.1111/j.1399-3054.1993.tb01368.x
- T. Myking, “Dormancy, Budburst and Impacts of Climatic Warming in Coastal-Inland and Altitudinal Betula pendula and B. pubescens Ecotypes,” In: H. Leith and M. Schwartz, Eds., Phenology in Seasonal Climates I, Backhuys Publishers, Leiden, 1997, pp. 51-66.
- J. Partanen, J., V. Koski and H. Hanninen, “Effects of Photoperiod and Temperature on the Timing of Bud Burst in Norway Spruce (Picea abies),” Tree Physiology, Vol. 18, No. 2, 1998, pp. 811-816. http://dx.doi.org/10.1093/treephys/18.12.811
- A. Larigauderie and J. Kummerow, “The Sensitivity of Phenological Events to Changes in Nutrient Availability for Several Plant Growth Forms in the Arctic,” Holoarctic Ecology, Vol. 14, No. 1, 1991, pp. 38-44.
- J. Wagner and B. Reichegger, “Phenology and Seed Development of the Alpine Sedge Carex curvula and Carex firma in Response to Contrasting Topoclimates,” Arctic and Alpine Research, Vol. 29, No. 3, 1997, pp. 291-299. http://dx.doi.org/10.2307/1552143
- A. Menzel and P. Fabian, “Growing Season Extended in Europe,” Nature, Vol. 397, No. 6721, 1999, p. 659. http://dx.doi.org/10.1038/17709
- M. D. Schwartz, “Phenology: An Integrative Environmental Science,” Kluwer Academic Publishers, Boston, 2003. http://dx.doi.org/10.1007/978-94-007-0632-3
- A. Menzel, “Europe,” In: M. D. Schwartz, Ed., Phenology: An Integrative Environmental Science, Kluwer Academic Publishers, Boston, 2003, pp. 45-56. http://dx.doi.org/10.1007/978-94-007-0632-3_4
- T. Sparks and P. Carey, “The Response of Species to Climate Over Two Centuries: An Analysis of the Marsham Phenological Record,” Journal of Ecology, Vol. 83, No. 2, 1995, pp. 321-329. http://dx.doi.org/10.2307/2261570
- A. Miller-Rushing and R. B. Primack, “Global Warming and Flowering Times in Thoreau’s Concord,” Ecology, Vol. 89, No. 2, 2008, pp. 332-341. http://dx.doi.org/10.1890/07-0068.1
- N. L. Bradley, A. C. Leopold, J. Ross and W. Huffaker, “Phenological Changes Reflect Climate Change in Wisconsin,” Ecology, Vol. 96, No. 17, 1999, pp. 9701-9704.
- A. Leopold and S. E. Jones, “A Phenological Record for Sauk and Dane Counties, Wisconsin, 1935-1945,” Ecological Monographs, Vol. 17, No. 1, 1947, pp. 81-122. http://dx.doi.org/10.2307/1948614
- J. Magnuson, “Long-Term Ecological Research and the Invisible Present,” Bioscience, Vol. 40, No. 7, 1990, pp. 495-501. http://dx.doi.org/10.2307/1311317
- IPCC, “Climate Change 2007: The Physical Science Basis,” Cambridge University Press, Cambridge, 2007.
- G. Jacobson, I. Fernandez, S. Jain, P. Mayewski and S. Norton, “Main Climate Future: An Initial Assessment,” University of Maine, Orono, 2009.
- M. Murray, M. Cannell and R. Smith, “Date of Budburst of Fifteen Tree Species in Britain Following Climatic Warming,” Institute of Terrestrial Ecology, Vol. 26, No. 2, 1989, pp. 693-700.
- J.A. Elvir, G. B. Wiersma, M. E. Day, M. S. Greenwood and I. J. Fernandez, “Effects of Enhanced Nitrogen Deposition on Foliar Chemistry and Physiological Processes of Forest Trees at the Bear Brook Watershed in Maine,” Forest Ecology and Management, Vol. 221, No. 1-3, 2006, pp. 207-214. http://dx.doi.org/10.1016/j.foreco.2005.09.022
- S. G. Pallardy, “Physiology of Woody Plants,” Elsevier, Burlington, 2008.
- R. van den Driessche, “Relationship between Spacing and Nitrogen Fertilization of Seedlings in the Nursery, Seedling Mineral Nutrition, and Outplanting Performance,” Canadian Journal of Forest Research, Vol. 14, No. 3, 1984, pp. 431-436. http://dx.doi.org/10.1139/x84-076
- F. S. Gilliam, M. B. Adams and B. M. Yurish, “Ecosystem Nutrient Responses to Chronic Nitrogen Inputs at Fernow Experimental Forest, West Virginia,” Canadian Journal of Forest Research, Vol. 26, 1996, pp. 196-205. http://dx.doi.org/10.1139/x26-023
- P. G. Schaberg, “Effects of Chronic Low-Level N Additions on Foliar Elemental Concentrations, Morphology, and Gas Exchange of Mature Montane Red Spruce,” Canadian Journal of Forest Research, Vol. 27, No. 10, 1997, pp. 1622-1629. http://dx.doi.org/10.1139/x97-124
- H. F. van Dijk and J. G. Roelofs, “Effects of Excessive Ammonium Deposition on the Nutritional Status and Condition of Pine Needles,” Physiologia Plantarum, Vol. 73, No. 4, 1988, pp. 494-501. http://dx.doi.org/10.1111/j.1399-3054.1988.tb05431.x
- G. White, I. Fernandez and G. Wiersma, “Impacts of Ammonium Sulfate Treatment on the Foliar Chemistry of Forest Trees at the Bear Brook Watershed in Maine,” Environmental Monitoring and Assessment, Vol. 55, No. 1, 1999, pp. 235-250. http://dx.doi.org/10.1023/A:1006186105021
- I. Fernandez, G. Lawrence and K. Richards, “Characteristics of Foliar Chemistry in a Commercial Spruce-Fir Stand of Northern New England, USA,” Plant and Soil, Vol. 125, No. 2, 1990, pp. 228-292. http://dx.doi.org/10.1007/BF00010668
- J. A. Kost and R. Boerner, “Foliar Nutrient Dynamics and Nutrient Use Efficiency in Cornus florida,” Oecologia, Vol. 66, No. 4, 1985, pp. 602-606. http://dx.doi.org/10.1007/BF00379355
- R. K. Tew, “Seasonal Variation in the Nutrient Content of Aspen Foliage,” Journal of Wildlife Management, Vol. 34, No. 2, 1970, pp. 475-480. http://dx.doi.org/10.2307/3799040
- A. V. Barker and D. J. Pilbeam, “Handbook of Plant Nutrition,” CRC Press, Boca Raton, 2007.
- H. Lambers, F. S. Chapin and T. L. Pons, “Plant Physiological Ecology,” Springer, New York, 2008. http://dx.doi.org/10.1007/978-0-387-78341-3
- I. J. Fernandez, L. E. Rustad, S. A. Norton, J. S. Kahl and B. J. Cosby, “Experimental Acidification Causes Soil BaseCation Depletion at the Bear Brook Watershed in Maine,” Soil Science Society of America Journal, Vol. 67, No. 6, 2003, pp. 1909-1919. http://dx.doi.org/10.2136/sssaj2003.1909
- B. D. Sigurdsson, “Elevated [CO2] and Nutrient Status Modified Leaf Phenology and Growth Rhythm of Young Populus trichocarpa Trees in a 3-Year Field Study,” Trees, Vol. 15, No. 7, 2001, pp. 403-413. http://dx.doi.org/10.1007/s004680100121
- I. S. Fløistad, “Effects of Excessive Nutrient Supply and Short Day Treatment on Autumn Frost Hardiness and Time of Bud Break in Picea abies Seedlings,” Scandinavian Journal of Forest Research, Vol. 17, No. 4, 2002, pp. 295-303. http://dx.doi.org/10.1080/02827580260138053
- I. S. Fløistad and K. Kohmann, “Influence of Nutrient Supply on Spring Frost Hardiness and Time of Bud Break in Norway Spruce (Picea abies (L.) Karst.) Seedlings,” New Forests, Vol. 27, No. 1, 2004, pp. 1-11. http://dx.doi.org/10.1023/A:1025085403026
- S. Norton, J. Kahl, I. Fernandez, T. Haines, L. Rustad, S. Nodvin, J. Scofield, T. Strickland, H. Erikson, P. J. Wigington and J. Lee, “The Bear Brook Watershed, Maine (BBWM), USA,” Environmental Monitoring and Assessment, Vol. 55, No. 1, 1999, pp. 7-51. http://dx.doi.org/10.1023/A:1006115011381
- J. D. Eckhoff and G. B. Wiersma, “Baseline Data for Long-Term Forest Vegetation Monitoring at Bear Brook Watershed in Maine,” Maine Agricultural and Forest Experiment Station: Technical Bulletin, University of Maine, Orono, Vol. 180, 2002.
- S. A. Norton, J. S. Kahl, I. J. Fernandez, L. E. Rustad, J. P. Schofield and T. A. Haines, “Response of West Bear Brook Watershed, Maine, USA, to the Addition of (NH4)2SO4: 3-Year Results,” Forest Ecology and Management, Vol. 68, No. 1, 1994, pp. 61-73. http://dx.doi.org/10.1016/0378-1127(94)90138-4
- J. D. Eckhoff, “Efficacy of Forest Health Monitoring Indicators to Evince Impacts on a Chemically Manipulated Watershed,” Ph.D. Dissertation, University of Maine, Orono, 2000.
- J. A. Elvir, “Effects of Ten Years of Chronic Ammonium Sulfate Treatment on the Forest Component at the Bear Brook Watershed in Maine,” Master’s Thesis, University of Maine, Orono, 2001.
- J. A. Elvir, G. B. Wiersma, S. Bethers and P. Kenlan, “Effects of Chronic Ammonium Sulfate Treatment on the Forest at the Bear Brook Watershed in Maine,” Environmental Monitoring and Assessment, Vol. 171, No. 1-4, 2010, pp. 129-147. http://dx.doi.org/10.1007/s10661-010-1523-3
- F. W. Ewers and R. Schmid, “Longevity of Needle Fascicles of Pinus longaeva (Bristlecone Pine) and Other North American Pines, Oecologia, Vol. 51, No. 1, 1981, pp. 107- 115. http://dx.doi.org/10.1007/BF00344660
- Northeast Regional Climate Center, “NOWData—NOAA Online Weather Data,” 2011. http://www.nrcc.cornell.edu/
- R Development Core Team, “R: A Language and Environment for Statistical Computing,” 2007. http://www.R-project.org.
- R. J. Norby, J. S. Hartz-Rubin and M. J. Verbrugge, “Phenological Responses in Maple to Experimental Atmospheric Warming and CO2 Enrichment,” Global Change Biology, Vol. 9, No. 12, 2003, pp. 1792-1801. http://dx.doi.org/10.1111/j.1365-2486.2003.00714.x
- R. Häkkinen, T. Linkosalo and P. Hari, “Effects of Dormancy and Environmental Factors on Timing of the Bud Burst in Betula pendula,” Tree Physiology, Vol. 18, No. 10, 1998, pp. 707-712. http://dx.doi.org/10.1093/treephys/18.10.707
- C. K. Augspurger and E. A. Bartlett, “Differences in Leaf Phenology between Juvenile and Adult Trees in a Temperature Deciduous Forest,” Tree Physiology, Vol. 23, No. 8, 2003, pp. 517-525. http://dx.doi.org/10.1093/treephys/23.8.517
- D. S. Gill, J. S. Amthor and F. H. Bormann, “Leaf Phenology, Photosynthesis, and the Persistence of Saplings and Shrubs in a Mature Northern Hardwood Forest,” Tree Physiology, Vol. 18, No. 5, 1998, pp. 281-289. http://dx.doi.org/10.1093/treephys/18.5.281
- R. M. Godman, “Silvical Characteristics of Sugar Maple,” Lake States Forest Experiment Station, Saint Paul, 1962.
- M. J. Lechowicz, “Why Do Temperate Deciduous Trees Leaf out at Different Times? Adaptation and Ecology of Forest Communities,” The American Naturalist, Vol. 124, No. 6, 1984, pp. 821-842. http://dx.doi.org/10.1086/284319
- R. S. Walters and H. W. Yawney, “Silvics Manual: Volume 2: Hardwoods,” United States Department of Agriculture, Forest Service, Washington, DC, 2004.
- B. M. Blum, “Silvics Manual: Volume 1: Conifers,” United States Department of Agriculture, Forest Service, Washington, DC, 1998.
- B. M. Blum, “Variation in the Phenology of Bud Flushing in White and Red Spruce,” Canadian Journal of Forest Research, Vol. 18, No. 3, 1988, pp. 315-319. http://dx.doi.org/10.1139/x88-048
- J. D. Aber, K. J. Nadelhoffer, P. Steudler and J. M. Melillo, “Nitrogen Saturation in Northern Forest Ecosystems,” BioScience, Vol. 39, No. 6, 1989, pp. 378-386. http://dx.doi.org/10.2307/1311067
- A. H. Magill, J. D. Aber, J. J. Hendricks, R.D. Bowden, J. M. Melillo and P. A. Steudler, “Biogeochemical Response of Forest Ecosystems to Simulated Chronic Nitrogen Deposition,” Ecological Applications, Vol. 7, No. 2, 1997, pp. 402-415. http://dx.doi.org/10.1890/1051-0761(1997)007[0402:BROFET]2.0.CO;2
- S. G. McNulty, J. D. Aber and S. D. Newman, “Nitrogen Saturation in High Elevation New England Spruce-Fir Stand,” Forest Ecology and Management, Vol. 84, No. 1-3, 1996, pp. 109-121. http://dx.doi.org/10.1016/0378-1127(96)03742-5
- K. Kramer, I. Leinonen and D. Loustau, “The Importance of Phenology for the Evaluation of Impact of Climate Change on Growth of Boreal, Temperate and Mediterranean Forest Ecosystems: An Overview,” International Journal of Biometeorology, Vol. 44, No. 2, 2000, pp. 67-75. http://dx.doi.org/10.1007/s004840000066
- M. D. SanClements, I. J. Fernandez and S. A. Norton, “Phosphorus in Soils of Temperate Forests: Linkages to Acidity and Aluminum,” Soil Science Society of America Journal, Vol. 74, No. 6, 2010, pp. 2175-2186. http://dx.doi.org/10.2136/sssaj2009.0267
- L. Taiz and E. Zeiger, “Plant Physiology,” Sinauer Associates, Inc., Sunderland, 2006.
- R. A. Hallet, S. W. Bailey, S. B. Horsley and R. P. Long, “Influence of Nutrition and Stress on Sugar Maple at a Regional Scale,” Canadian Journal of Forest Research, Vol. 36, No. 9, 2006, pp. 2235-2246. http://dx.doi.org/10.1139/x06-120
- S. B. Horsley, R. P. Long, S. W. Bailey, R. A. Hallett and T. J. Hall, “Factors Associated with the Decline Disease of Sugar Maple on the Allegheny Plateau,” Canadian Journal of Forest Research, Vol. 30, No. 9, 2000, pp. 1365- 1378. http://dx.doi.org/10.1139/x00-057
- M. D. SanClements, I. J. Fernandez and S. A. Norton, “Soil Chemical and Physical Properties at the Bear Brook Watershed in Maine, USA,” Environmental Monitoring and Assessment, Vol. 171, No. 1-4, 2010, pp. 111-128. http://dx.doi.org/10.1007/s10661-010-1531-3
- S. B. St. Clair and J. P. Lynch, “Base Cation Stimulation of Mycorrhization and Photosynthesis of Sugar Maple on Acid Soils Are Coupled by Foliar Nutrient Dynamics,” New Phytologist, Vol. 165, No. 2, 2005, pp. 581-590. http://dx.doi.org/10.1111/j.1469-8137.2004.01249.x
- W. C. Shortle and K. T. Smith, “Aluminum-Induced Calcium Deficiency Syndrome in Declining Red Spruce,” Science, Vol. 240, No. 4855, 1988, pp. 1017-1018. http://dx.doi.org/10.1126/science.240.4855.1017
- M. A. Cooke, P. Widden and I. O’Halloran, “Morphology, Incidence, and Fertilization Effects of the Vesicular-Arbuscular Mycorrhizea of Acer saccharum in a Quebec Hardwood Forest,” Mycologia, Vol. 84, No. 3, 1992, pp. 422-430. http://dx.doi.org/10.2307/3760195
- R. Ouimet, C. Camire and V. Furlan, “Endomycorrhizal Status of Sugar Maple in Relation to Tree Decline and Foliar, Fine-Roots and Soil Chemistry in the Beauce Region, Quebec,” Canadian Journal of Botany, Vol. 73, No. 8, 1995, pp. 1168-1175. http://dx.doi.org/10.1139/b95-126
- D. H. DeHayes, P. G. Schaberg, G. J. Hawley, C. H. Borer, J. R. Cumming and G. R. Strimbeck, “Physiological Implications of Seasonal Variation in Membrane-Associated Calcium in Red Spruce Mesophyll Cells,” Tree Physiology, Vol. 17, No. 11, 1997, pp. 687-695. http://dx.doi.org/10.1093/treephys/17.11.687
- S. B. St. Clair, J. E. Carlson and J. P. Lynch, “Evidence for Oxidative Stress in Sugar Maple Stands Growing on Acidic, Nutrient Imbalanced Forest Soils,” Oecologia, Vol. 145, No. 2, 2005, pp. 258-269.
- O. M. Heide, “Dormancy Release in Beech Buds (Fagus sylvatica) Requires Both Chilling and Long Days,” Physiologia Plantarum, Vol. 89, No. 1, 1993, pp. 187-191. http://dx.doi.org/10.1111/j.1399-3054.1993.tb01804.x
- T. Myking and O. M. Heide, “Dormancy Release and Chilling Requirement of Buds of Latitudinal Ecotypes of Betula pendula and B. pubescens,” Tree Physiology, Vol. 15, No. 11, 1995, pp. 697-704. http://dx.doi.org/10.1093/treephys/15.11.697
NOTES
*Corresponding author.