Open Journal of Veterinary Medicine
Vol.3 No.2(2013), Article ID:32700,8 pages DOI:10.4236/ojvm.2013.32026
Development and Validation of an Objective Risk Scoring System for Assessing the Likelihood of Virus Introduction in Porcine Reproductive and Respiratory Syndrome Virus-Free Sow Farms in the US
1Department of Veterinary Diagnostic and Production Animal Medicine, College of Veterinary Medicine, Iowa State University, Ames, USA
2Department of Statistics, College of Arts and Sciences, Iowa State University, Ames, USA
3Boehringer Ingelheim Vetmedica Inc., St. Joseph, USA
Email: *holtkamp@iastate.edu
Copyright © 2013 Derald J. Holtkamp et al. This is an open access article distributed under the Creative Commons Attribution License, which permits unrestricted use, distribution, and reproduction in any medium, provided the original work is properly cited.
Received March 9, 2013; revised April 9, 2013; accepted May 9, 2013
Keywords: Porcine Reproductive and Respiratory Syndrome (PRRS); Group Lasso; Logistic Regression; Risk Scoring System; Area under the ROC Curve
ABSTRACT
The lack of validated tools to predict how long sow farms will remain PRRS virus-free following successful elimination of the virus has deterred veterinarians and producers from attempting to eliminate the PRRS virus from sow farms. The aim of this study was to use the database of PRRS Risk Assessments for the Breeding Herd in PADRAP to develop and validate an objective risk scoring system for predicting the likelihood of virus introduction in PRRS virus-free sow farms in the US. To overcome the challenges of dealing with a large number of variables, group lasso for logistic regression (GLLR) was applied to a retrospective dataset of PRRS Risk Assessment for the Breeding Herd surveys completed for 704 farms to develop the risk scoring system. The validity of the GLLR risk scoring system was then evaluated by testing its predictive ability on a dataset from a long-term prospective study of 196 sow farms to assess risk factors associated with how long PRRS virus-free sow farms remained PRRS virus-free. Receiver operator characteristic(ROC) curves were estimated to compare the performance of the GLLR risk scoring system to the risk scoring system based on expert opinion (EO), currently used in the PRRS Risk Assessment for the Breeding Herd, for predicting whether herds remained PRRS virus-free for 130 weeks. The GLLR risk scoring system (AUC, 0.76; 95% CI, 0.67 - 0.84) performed significantly better than the EO risk scoring system (AUC, 0.36; 95% CI, 0.27 - 0.46) for predicting whether to sow farms in the prospective study survived for 130 weeks (p < 0.001). Dividing farms into 3 risk groups (low, medium and high) using a low and high cutoff values for the GLLR risk score was informative as the differences in the KM survival curves for the 3 groups were both clinically meaningful and statistically significant. The GLLR risk scoring system used in conjunction with the PRRS Risk Assessment for the Breeding Herd survey delivered through PADRAP appears to have the potential to help veterinarians predict the likelihood of virus introduction in PRRS virus-free sow farms in the US.
1. Introduction
Porcine reproductive and respiratory syndrome (PRRS), caused by the highly infectious PRRS virus, is a costly and frustrating challenge to the global swine industry. Productivity losses in the United States swine industry are estimated to be $664 million annually [1]. In 2006, the virus decimated China’s pig populations and drove up pork prices by 85 percent [2]. In recent years, a variety of methods have been developed and applied for the elimination of porcine reproductive and respiratory syndrome (PRRS) virus from sowing farms [3-6]. These elimination methods in breed-to-wean sow farms can be characterized as both complete depopulation and repopulation of the site with PRRS virus-free breeding replacements or herd rollovers [7]. Elimination methods defined as herd rollovers involve eliminating the virus without completely depopulating and repopulating the site with PRRS virus-free breeding replacements. Herd rollovers are generally less expensive to execute compared to complete depopulation and repopulation. However, keeping farms free of the PRRS virus long enough to recover the costs of eliminating it has proven to be challenging. Furthermore, clinical PRRS outbreaks caused by re-introduction of the virus into farms where the virus has been eliminated are often more severe due to the lack of immunity in subpopulations or the entire sow farm [1].
The decision to eliminate the virus from a sow farm depends on three factors: 1) the probability of success in eliminating the virus; 2) how much it will cost to eliminate the virus and 3) how long the sow farm is expected to stay PRRS virus-free. If done correctly, the probability of success for both complete depopulation and repopulation with PRRS virus-free breeding replacements and herd rollovers is highly and reasonably predictable. The cost of eliminating the virus is predictable but will vary according to the method used as well as such things as availability of space for breeding replacements and other factors. How long the sow farm is expected to stay PRRS virus-free, however, is highly variable and unpredictable. An approach that enabled producers and veterinarians to systematically evaluate and predict the risk of virus introduction in PRRS virus-free sow farms would remove some of the unpredictability and would be helpful for evaluating whether to attempt PRRS virus elimination.
In human medicine a plethora of scoring systems have been developed and used to systematically evaluate and predict outcomes and there are a few in veterinary medicine as well. For example, Rockar et al. developed an animal trauma triage scoring system for comprehensively assessing the veterinary trauma patient [8]. However, development of scoring systems in veterinary medicine at the animal or herd level has been inhibited by the lack of sufficient data on risk factors, and clinical outcomes needed to develop them.
The American Association of Swine Veterinarians (AASV) Production Animal Disease Risk Assessment Program (PADRAP) was developed to help the swine industry better understand, measure and benchmark biosecurity and disease risks faced by swine producers [9]. Risk assessment surveys including the PRRS Risk Assessment for the Breeding Herd are delivered through PADRAP. The PRRS Risk Assessment for the Breeding Herd includes a large number of questions regarding risk factors for clinical PRRS outbreaks for individual sow farms including those caused by the introduction of the PRRS virus in farms previously free of the virus. AASV members use the PRRS Risk Assessment for the Breeding Herd to help producers quantify and systematically assess risks that may be associated with PRRS outbreaks. Risks are quantified using a risk scoring system based on expert opinion (EO). Approximately one hour is required to complete the survey. As assessments are performed the completed surveys are added to the dataset maintained at the Iowa State University College of Veterinary Medicine. The ability of the current EO risk scoring system, used to quantify risk in the PRRS Risk Assessment for the Breeding Herd, to predict the likelihood of PRRS virus introduction has not been assessed.
The aim of this study was to use the database of PRRS Risk Assessments for the Breeding Herd in PADRAP to develop and validate an objective risk scoring system for predicting the likelihood of virus introduction in PRRS virus-free sow farms in the US. To overcome the challenges of dealing with a large number of variables in the model, group lasso for logistic regression (GLLR) [10] was applied to the retrospective dataset of PRRS Risk Assessment for the Breeding Herd surveys for 704 farms to develop the risk scoring system. The validity of the GLLR risk scoring system was then evaluated by testing its predictive ability on a prospective dataset. The validation was performed with data from a long-term prospective study of 196 sow farms to assess risk factors associated with how long PRRS virus-free sow farms remained PRRS virus-free.
2. Methods
2.1. Data Used to Develop the Risk Scoring Systems
Version 2 of the PRRS Risk Assessment for the Breeding Herd was developed using a group consensus approach with the aid of the PRRS Risk Assessment Working Group composed of 21 veterinarians and researchers with expertise in PRRS. Questions about risk factors for the occurrence of clinical PRRS outbreaks and possible responses were identified by the group. A Delphi survey approach was used with this group to establish importance levels for the questions and risk scores for each response. These importance levels and risk scores estimated on the basis of a consensus of expert opinion were considered an initial estimate.
The EO risk scoring system developed by the working group involved assigning 1 of 7 possible discrete risk points that ranged from 1 to 100. The working group assigned risk points according to the estimated strength of the causal association between each response and the occurrence of clinical outbreaks of PRRS as the event of interest, 1 being the weakest and 100 the strongest association. The 7 possible risk points were 1.0, 2.2, 4.6, 10.0, 21.5, 46.4 and 100.0. Use of discrete values, rather than a continuous scale from 1 to 100, was used to avoid conveying a level of precision that is greater than can be justified with the estimation of risk scores on the basis of expert opinion.
Importance levels for each question from the Delphi survey were used to narrow the list of questions to be included in the final survey. From the initial list of 260 survey questions, 155 questions were selected to be included in the final survey. Of the 155 questions in version 2 of the PRRS Risk Assessment for the Breeding Herd 31 capture information about internal risk factors and 124 questions about external risk factors. The section of the survey about internal risk factors includes questions about bio-management factors that are important when the virus is already present in the farm. It also includes questions about the PRRS outbreak history of the farm; the PRRS status of the herd; and other factors, such as vaccine use, that are highly correlated with the PRRS status of the herd. External risk factors include those factors that are important for excluding the virus from a farm that is free of the virus or new strains of the virus from a farm where the virus is already present. The internal and external categories of risk factors were further subcategorized.
The data used to develop and validate the GLLR risk scoring system includes surveys in the database completed between March 2005 and March 2009. The unit of concern was the sow farm and therefore, the most recent complete survey for 896 sow farms in the United States or Canada were included in the database used to develop and validate the GLLR risk scoring system. Of those, 196 were completed for a long-term prospective study to assess risk factors associated with how long PRRS virusfree sow farms remained PRRS virus-free. These were excluded from the retrospective dataset and subsequently used to validate the risk scoring system. Therefore, surveys for 704 sow farms were used to develop the GLLR risk scoring system.
The outcome variable used to develop the GLLR risk scoring system was whether the sow farm had one or more PRRS outbreaks in the three years prior to when the survey was completed. In the survey, a clinical PRRS outbreak was defined as an increase in one or more reproductive performance measures that exceeds normal variation with diagnostic confirmation of PRRS virus involvement. Three questions from the survey used to determine the outcome variable, and a related question that asks for the number of PRRS clinical outbreaks in the previous three to five years, were excluded from the list of explanatory variables. Twenty-four other questions were also excluded because the response for each would generally be caused by a clinical PRRS outbreak and therefore inappropriate as an explanatory variable. Excluded were questions about the PRRS virus status and other factors, such as vaccine use, which is highly correlated with the PRRS status of the animals in the herd or incoming breeding replacements. The remaining 127 survey questions, 8 in the internal and 119 in the external risk factor sections of the survey, were used to develop the risk scoring system. Both categorical and continuous responses were included in the survey. All survey questions originally captured as continuous responses were transformed to categorical responses using cutoff values identified by the PRRS Risk Assessment Working Group for the purpose of assigning risk scores.
2.2. Methods for Development of Risk Scoring System
A standard approach to construct a scoring system is multivariate logistic regression. The variable selection is frequently based on variable significance and the coefficient estimates from the logistic regression models can be used as scores assigned to selected variables [11]. “Quasi-complete-separation”, however, can occur when the number of variables is large, as it was for this analysis, which leads to unstable coefficient estimates [12]. Meier et al. proposed a GLLR method suitable for highdimensional multivariate logistic regression problems which estimates coefficients accurately [10]. GLLR is also considered a variable selection method because coefficients estimated to be 0 do not contribute to the model.
GLLR was applied for this analysis as previously described by Lin et al. [13]. The possible responses for each survey question were first converted to dummy indicator variables. All possible responses for the same question were considered to be in the same group. After excluding the baseline variable from each group, there were 339 dummy variables from the 127 questions (groups). The variable selected as the baseline for each group was the one with the lowest risk score according to the current risk scoring system based on expert opinion. R package “grplasso” was used to perform the GLLR [14]. We applied leave-one-out cross validation to choose the tuning parameter that maximizes area under the receiver operator characteristic (ROC) curve in the GLLR algorithm, using the multiplicative grid method proposed by Meier et al. [10]. The estimated values of coefficients from the GLLR model were used as the risk scores for corresponding responses. The overall GLLR risk score of a farm is the sum of scores from all questions included in the GLLR model. All calculations were programmed in R [15].
2.3. Validation of the Risk Scoring System
Sow farms for the long-term prospective study of 196 PRRS virus-free sow farms in the US were enrolled in 2006 and 2007. The data generated by this study was used to validate the GLLR risk scoring system. The PRRS status of the sow farms were routinely monitored for the duration of the study. Survival was defined as remaining PRRS virus-free and ended when a sow farm was confirmed by the collaborating veterinarian to be PRRS virus-infected. Confirmation of infection was determined and recorded when diagnostics were completed to confirm the sow farm was no longer free of the PRRS virus. For the sow farms identified as infected, the survival time was calculated as the number of weeks between the date the sow farm was enrolled and the confirmation of positive date. Sow farms that were removed before the end of the analysis period (March 17, 2011) were treated as censored. All sow farms in the study had been enrolled for at least 130 weeks at the end of the analysis period. The dichotomous outcome variable was the survival status at 130 weeks post enrollment.
Version 2 of the PRRS Risk Assessment for the Breeding Herd was used to collect information on the risk factors. The risk assessments used for the purpose of validating the GLLR risk scoring system were completed at the time the farms were enrolled in the study. The GLLR risk scoring system was applied to the completed risk assessments to determine an overall risk score for each sow farm. The overall GLLR risk score of a farm was calculated as the sum of all coefficient estimates corresponding to the survey responses provided for the farm for all questions included in the GLLR model. The overall EO risk score was calculated as the sum of the risk scores based on expert opinion corresponding to the survey responses for all questions included in the GLLR model. Calculations of the overall risk scores were performed in R [15]. Risk scores for only the questions in the internal and external sections of the survey were also calculated.
ROC curve analysis was used to compare the performance of the GLLR risk scoring system to the currently used EO risk scoring system for predicting whether herds survived, that is remained PRRS virus-free for 130 weeks. The dichotomous outcome variable was the survival status at 130 weeks post enrollment. The risk scoring system with the higher area under the curve (AUC) was regarded as superior.
Two cutoff values for the overall risk score to categorize the risk were selected and evaluated. One cutoff value with a high positive predictive value (PPV) and the other with a high negative predictive value (NPV) were selected to form three risk groups (low, medium and high). Kaplan-Meier survival curves and the log-rank test was applied to compare the difference in how long PRRS virus-free sow farms remained virus-free among the three groups. Sow farms remaining PRRS virus-free at the end of the analysis period were right censored. The survival package in R was used to perform the “survival” analysis [16].
3. Results
Among the 704 sow farms in the dataset of risk assessments used to develop the GLLR risk scoring system, 398 (56.8%) sow farms had outbreaks in the past 3 years. The farms were located throughout the US. One hundred and eighty-four (26.1%) farms were located in relatively pig dense Midwest states; 56 (8%) from Iowa; 39 (5.5%) from Minnesota; 33 (4.7%) from Illinois and 15 (2.1%) from Indiana. Forty-one (5.8%) farms were from the other Midwest states. There were 153 (21.7%) from North Carolina and the remaining 367 (52.1%) farms were from the other states in the US. Sow farms were categorized by size; 41 (5.8%) farms had fewer than 300 sows; 151 (21.4%) farms had 300 to 799 sows; 200 (28.4%) had 800 to 1999 sows; 175 (24.9%) had 2000 to 2999 sows and 137 (19.5%) had more than 2999 sows. There were 594 (84.4%) commercial farms and 110 (15.6%) genetic farms. Genetic farms were defined as those where the primary purpose was producing genetic replacements.
Of the 196 farms enrolled in the long-term prospective study of PRRS virus-free sow farms, 156 (79.6%) remained negative after 130 weeks. One-hundred eighty two (93%) survived for 1 year or longer. Seventy-nine (40.3%) farms were located in pig dense states in the Midwest; 12 (6%) from Iowa; 38 (19%) from Minnesota; 21 (11%) from Illinois and 8 (4%) from Indiana. Twentyone (11%) farms were from the other Midwest states. There were 18 (9%) from North Carolina. The remaining 78 (40%) farms were from the other states in the US. Sow farms were categorized by size; 1 (0.5%) farm had fewer than 300 sows; 50 (25.5%) had 300 to 799 sows; 42 (21.4%) had 800 to 1999 sows; 61 (31.1%) had 2000 to 2999 sows and 42 (21.4%) had more than 2999 sows. There were 95 (48.5%) commercial farms and 101 (51.5%) genetic farms.
Eighty-two of the 127 questions in the PRRS Risk Assessment for the Breeding Herd survey in the GLLR model had non-zero variable coefficients and were therefore included in the GLLR risk scoring system. Table 1 is a summary of the number of survey questions included in the GLLR risk scoring system by category of risk factors in the PRRS Risk Assessment for the Breeding Herd. Five of the eight (62%) internal risk factor questions were included in the GLLR risk scoring system. All the subcategories of risk factors had at least one question included. Seventy-seven of the 119 (65%) external risk factor questions were included in the scoring system.
ROC curves to compare the performance of the GLLR risk scoring system to the currently used EO risk scoring system for predicting whether herds remained PRRS virus-free for 130 weeks are presented in Figure 1. The ROC curve for the GLLR risk scoring system dominated the ROC curve for the EO risk scoring system. The GLLR
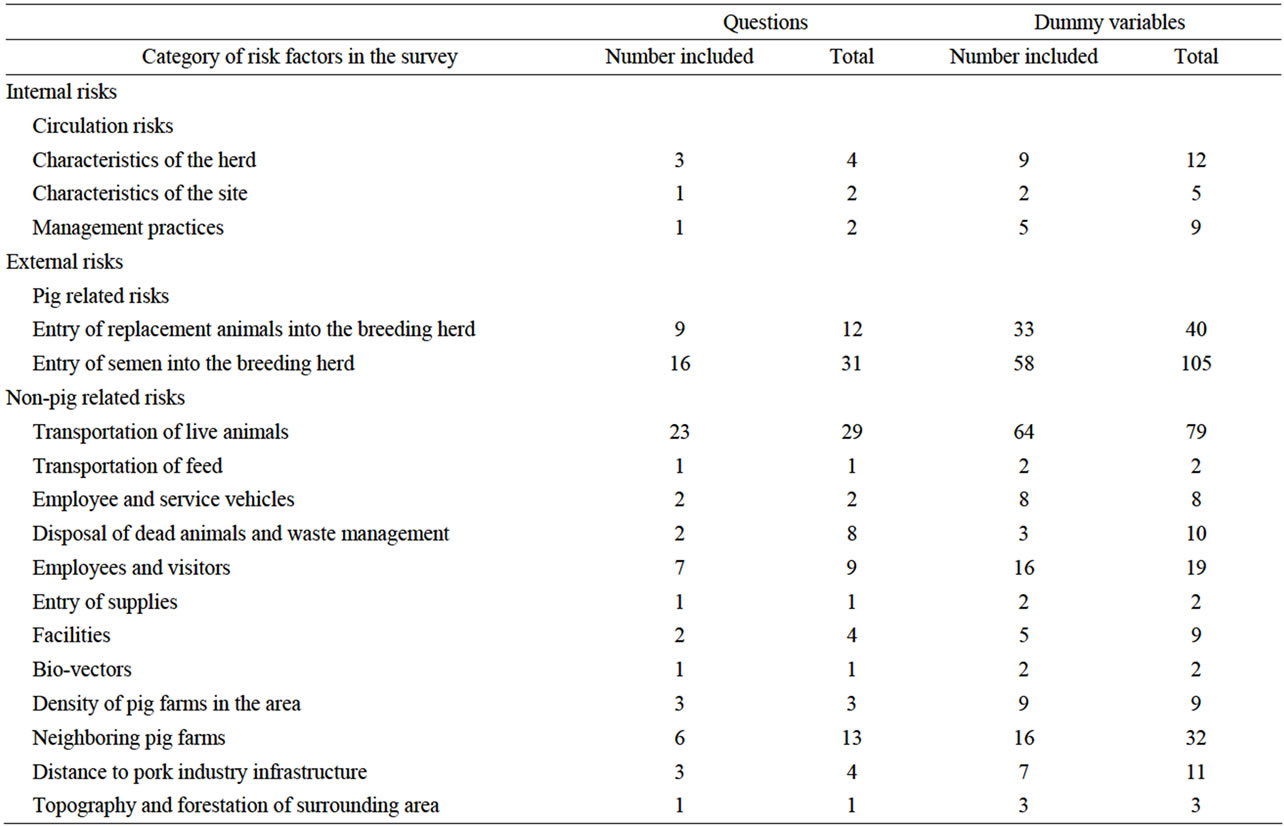
Table 1. Summary of number of questions in the risk scoring system determined by applying group lasso logistic regression (GLLR) to the database of PRRS Risk Assessment for the Breeding Herd surveys by category of risk factors.
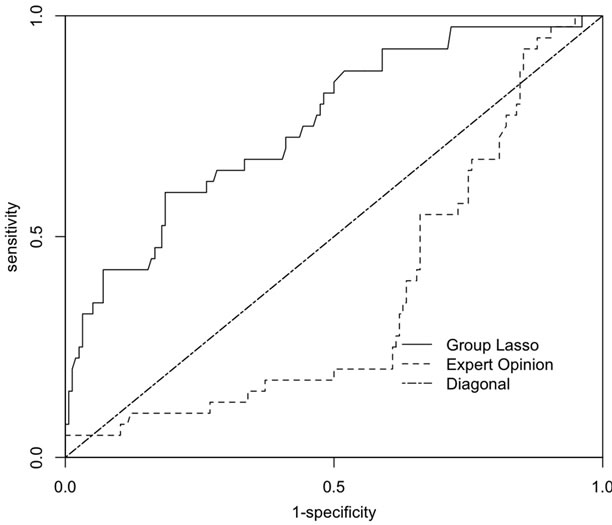
Figure 1. Receiver operator curves for the predicting whether a sow herd had one or more PRRS outbreaks in the previous three years with the risk scoring systems derived from expert opinion (EO) and by applying group lasso logistic regression (GLLR) to the database of PRRS Risk Assessment for the Breeding Herd surveys.
risk scoring system (AUC, 0.76; 95% CI, 0.67 - 0.84) performed significantly better than the EO risk scoring system (AUC, 0.36; 95% CI, 0.27 - 0.46) for predicting whether sow farms in the prospective study survived for 130 weeks (p < 0.001).
To explore the predictive ability of the GLLR risk scoring system, standardized internal and external risk scores were calculated using the GLLR risk scoring system. A scatter plot of whether farms in the long-term prospective study of 196 PRRS virus-free sow farms in the US survived for 130 weeks by their standardized internal and external risk scores is shown in Figure 2. The internal risk score was standardized by subtracting the group mean internal risk score and dividing by the square root of the sample variance. The standardized external risk score was calculated in the same manner. Eightyeight of the 98 (89.8%) sow farms with standardized external risk scores below the median stayed PRRS virus-free for 130 weeks. Sow farms with standardized external risk scores greater than or equal to the median were less likely to survive with only 68 of 98 (69.4%) remaining PRRS virus-free for 130 weeks. Eighty-two of the 98 (83.7%) sow farms with standardized internal risk scores below the median stayed negative for 130 weeks compared to only 74 out of 98 (75.5%) of the sow farms with standardized internal risk scores greater than or equal to the median remaining negative for 130 weeks. Remarkably,
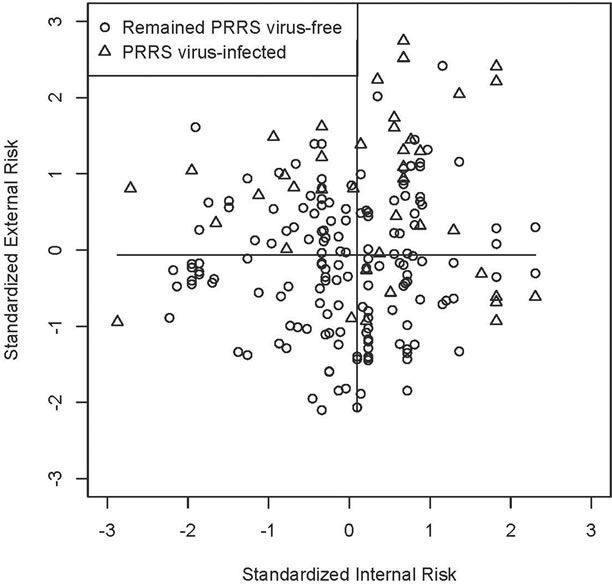
Figure 2. Scatter plot of whether farms in the long-term prospective study of 196 PRRS virus-free sow farms in the US survived for 130 weeks by their standardized internal and external risk scores determined by applying group lasso logistic regression (GLLR) to the database of PRRS Risk assessment for the breeding herd surveys.
45 of the 47 (95.7%) farms with standardized internal and external risk scores below the median, those in the lower left quadrant, remained PRRS virus-free for 130 weeks. For farms in all other quadrants, only 38 of 111 (74.5%) remained PRRS virus-free for 130 weeks.
To further evaluate the validity, and potential use, of the GLLR risk scoring system, the farms were divided into three groups by selecting a low and high cutoff value for the GLLR risk score (Figure 3). The low cutoff value was selected so that the NPV was at least 90 percent. The value with the highest PPV that met the NPV criteria was selected as the low cutoff value. The high cutoff value was selected so that the PPV was at least 80 percent because if a cutoff value was selected so that the PPV was at least 90 percent, only two farms met the criterion. Farms with an overall GLLR score smaller than the low cutoff were assigned to low risk group (88 farms); those with a score larger than the high cutoff were assigned to the high risk group (10 farms). All other farms were in the medium risk group (98 farms).
Kaplan-Meier survival curves for each of the risk groups are reported in Figure 4. The difference in the survival curves among the three risk groups was statistically significant (p < 0.001) by the log-rank chi-squared test. Figure 5 is a summary of sow farm survival by risk group for year 1, 2 and 130 weeks. Relative to farms in the low and medium risk groups, a greater percentage of farms in the high risk group became PRRS virus infected in 1 year, 2 years and 130 weeks. Only 2 of the 10 (20
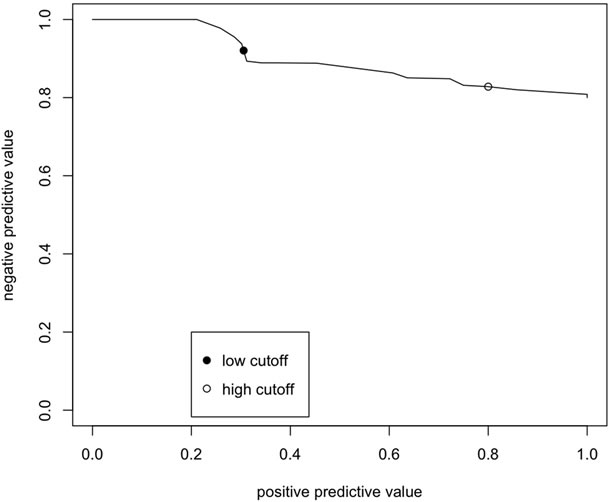
Figure 3. Plot of positive and negative predictive values for predicting whether farms in the long-term prospective study of 196 PRRS virus-free sow farms in the US survived for 130 weeks for alternative cutoff values of the risk score determined by applying group lasso logistic regression (GLLR) to the database of PRRS Risk Assessment for the Breeding Herd surveys.
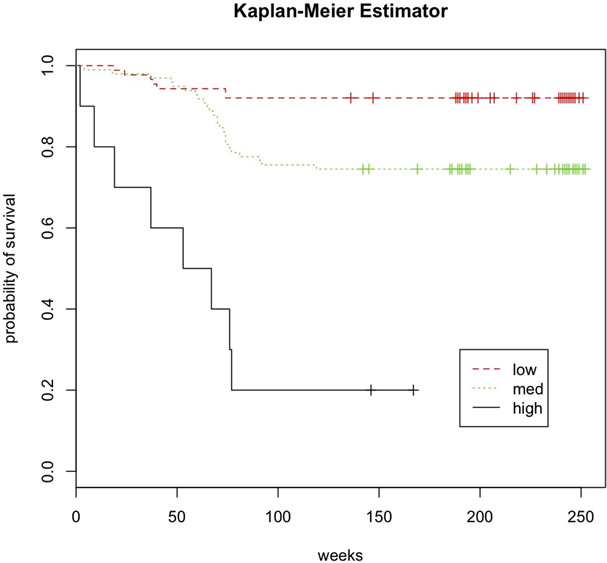
Figure 4. Kaplan-Meier survival curve for farms in the long-term prospective study of 196 PRRS virus-free sow farms in the US stratified by risk group. Risk groups defined by low and high cutoff value of the risk score determined by applying group lasso logistic regression (GLLR) to the database of PRRS Risk Assessment for the Breeding Herd surveys.
percent) farms in the high risk group remained negative after 2 years and 130 weeks. Relative to farms in the low risk group, a lesser percentage of farms in the medium risk group became infected in the first year; however, at the end of 2 years and 130 weeks, this relationship was reversed. Most (81 out of 88) of the farms in the low risk
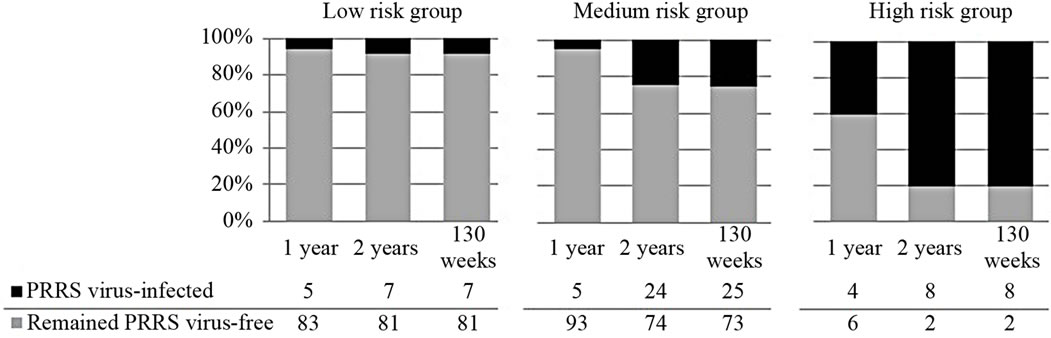
Figure 5. Survival of farms for 1 year, 2 years and 130 weeks in the long-term prospective study of 196 PRRS virus-free sow farms in the US by risk group. Risk groups defined by low and high cutoff value of the risk score determined by applying group lasso logistic regression (GLLR) to the database of PRRS Risk Assessment for the Breeding Herd surveys.
group stayed PRRS virus-free for 130 weeks
4. Discussion
The results of this study are encouraging as the GLLR risk scoring system developed to perform well. Dividing farms into 3 risk groups (low, medium and high) using a low and high cutoff values for the GLLR risk score was informative as the differences in the KM survival curves for the 3 groups were both clinically meaningful and statistically significant. The GLLR risk scoring system used in conjunction with the PRRS Risk Assessment for the Breeding Herd survey delivered through PADRAP appears to have the potential to help veterinarians predict the likelihood of virus introduction in PRRS virus-free sow farms in the US. If incorporated into PADRAP, the GLLR risk scoring system would enable producers and veterinarians to more confidently predict how long sow farms will remain PRRS virus-free following successful elimination of the virus. As a result, some of the uncertainty that has deterred veterinarians and producers from attempting to eliminate the PRRS virus from sowing farms would be removed.
The results reveal the limitations of relying on expert opinion for developing risk scoring systems in food animal medicine as the EO risk scoring system was a poor predictor of the likelihood of virus introduction into PRRS virus-free sow farms. The results also demonstrate the utility of group lasso for logistic regression for overcoming the challenges of dealing with the large number of variables.
The questions in the risk assessment survey were assigned to the internal and external risk sections, in part, on the basis of possible routes of transmission of the PRRS virus. Questions in all of the internal and external risk sections were included in the GLLR risk scoring system suggesting that all of the routes of transmission that were considered in this study were important enough to be included in the risk scoring system. This is consistent with the body of research demonstrating the importance of multiple routes by which PRRS virus is transmitted [17].
This study utilized the data in the PRRS Risk Assessment for the Breeding Herd survey delivered through PADRAP and used by a community of swine veterinarians. This was only possible because veterinarians use of the risk assessment survey has produced a large dataset of information on risk factors, incidence and clinical outcomes for PRRS virus in swine. Because of the resources needed to create these databases they have not previously been developed as they have in human medicine. A program like PADRAP which relies on a community of veterinarians using a program that is supported by a professional association is a way to successfully overcome the resource limitations in veterinary medicine.
5. Acknowledgements
The authors thank AASV, National Pork Board, National Pork Producers Council, Boehringer Ingelheim Vetmedica Inc., Newport Laboratories, Harrisvaccines and USDA (USDA NIFA Award 2008-55620-19132) for supporting PADRAP financially.
REFERENCES
- D. J. Holtkamp, et al., “Assessment of the Economic Impact of Porcine Reproductive and Respiratory Syndrome Virus on United States Pork Producers,” Journal of Swine Health and Production, Vol. 21, No. 2, 2013, pp. 72-84.
- Y. Li, et al., “Emergence of a Highly Pathogenic Porcine Reproductive and Respiratory Syndrome Virus in the Mid-Eastern Region of China,” The Veterinary Journal, Vol. 174, No. 3, 2007, pp. 577-584. doi:10.1016/j.tvjl.2007.07.032
- S. Dee, H. Joo, B. Park, T. Molitor and G. Bruna, “Attempted Elimination of Porcine Reproductive and Respiratory Syndrome Virus from a Seedstock Farm by Vaccination of the Breeding Herd and Nursery Depopulation,” Veterinary Record, Vol. 142, No. 21, 1998, pp. 569-572. doi:10.1136/vr.142.21.569
- S. Dee, M. Bierk, J. Deen and T. Molitor, “An Evaluation of Test and Removal for the Elimination of Porcine Reproductive and Respiratory Syndrome Virus from Five Swine Farms,” Canadian Journal of Veterinary Research, Vol. 63, No. 1, 2001, pp. 22-27.
- T. Gillespie and A. Carroll, “Methods of Control and Elimination of Porcine Reproductive and Respiratory Syndrome Virus Using Modified Live Vaccine in a TwoSite Production System,” Journal of Swine Health and Production, Vol. 11, No. 6, 2003, pp. 291-295.
- C. A. Corzo, E. Mondaca, S. Wayne, M. Torremorell, S. Dee, P. Davies and R. B. Morrison, “Control and Elimination of Porcine Reproductive and Respiratory Syndrome Virus,” Virus Research, Vol. 154, No. 1-2, 2010, pp. 185-192. doi:10.1016/j.virusres.2010.08.016
- D. J. Holtkamp, et al., “Terminology for Classifying Swine Herds by Porcine Reproductive and Respiratory Syndrome Virus Status,” Journal of Swine Health and Production, Vol. 19, No. 1, 2011, pp. 44-56.
- R. A. Rockar, K. S. Drobatz and F. S. Shofer, “Development of a Scoring System for the Veterinary Trauma Patient,” Journal of Veterinary Emergency and Critical Care, Vol. 4, No. 2, 1994, pp. 77-83. doi:10.1111/j.1476-4431.1994.tb00118.x
- American Association of Swine Veterinarians, “Production Animal Disease Risk Assessment Program,” 2012. http://www.padrap.org
- L. Meier, S. van de Geer and P. Buhlmann, “The Group Lasso for Logistic Regression,” Journal of the Royal Statistical Society: Series B, Vol. 70, 2008, pp. 53-71. doi:10.1111/j.1467-9868.2007.00627.x
- E. Barranger, et al., “An Axilla Scoring System to Predict Non-Sentinel Lymph Node Status in Breast Cancer Patients with Sentinel Lymph Node Involvement,” Breast Cancer Research and Treatment, Vol. 91, No. 2, 2005, pp. 113-119. doi:10.1007/s10549-004-5781-z
- A. Alert and J. A. Anderson, “On the Existence of Maximum Likelihood Estimates in Logistic Regression Models,” Biometrika, Vol. 71, No. 1, 1984, pp. 1-10. doi:10.1093/biomet/71.1.1
- H. Lin, C. Wang, P. Liu and D. J. Holtkamp, “Construction of Disease Risk Scoring Systems Using Logistic Group Lasso: Application to Porcine Reproductive and Respiratory Syndrome Survey Data,” Journal of Applied Statistics, Vol. 40, No. 4, pp. 736-746.
- L. Meier, “Grplasso: Fitting User Specified Models with Group Lasso Penalty,” R Package Version 0 4-2, 2009. http://CRAN.R-project.org/package=grplasso
- “R: A Language and Environment for Statistical Computing [Computer Program],” Vienna, R Foundation for Statistical Computing, 2011.
- R Development Core Team, “R Package Survival,” R Package Version 2 35-8, 2009. http://CRAN.R-project.org/package=survival
- J. J. Zimmerman, et al., “Porcine Reproductive and Respiratory Virus (Porcine Aterivirus),” In: J. J. Zimmerman, L. A. Karriker, A. Ramirez, K. J. Schwartz and G. W. Stevenson, Eds., Diseases of Swine, 10th Edition, WileyBlackwell, Hoboken, 2012, pp. 461-486.
NOTES
*Corresponding author.