Journal of Sustainable Bioenergy Systems
Vol. 2 No. 4 (2012) , Article ID: 26034 , 15 pages DOI:10.4236/jsbs.2012.24021
Simulation of Olive Kernel Gasification in a Bubbling Fluidized Bed Pilot Scale Reactor
Department of Chemical Engineering, Aristotle University of Thessaloniki, Thessaloniki, Greece
Email: *azampani@auth.gr
Received May 6, 2012; revised June 22, 2012; accepted July 4, 2012
Keywords: Fluidised Bed Gasification; Biomass; Olive Kernel; Simulation; Aspen Plus
ABSTRACT
The main aim of this study is to develop a comprehensive process model for biomass gasification in a pilot scale bubbling fluidized bed gasifier using the ASPEN PLUS simulator. A drawback in using ASPEN PLUS is the lack of a library model to simulate fluidized bed unit operation. However, it is possible for users to input their own models, using FORTRAN codes nested within the ASPEN PLUS input file, to simulate operation of a fluidized bed. The products of homogeneous reactions are defined by Gibbs equilibrium and reaction rate kinetics are used to determine the products of char gasification. Governing hydrodynamic equations for a bubbling bed and kinetic expressions for the char combustion were adopted from the literature. Different sets of gasification results for the operation conditions (temperature and air equivalence ratio (ER)) obtained from the our pilot-scale gasifier having a capacity of 1 kg/hr of olive kernel as feeding biomass, were used to demonstrate the validation of the model. The simulation results received from the application of the model were compared with the above experimental results and showed good agreement.
1. Introduction
The traditional approach necessary to establish comercial plant technology is based on comprehensive experimental investigations, progressing from a laboratory scale test unit to a pilot scale plant, before building a full-scale commercial demonstration plant. For process optimisation, an extensive investigation of the plant behaviour depending on various operating parameters is required for each scale up step. To support this optimisation procedure, mathematical models are helpful to reduce the temporal and financial efforts.
Pre-condition is a reliable simulation tool, which includes the mathematical formulation of all important chemical and physical processes by describing their dependency on operating parameters and their interdependencies [1]. However, only limited research has been performed to model those complex systems including also the hydrodynamics of biomass particles.
The development of numerical models for fluidizedbed gasification (FBG) documented in the literature [2] are devoted mainly to coal and less to biomass. Even though, biomass in comparison to coal is made up not only of lignin but also of cellulose and hemi cellulose, each one having its own thermal behaviour and making the modelling more difficult, the modelling approaches used for coal can serve for biomass gasification modelling as well. Ma et al. [3] developed a steady-state model which involved instantaneous devolatilization of coal at the top of the gasifier (freeboard region) and char combustion and gasification in the fluidized bed. Chejne and Hernandez [4] developed a comprehensive mathematical model to predict the behaviour of coal combustion and gasification on stacks in non-stationary operation. Sett and Bhattacharya [5] developed a mathematical model for the behaviour of a fluidised-bed charcoal gasifier, taking into account fluidised-bed hydrodynamic conditions, chemical reaction rates, mass diffusion rates, and the conservation of mass and energy. The model was solved numerically using an IBM 3083 mainframe computer. Ross et al. [6] modified their one-dimensional numerical isothermal model of a fluidised-bed coal gasifier in order to simulate the performance of a laboratory-scale gasifier.
A new numerical model based on the two-fluid model (TFM) including the kinetic theory of granular flow (KTGF) and complicated reactions has been developed to simulate coal gasification in a bubbling fluidized bed gasifier (BFBG) [7]. The collision between particles was described by KTGF. The coal gasification rates were determined by combining Arrhenius rate and diffusion rate for heterogeneous reactions or turbulent mixing rate for homogeneous reactions. The flow behaviours of gas and solid phases in the bed and freeboard could be predicted, which were not easy to be measured through the experiments. Hamel and Krumm [2] have developed a mathematical model for simulation of gasification processes of solid fuels in atmospheric or pressurised bubbling fluidised beds incorporating bed and freeboard hydrodynamics, fuel drying and devolatilization, and chemical reaction kinetics is presented. The model has been used to simulate four bubbling fluidised bed gasifiers, described in literature, of different scales from atmospheric laboratory scale up to pressurised commercial scale, processing brown coal, peat and sawdust. The gasifiers have been operated within a wide range of parameters using air, air steam or oxygen steam as gasification agent, operating with or without recirculation of fines at operating pressures up to 2.5 MPa. The simulation results for overall carbon conversion, temperature and concentrations of gaseous species agreed sufficiently well with published experimental data.
Corella and Sanz [8,9], at the University of Zaragoza and Madrid (Spain) started to study the modelling of fluidized bed biomass gasifiers in the mid-1980s. More recently Corella et al. [10], discussed the reaction network existing in a CFB biomass gasifier and the problems associated with the accuracy of the kinetic equations needed for the existing complex reaction network. Furthermore, he presented a model for bubbling fluidized bed (BFB) biomass gasifiers, gasifying with pure steam [10]. That model identified the four main, for modelling purposes, chemical reactions among the reaction network existing in the gasification process. With only four kinetic parameters, the model predicted quite well the BFB gasifier. More recently, Corella and Sanz [8,9] have presented a whole model for CFBBGs. Such model is 1-dimensional for steady state. The model has a semi rigorous character because of the assumptions that had to be introduced by lack of accurate knowledge of some parts of the modelling.
De Souza-Santos [11] developed a comprehensive mathematical model and commercially available computer program performing a comprehensive simulation of fluidized-bed equipment (CSFB Version 3.5), to use as a tool for engineering design and operation optimisation, by predicting the behaviour of a real unit during steadystate operation. His model is regarded as complete and it includes the conservation equations for the emulsion phase and bubbles, empirical equations for hydrodynamics, and it is also includes a through mass balance which considers that both drying and volatilisation are not instantaneous. Jiang and Morey [12] developed one-dimensional, steady state, numerical model for a fluidized bed biomass gasifier. The gasifier model consisted of a fuel pyrolysis model, an oxidation model, a gasification model and a freeboard model which were validated with experimental results.
Haggerty and Pulsifer [13] used the reaction model together with three different reactor models (a) plug-flow, (b) complete-mixing and (c) bubble-assemblage, where the bubble-assemblage model represents a valid alternative when modelling fluidized-bed gasifiers. Marias et al. [14] developed a mathematical model for the fluidizedbed incineration process using the waste composed of wood, cardboard and polyvinyl chloride. Aarsen’s model treated an isothermal fluidized bed as two separate zones, the oxidation zone at the bottom and the gasification zone at the top [15]. Fuel pyrolysis took place at such a fast rate that only pyrolysis yields, which were assumed to vary with bed temperature, were needed. Mukosei et al. [16] examined the problem of the mathematical simulation of heterogeneous processes in a fluidized-bed reactor. These works and other more recent ones such as the work by He and Rudolph [17] proposed a new approach to the modelling of gross gas-solids flow through the riser in a circulating fluidized-bed system. This approach differs from the previous ones, which are found to be theoretically incorrect based on a fundamental analysis of the riser process hydrodynamics.
Panopoulos et al. [18] used the simple way of approaching the biomass gasification modelling by predicting thermodynamic equilibrium composition through Gibbs free energy minimisation calculations for the C, H, and O atoms of the fuel and the gasification agent mixture. Samuilov et al. [19] developed a mathematical model for the gasification in carbon dioxide of a single carbon particle. The porous structure of the particle, diffusion processes, the gasification processes on the pore surface according to the Langmuir-Hinshelwood model, and reactions on active carbon sites were taken into account. Deen et al. [20] reviewed the use of discrete particle models (DPMs) for the study of the flow phenomena prevailing in fluidized beds.
The ASPEN PLUS process simulator has been used by different investigators to simulate coal conversion; examples include methanol synthesis [21,22], indirect coal liquefaction processes [23], integrated coal gasification combined cycle (IGCC) power plants [24], atmospheric fluidized bed combustor processes [25], compartmented fluidized bed coal gasifiers [26], coal hydrogasification processes [27], and coal gasification simulation [28]. However, the work that has been done on biomass gasification is limited. Mansaray et al. [29] used ASPEN PLUS to simulate rice husk gasification based on material balance, energy balance, and chemical equilibrium relations. Because of the high amount of volatile material in biomass and the complexity of biomass reaction rate kinetics in fluidized beds, they ignored the char gasification and simulated the gasification process by the assumption that biomass gasification follows Gibbs equilibrium. In a typical atmospheric fluidized bed gasifier, feed, together with bed material, are fluidized by the gasifying agents, such as air and/or steam, entering at the bottom of the bed. The product gas resulting from the gasification process is fed to a gas-solid separator (i.e., cyclone) to separate solid particles carried by exhaust gas.
2. Modelling Approach
Mathematical modelling is an alternative means to study fluidisation and fluidised bed biomass gasification. Modelling can not only account for the fundamental hydrodynamic behaviour of fluidisation and the coal gasification process, but also serve as a predictive tool to assist with the design, optimisation and scale-up of fluidised bed gasifiers. Therefore, in recent years mathematical modelling of fluidised beds has increasingly attracted more attention.
2.1. Assumptions
The following assumptions were considered in modelling the gasification process:
● Process is steady state and isothermal.
● Biomass devolatilization takes place instantaneously and volatile products mainly consist of H2, CO, CO2, CH4, and H2O.
● All the gases are uniformly distributed within the emulsion phase.
● Particles are spherical and of uniform size and the average diameter remains constant during the gasification ,based on the shrinking core model
● Char only contains carbon and ash.
● Reactions of N and S have not been taken account
● The reactions reached chemical equilibrium
2.2. Reactions
2.2.1. Combustion Zone
The combustible substance of a solid fuel is usually composed of elements carbon, hydrogen and oxygen. In complete combustion carbon dioxide is obtained from carbon in fuel and water is obtained from the hydrogen, usually as steam. The combustion reaction is exothermic and yields a theoretical oxidation temperature of 1450˚C. The main reactions, therefore, are:
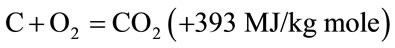 (1)
(1)
 (2)
(2)
2.2.2. Reduction Zone
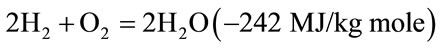
The products of partial combustion (water, carbon dioxide and uncombusted partially cracked pyrolysis products) now pass through a red-hot charcoal bed where the following reduction reactions take place.
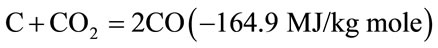 (3)
(3)
 (4)
(4)
 (5)
(5)
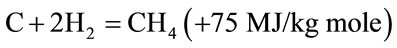 (6)
(6)
 (7)
(7)
Reactions (3) and (4) are main reduction reactions and being endothermic have the capability of reducing gas temperature. Consequently the temperatures in the reduction zone are normally 800˚C - 1000˚C. Lower the reduction zone temperature (~ 700˚C - 800˚C), lower is the calorific value of gas.
2.2.3. Pyrolysis Zone
Wood pyrolysis is an intricate process that is still not completely understood 14. The products depend upon temperature, pressure, residence time and heat losses. However following general remarks can be made about them. Up to the temperature of 200˚C only water is driven off. Between 200˚C to 280˚C carbon dioxide, acetic acid and water are given off. The real pyrolysis, which takes place between 280˚C to 500˚C, produces large quantities of tar and gases containing carbon dioxide. Besides light tars, some methyl alcohol is also formed. Between 500˚C to 700˚C the gas production is small and contains hydrogen. Thus it is easy to see that updraft gasifier will produce much more tar than downdraft one. In downdraft gasifier the tars have to go through combustion and reduction zone and are partially broken down.
2.3. Hydrodynamic Parameters
The following assumptions were made in simulating the hydrodynamics:
● Fluidized bed reactors divided into two regions bed and freeboard
● The fluidization state in the bed is maintained in the bubbling regime
● The volume fraction of solids decreases as height increases, corresponding to the coalescence of bubbles in the bed and the returning of solid particles to the bed in the TDH zone
● Volumetric flow rate of gas increases along with height, corresponding to the production of gaseous products
● The mixing of solid particles, consisting of ash, char particles, and bed material, is perfect
● The reactor is divided into a finite number of equal elements with constant hydrodynamic parameters
● The fluidized bed is one-dimensional; any variations in conditions are considered to occur only in the axial direction.
2.4. Global Model of Fluidized Bed Gasifier
The proposed gasification dynamic model represents two stages: instantaneous devolatilization of straw and combustion of the char at the bottom of the gasifier and the gasification in the fluidized bed. Thus, a two-phase representation of the fluidized bed incorporates the phenomena of jetting, bubbling, slugging and dynamic mass and energy balances. Figure 1 shows the fluidized bed domain divided into three regions: jet, bubbles and slugs. The following assumptions were made regarding to the gas low divisions and the low patterns of gas and solids:
1) the fluidized bed consists of a dilute phase (jets, bubbles and = or slugs) and an emulsion phase2) the emulsion phase is divided into an interstitial gas phase and a solid phase 3) mass and heat exchange take place between the dilute phase and interstitial gas and between the interstitial gas and the solids4) the fluidizing gas enters the bed through nozzles in a jet form. The jets degenerate into bubbles, which rise through the bed and grow by coalescence with other bubbles to form slugs5) slugging occurs if the bubble diameter becomes larger than one third of the reactor diameter, (Slugging occurs in improper fluidization 6) the dilute gas and the interstitial gas are in plug low and the dilute gas is free of solids7) the gas behaves ideally, and 8) the produced gas consist of CO, CO2, H2, H2O, CH4 and N2.
2.5. Mass and Energy Balances
The olive kernel feed flow is calculated by the following equation [30]:
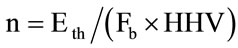 (8)
(8)
For the calculation of the air that is demanded for the stoichiometric combustion of biomass is used [30]:
 (9)
(9)
where the coefficients a, b, c, d represent the molecular fractions H/C, O/C, N/C and S/C . Therefore we can calculate the air flow for several values of equivalence ratio (ER) according to previous equation [30]
With the assumption that gasification char is consisted of fixed carbon and ash, is calculated the solid mass flow from the equation [30]:
 (10)
(10)
Then the overall mass balance is formed for the gasification reactor and the mass flow for the gas gasification is estimated as following [30]:
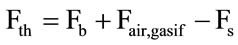 (11)
(11)

Figure 1. The fluidized bed gasifier zones.
Correspondingly the overall energy balance is described as below [30]:
 (12)
(12)
Es represents the thermal content of biomass feed flow which is estimated from the following equation [30]:
 (13)
(13)
For the air it is assumed that enters the reactor at environmental temperature, so its enthalpy content is considered zero (Eair, gasif = 0) .
Eth represents the thermal energy and the enthalpy of gas product and it is given by the following equation [30]:
 (14)
(14)
where
 (15)
(15)
The following equation estimates the enthalpy of each component of gas gasification in gasification temperature
 (16)
(16)
Finally Eloss represents the energy losses from the system due to ash and char removal and the losses to environment from the walls of the gasifier. Therefore:
 (17)
(17)
It is assumed that the energy losses from the gasifier walls constitute the 10% of the overall losses. The energy losses due to char gasification removal is calculated as below [30]:
 (18)
(18)
2.6. Air Equivalence Ratio
Equivalence ratio (ER) constitutes a significant factor of biomass gasification. The wise choice of it discourages the propulsion of the oxidation reactions. It is defined by the following equation [31]:
 (19)
(19)
Aπ represents the mass ratio between air and biomass that has been used in laboratory and Aθ represents the stoichiometrically demanded mass ratio of air for the total combustion of the same quantity of biomass.
The alteration of air flow effects the process since it leads it to the two terminal situations:
1) High air equivalence ratio (ER > 1) approaches the process of combustion giving as gasification product mainly CO2
2) Low air equivalence ratio (ER < 0.25) benefits the process of pyrolysis giving primarily as product syngas (CO + H2).
2.7. Producer Gas LHV
Temperature and ER also significantly affect the heating value of producer gas. Main research target is the production of a producer gas enriched in CO, H2, and CH4. The presence of these combustible species contributes to the production of a medium to high heating value gas, suitable for further exploitation in internal combustion engines (ICE) and turbines for power production. LHV calculation was made using the following equation [32]:
 (20)
(20)
where, CO, H2 and CH4 are the molar ratios of the species in the producer gas as measured in our gasification experiments.
3. Experimental
3.1. Biomass Characteristics
In the laboratory olive kernel was used as biomass feeding and its characteristics are illustrated in the Table 1. Olive kernel is the final solid residue emerging from olive oil production industries. Olives are processed in an oil extracting plant to recover the oil content. After a first residue drying, residual oil is hexane extracted generating a residual solid product with a moisture content of around 10 - 12 wt% called olive kernel. Traditionally, such kind of residue is sold as fuel for combustion in small boilers and specially designed furnaces due to its significant calorific value (HHV ~21 MJ/kg).
Nowadays, there are several boilers fuelled with olive kernels destined for residential and greenhouse heating or in some cases to generate steam for electricity production in conventional steam turbines. However, a more efficient and environmentally friendly alternative with respect to CO2 and CH4 mitigation to the atmosphere, is olive kernel gasification; aim is to produce a high calorific value gas to fuel a gas engine or even a gas turbine in a combined cycle of heat/power production.
3.2. Gasifier Characteristics
3.2.1. The Bench Scale FBG Unit
A 5 kWth, bench scale, bubbling fluidized bed gasifier (FBG) was designed and manufactured for biogenic material gasification. It is an atmospheric air blown FBG unit that consists of four sections: 1) the biomass feeding section, 2) the air supply, control and preheating section, 3) the gasification facility, 4) the gas sampling and off line analysis section.
Producer gas was sampled using airtight gas sampling bags and analyzed with a GC system for quantitative determination of CO, CO2, H2, CH4, C2H4 and C2H6.
3.2.2. The Olive Kernel Feeding Section
The FBG unit is equipped with a feeding hopper suitable for feeding of low density biomass. Feeding takes place through a system of a constant speed screw feeder and a variable speed screw feeder (motorized via inverter), separated by a rotary valve in order to avoid the hot gas backflow that could pyrolyse olive kernels and cause serious tar fouling problems. Additionally, a small proportion of fluidization air (~1 l/min) is supplied for backflow prevention. The motorized screw feeder is able to control the biomass feeding, based on a series of calibration curves and the maximum mass flow rate of olive kernel could reach 120 g/min. Olive kernel pass through the metal to metal rotary valve and is introduced into the reactor by the second screw feeder, into the hot zone of the reactor, 120 mm above the air distributor.
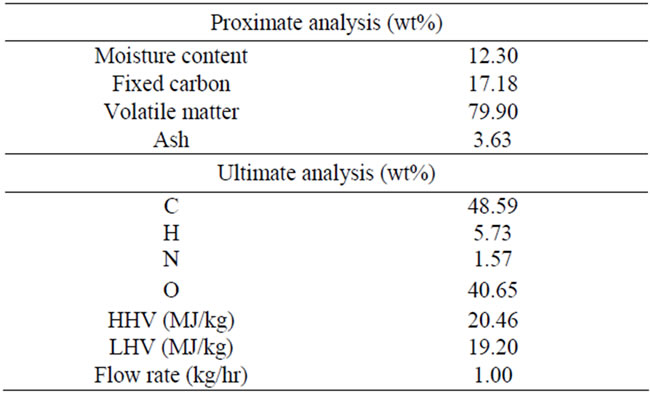
Table 1. Olive kernel characteristics.
3.2.3. The Air Supply, Control and Preheating Section
Laboratory’s air supply unit provides the FBG unit with the primary and secondary air, necessary for the fluidization and gasification process, always in hypo-stoichiometric amounts obtaining the desired ER ratio. It consists of a central compressor, a main valve to control the air flow rate and an air flowmeter with maximum flow capacity of 200 l/min. The primary air for gasification process is introduced from the bottom of the FBG and a uniformly perforated plate (151 holes of 1mm diameter) is used in order to retain bed fluidization. Primary air is preheated up to 350˚C, by passing through a stainless steel tube that is kept in touch with the hot zone of the reactor inside the furnace. In the beginning of each operation, while the reactor is still cold, air preheating is obtained via an electric resistance placed at the bottom of the FBG. Secondary air contributes in producer gas temperature increase, which results in further tar cracking improving carbon conversion efficiency.
3.2.4. The 5 kWth FBG Test Unit
Figure 2 shows the bench scale FBG reactor with nominal capacity of 5 kWth. Bed and freeboard sections are made of stainless steel with diameters of 60 mm and 90 mm respectively; the total reactor height is 1400 mm. A more detailed analysis about the reactor design and construction can be found in a previous published work [33]. FBG design enables the easy dismantling and thorough cleaning, in order to avoid not only memory effects, but also possible tar fouling under the hot flow experimental conditions. The gas cleaning system consists of a cyclone of 10 μm cut point. Limited experimental work has done using high temperature ceramic filters and various types of metallic foam for particulate abatement and tar elimination.
3.2.5. Bed Material
The bed material is of great importance in a fluidised bed reactor as it plays a dual role acting as heat transfer medium and, if it is not an inert material, as an internal catalyst for extended tar cracking.
A major problem of gasification applicability is tar formation and its minimisation is seen as one of the greatest technical challenges to overcome for the successful development of commercially attractive gasification technologies. According to the literature, tar production in an air steam gasification process could be as low as ~20 g/Nm3 [31].
Tar treatment technologies are categorised either as upstream, when the tar problem is tackled inside the gasifier (named also primary or internal methods) or downstream, when tar is cleaned in separate hot gas devices (named also secondary or external methods). Although the secondary methods are proven to be effective and fully controlled, primary treatment technologies are gaining more interest due to their economic benefits. In primary methods operating parameters such as temperature, gasifying agent, bed material, equivalence ratio and residence time can play an important role on the formation and decomposition of tars. Cao et al. [31] concluded that the utilization of some catalysts in the gasifier and the concepts of two stage gasification are of prime importance. They worked on a laboratory scale, two-region, combined fluidised bed reactor for air gasification of sawdust producing a H2 rich gas, with an LHV of 5 MJ/Nm3 and tar concentration below 10 mg/Nm3.
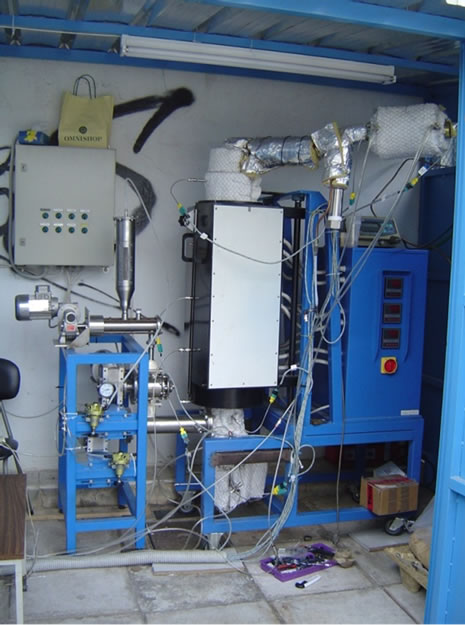
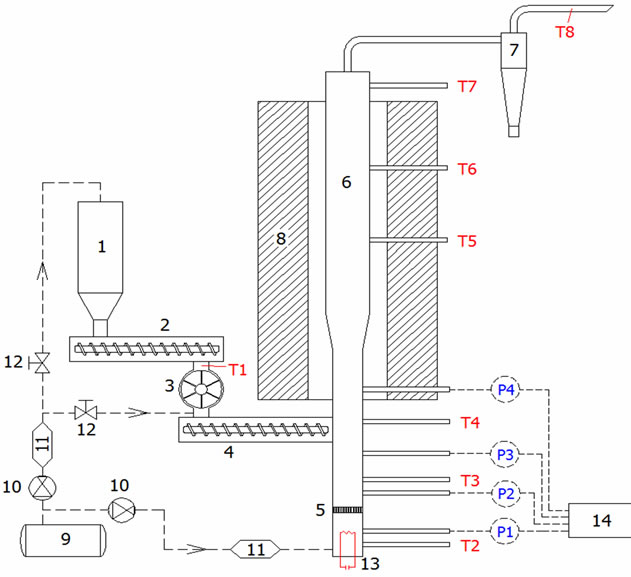
Figure 2. The 5 kWth, bench scale FBG unit, 1-biomass hopper; 2-screw feeder (inverter); 3-rotary valve; 4-screw feeder; 5-air distributor; 6-fluidized bed reactor; 7-cyclone; 8- electric furnace; 9-air compressor; 10-pressure regulator; 11-air flow meter; 12-isolation valve; 13-electrical heater; 14-differential pressure transmitter; P1 to P4 pressure measurement; T1 to T8 temperature measurement.
It is stated that several in-gasifier materials have catalytic action and eliminate in-bed tar by activating reforming reactions. Such materials modify the kinetic constants of most catalytic reactions involved in gasification. The in-bed additives are classified into two categories: 1) laboratory scale catalysts, which are very active but expensive; those catalysts are deactivated by coking when used at high (above 1000 kg/hm2 cross sectional area) biomass throughputs (realistic for commercial applications), 2) natural occurring solids such as dolomite, limestone, olivine, high iron-content solids, which have been proved to have only a relatively small tar-elimination activity.
Nordgreen et al. [34] used metallic iron and iron oxides to catalytically crack tars in a secondary reactor, downstream the atmospheric fluidized bed gasifier fuelled with Swedish birch. They worked at a temperature range of 700˚C - 900˚C and low equivalence ratio almost near to pyrolysis conditions (0 < ER < 0.2), concluding that catalytic breakdown of the tar reached 100%.
The first set of experiments was carried out with quartz sand (Table 2) as bed material, in the size range: 500 - 425 μm. Although quartz sand was an easy and cheap to find material, it caused severe defluidization due to inevitable agglomeration and tar formation tendency at relatively low gasification temperature (T < 800˚C). Thus, and taking into account that an iron containing bed material might act as a catalyst for tar destruction, quartz sand was replaced with olivine (Table 2). A 500 - 425 μm size fraction of olivine was also used and it was found to be durable for a prolongued operating period and in temperature range 800˚C - 950˚C.
3.2.6. Producer Gas Sampling and Analysis
The sampling line is kept at a constant temperature of ~300˚C in order to avoid tar condensation and sampling line fouling. Tar condensation and particle removal takes place in the gas cleaning section (Figure 3) consisting of a water washing, moisture trap, impinger bottles with isopropanole, a fiber filter and a silica gel filter.
When the appropriate gasification conditions are achieved producer gas is sampled, using a membrane pump and airtight gas sampling bags and analyzed in laboratory’s GC system (Model 6890N, Agilent Technologies equipped with FID and TCD detectors connected in series). The Gas Chromatograph is fitted with two columns HP-Plot Q with helium as carrier gas. GC’s temperature profile was an isothermal at 50˚C and the retention time of the analysis process was 38 min. The standard gas mixture used.
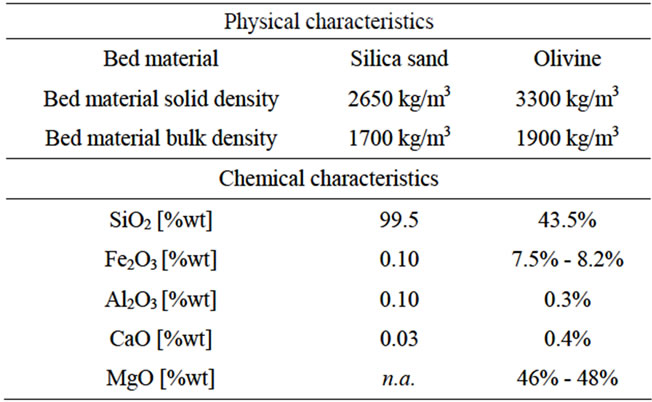
Table 2. Comparison of physicochemical characteristics of commercial quartz sand and olivine.
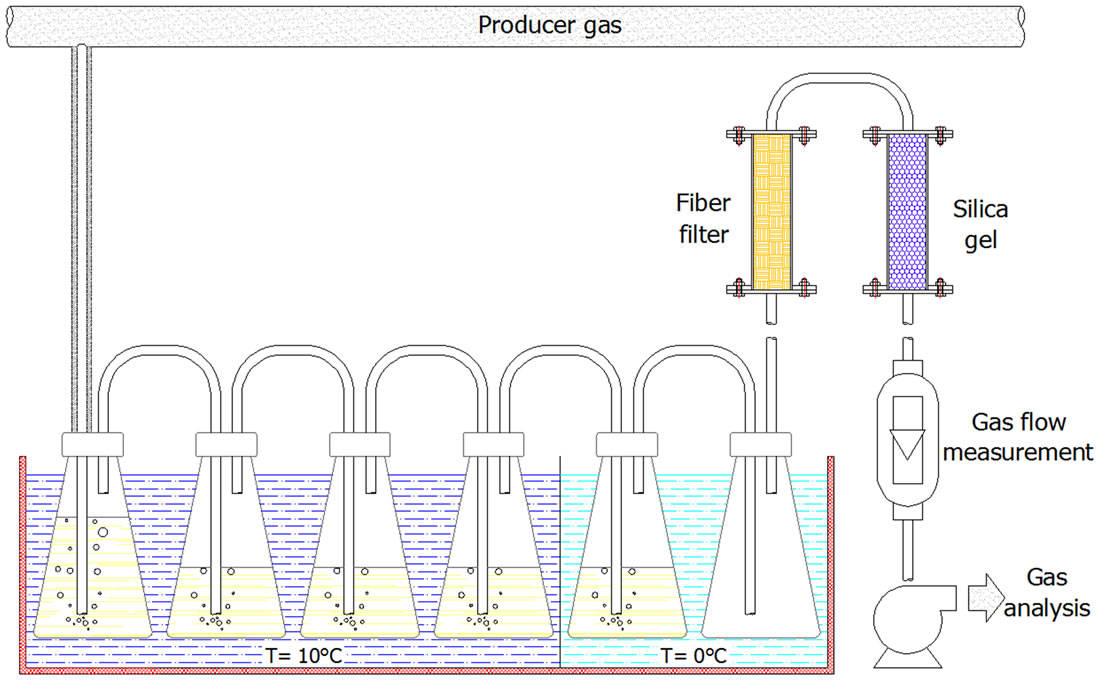
Figure 3. Producer gas sampling section.
GC calibration composed from CO, CO2, H2, CH4, C2H4 and C2H6 1 vv% of each one of the above components balanced in helium.
4. Simulation with ASPEN Plus
4.1. Simulation Software
ASPEN Plus was selected for modelling the gasifier. It is a steady state chemical process simulator, which was developed to evaluate synthetic fuel technologies. It uses unit operation blocks, which are models of specific process operations (reactors heaters, pumps etc.). The user places these blocks on a flowsheet, specifying material and energy streams. An extensive built in physical properties database is used for the simulation calculations. ASPEN Plus has the capability to incorporate Fortran code into the model. This feature is utilised for the definition of non-conventional fuels, e.g. biomass, specific coals and for ensuring the system operates within user defined limits and constraints. The development of a model in ASPEN Plus involves the following steps:
1) Stream class specification and property method selection.
2) System component specification (from databank).
3) Defining the process flowsheet (unit operation blocks and connecting material and energy streams).
4) Specifying feed streams (flow rate, composition, and thermodynamic condition).
5) Specifying unit operation blocks (thermodynamic condition, chemical reactions etc.).
4.2. Flow Sheet Development
ASPEN PLUS blocks that have been used in order to simulate the gasification process are described in Table 3. Figure 4 shows the flowsheet for the gasification process.
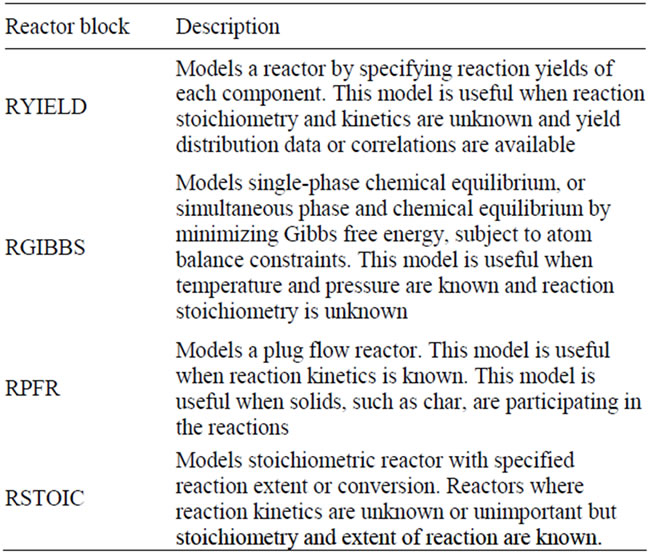
Table 3. Reactor blocks description utilized in the simulation.
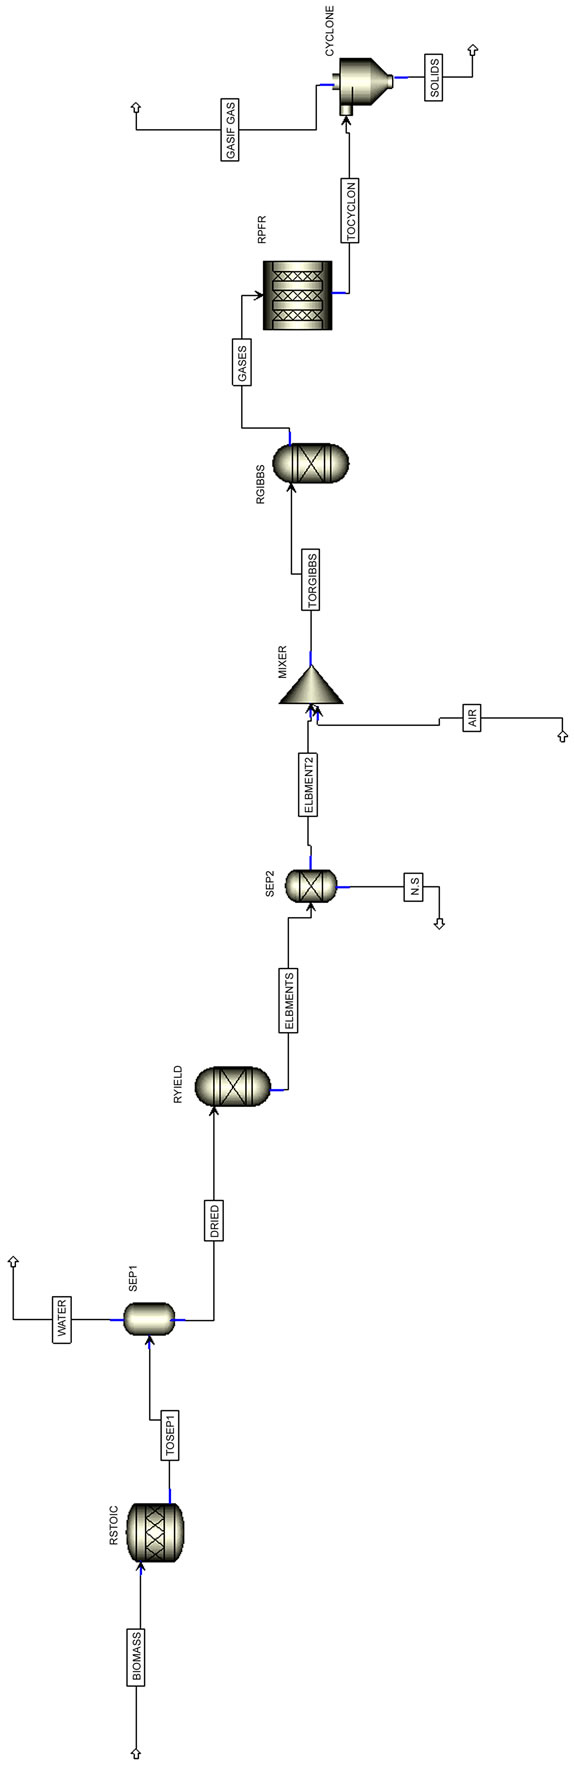
Figure 4. Comprehensive simulation diagram for the fluidized bed gasification process.
4.2.1. Drying
The ASPEN PLUS stoichiometric reactor, RSTOIC, was used to simulate the process of biomass drying. In this step biomass is separated from moisture. A SEPARATION COLUMN model was used before the RYIELD reactor to separate the moisture from dried biomass. Within the ASPEN PLUS environment, the separation column is the most appropriate unit operation to achieve this goal. The amount of volatile material can be specified from the biomass approximate analysis.
4.2.2. Biomass Decomposition
The ASPEN PLUS yield reactor, RYIELD, was used to simulate the decomposition of the feed. In this step, biomass is converted into its constituting components including carbon, hydrogen, oxygen, sulfur, nitrogen, and ash, by specifying the yield distribution according to the biomass ultimate analysis.
4.2.3. Volatile Reactions
The ASPEN PLUS Gibbs reactor, RGIBBS, was used for volatile combustion, in conformity with the assumption that volatile reactions follow the Gibbs equilibrium. Biomass consists of mainly C, H, N, O, S, and ash. Carbon will partly constitute the gas phase, which takes part in devolatilization, and the remaining carbon comprises part of the solid phase (char) and subsequently results in char gasification. A COMPONENT SEPARATOR model was used before the RGIBBS reactor to separate S and N within the ASPEN PLUS environment, the component separator is the most appropriate unit operation to achieve this goal. The amount of volatile material can be specified from the biomass approximate analysis. The MIXER block was used before RGIBBS so as to add air to gas mixture.
4.2.4. Char Gasification
The ASPEN PLUS PFR reactor, RPFR, performs char gasification by including gasification reactions and chemical kinetics, as mentioned previously. The hydrodynamic and kinetic parameters, such as superficial velocity and voidage are constant in these reactors. Also considering the assumption that char contains only carbon and ash, the amount of carbon in the volatile portion can be calculated by deducting the total amount of carbon in char from the total carbon in biomass.
4.2.5. Solid Separation
A CYCLONE SEPARATOR block was used in this model in order to distinguish carbon solid from the gas mixture that it is received as final product. A CYCLONE SEPARATOR block in ASPEN PLUS environment separates solids from gas using gas vortex in a cyclone and it is used for rating and sizing cyclones.
5. Results
5.1. Model Validation
In order to validate the simulation results, experimental data from gasification of olive kernel in a pilot-scale fluidized bed gasifier was used. Biomass produces more tar and unburned hydrocarbon in lower temperatures, which decreases hydrogen production. The error related to the prediction of hydrogen is the result of ignoring tar production in the simulation.
A model was developed for the gasification of biomass in a bubbling fluidized bed gasifier using the ASPEN PLUS simulator. To provide the model, several ASPEN PLUS unit operation blocks were combined and, where necessary, kinetic expressions and hydrodynamic models were developed using data and models from the literature. The model was used to predict the results of pilot-scale gasification of olive kernel with air. The simulation results for the product gas composition versus temperature and air equivalence ratio were compared with experimental results.
Sensitivity analysis is performed to monitor the dependence of different parameters on the composition of the produced gas from the reactor. In this work, the temperature and air equivalence ratio (ER) are analysed in order to evaluate their effects on the composition of the produced gas and on the LHV of gasification gas. The optimum operating conditions according to simulation results is ER = 0.2 and T = 750˚C. During the sensitivity analysis the model input data was kept the same as for model validation with one parameter being varied at any given time Simulation results were compared with all sets of experimental data. The analysis of data for product gases in the optimum conditions is shown in Tables 4 and 5. Carbon monoxide and methane show the highest and lowest error, respectively, in all sets of experiments.
5.1.1. Effect of Temperature
Figures 5-10 show the simulation results compared with experimental data for product gas composition versus three different temperatures in the range of 750˚C - 9850˚C.
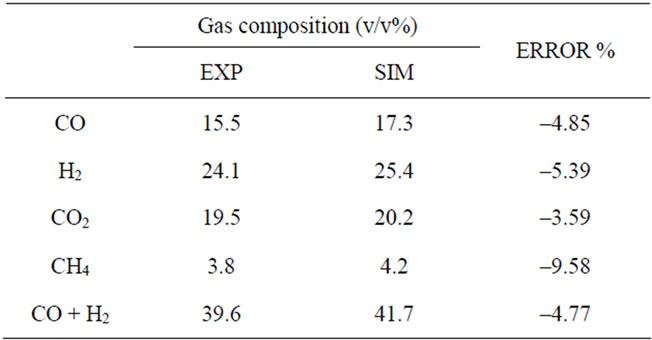
Table 4. Analysis of data (gasification gas composition).
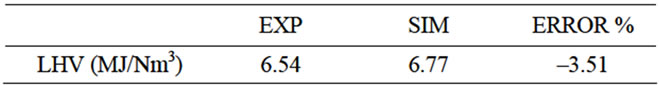
Table 5. Analysis of data (LHV).

Figure 5. Effect of temperature on CO (ER = 0.2).

Figure 6. Effect of temperature on Η2 (ER = 0.2).

Figure 7. Effect of temperature on CO2 (ER = 0.2).
5.1.2. Effect of Air Equivalence Ratio
Simulation results and experimental data for gas composition versus three different air equivalence ratios in the range of 0.2 - 0.4 are shown in Figures 11-16.

Figure 8. Effect of temperature on CH4 (ER = 0.2).
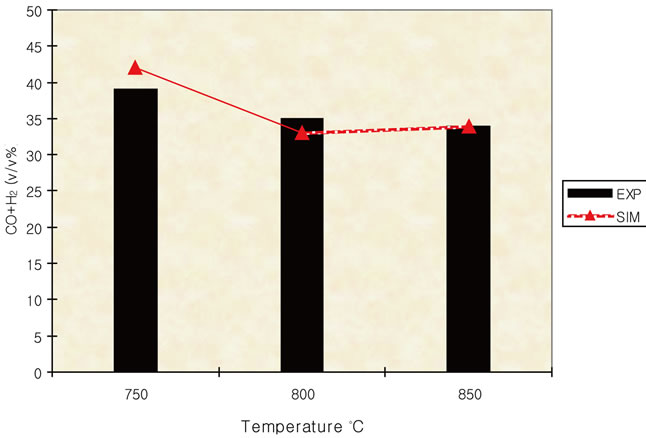
Figure 9. Effect of temperature on syngas (ER = 0.2).
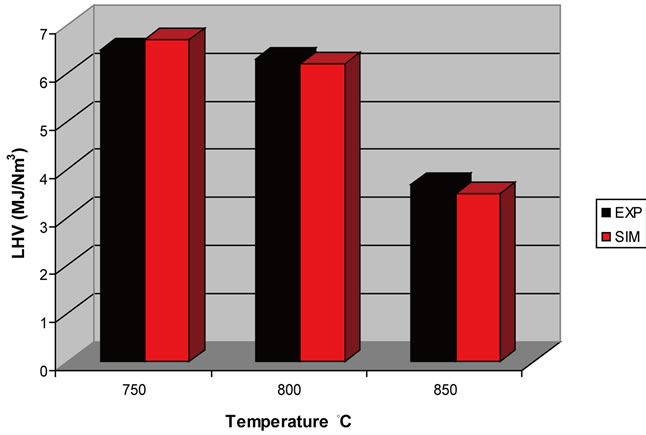
Figure 10. Effect of temperature on LHV (ER = 0.2).
5.2. Modelling Predictions
Since the reliability of proposed model has been proved it can be now used in order to predict gasification gas composition and LHV for several values of temperature and air equivalence ratio.
Figures 17-19 presents model predictions versus temperature and Figures 20-22 the predictions versus air equivalence ratio while Figure 23 shows LHV behaviour versus temperature and air equivalence ratio.
5.3. H2/CO Ratio in Producer Gas
High yields of syngas (H2 and CO) were obtained from olive kernel gasification with air and this behaviour could be attributed to the increased content of cellulose and hemicellulose in the raw material. Such information was known from previous experimentation in a laboratory scale, fixed bed gasification unit [35].

Figure 11. Effect of air equivalence ratio on CO (T = 750˚C).
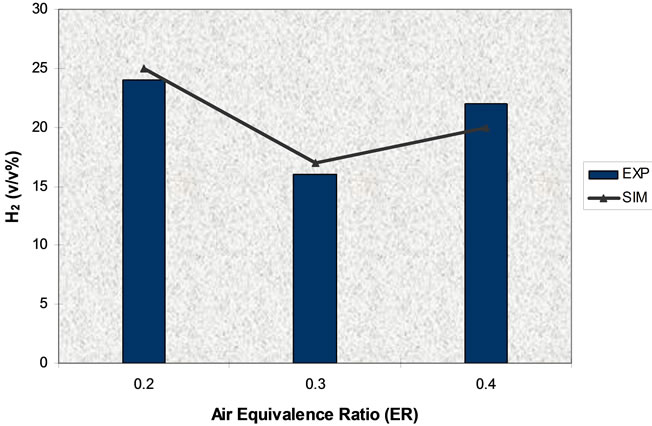
Figure 12. Effect of air equivalence ratio on H2 (T = 750˚C).

Figure 13. Effect of air equivalence ratio on CO2 (T = 750˚C).
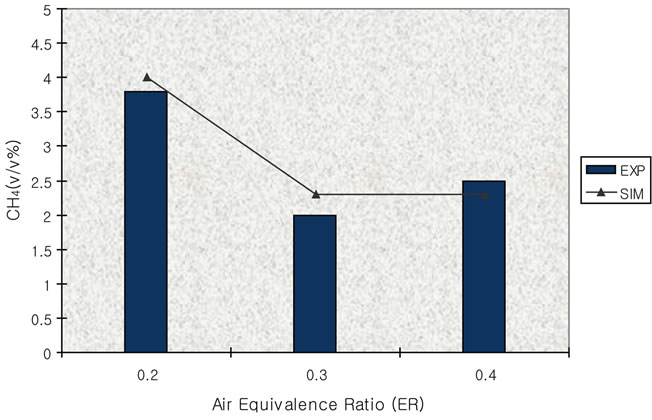
Figure 14. Effect of air equivalence ratio on CH4 (T = 750 ˚C).
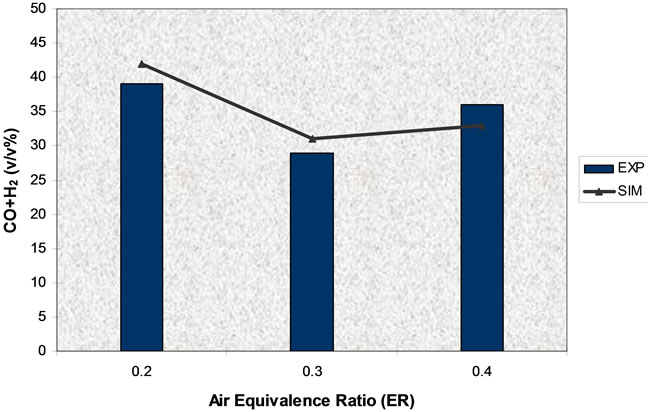
Figure 15. Effect of air equivalence ratio on syngas (T = 750˚C).
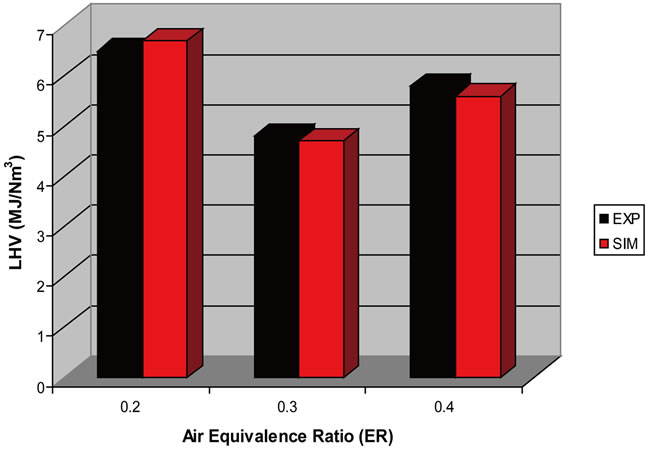
Figure 16. Effect of ER on LHV (T = 750˚C).
Uses of syngas could be distinguished according to the H2/CO molar ratio. Producer gas with H2/CO ratio between 1 to 2 can be used for the production of 2nd generation biofuels via Fischer Tropsch synthesis (H2/CO = 2) and high added value chemical products like methanol. The present study indicates that producer gas of olive kernels gasification at 750˚C and ER = 0.2 with a molar ratio of H2/CO = 1.75 could be useful for Fisher Tropsch
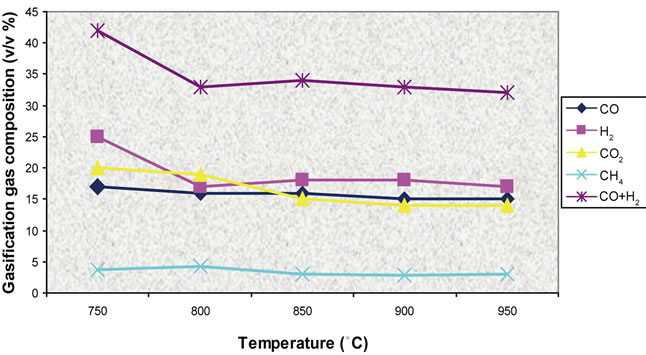
Figure 17. Effect of temperature on gas composition (ER = 0.2).
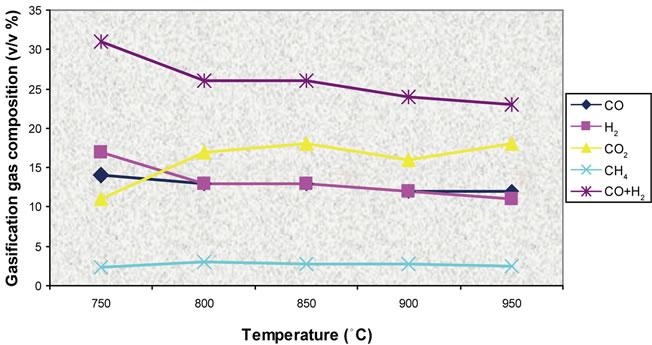
Figure 18. Effect of temperature on gas composition (ER = 0.3).

Figure 19. Effect of temperature on gas composition (ER = 0.4).
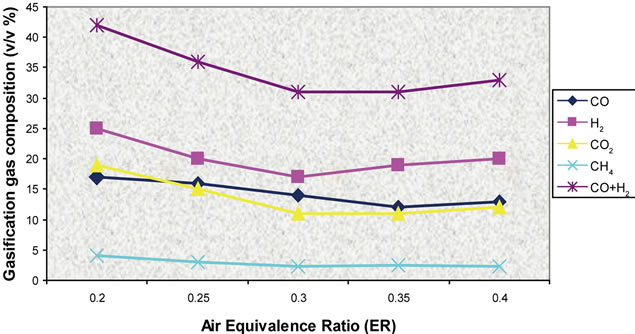
Figure 20. Effect of air ratio on gas composition (T = 750˚C).
synthesis. The effect of temperature on H2/CO molar ratio is presented in Figure 24.
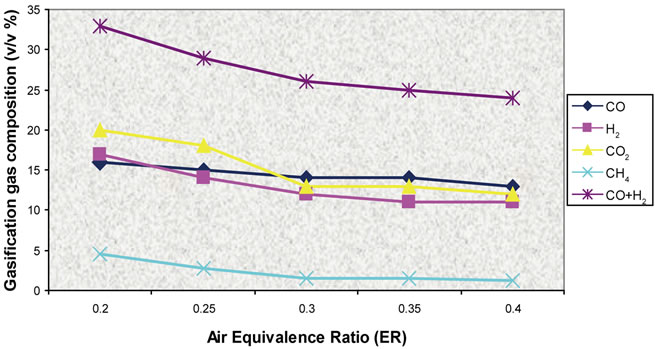
Figure 21. Effect of air ratio on gas composition (T = 800˚C).
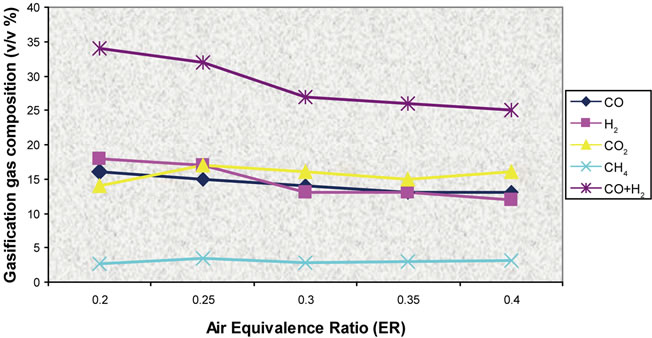
Figure 22. Effect of air ratio on gas composition (T = 850˚C).

Figure 23. Effect of air ratio and temperature on LHV.
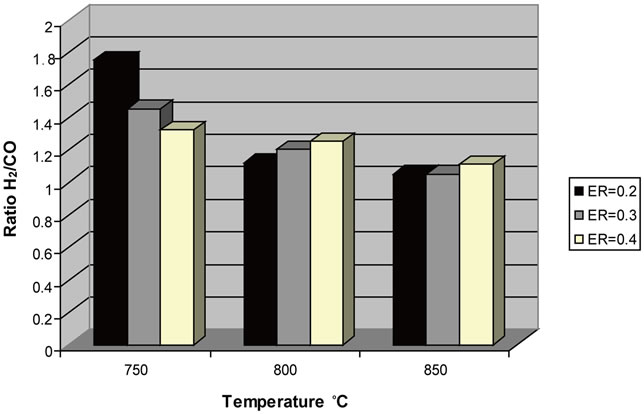
Figure 24. Effect of temperature and ER on H2/CO molar ratio.
6. Conclusions
The objective of this study was to develop simulation capable of predicting the steady-state performance of an atmospheric fluidized bed gasifier by considering the hydrodynamic and reaction rate kinetics simultaneously. The products of homogeneous reactions were defined by Gibbs equilibrium, and reaction rate kinetics were used to determine the products of char gasification.
A BFB biomass gasifier model was developed using ASPEN Plus. The results obtained from the sensitivity analyses are in good agreement with experimental work. Therefore, the model is capable of predicting accurately gasifier performance over a wide range of operating conditions.
The influence of ER and temperature were investigated and the main conclusion is that the optimum operating conditions are ER = 0.2 and temperature 750˚C something that agrees with experimental data. At these conditions the concentration of syngas (CO + H2) in gasification gas was maximized (41.7 v/v%) and LHV took its highest value (6.77 MJ/Nm3).
By increasing the ER the concentrations of CO and H2 were decreasing in the favour of CO2 production. As a result of this the LHV of gasification gas was also decreasing which are in accordance with the experimental results Based on the results obtained in the present study, the following conclusions are drawn:
1) The proposed combined transport and kinetic model is successfully validated with the experimental data reported in the literature.
2) The model predicted composition of producer gas matches very well with the experimental data.
3) The molar fractions of CO and CH4 increase and that of water vapor decreases with time in the pyrolysis zone of the gasifier due to a subsequent increase in the temperature of pyrolysis zone.
4) The molar fraction of water vapor in the gaseous phase is the highest in the pyrolysis zone and decreases as it travels through the oxidation and reduction zones of the gasifier.
5) The molar fractions of CO and CH4 in the gaseous phase increase in the pyrolysis zone as gas travels through it. However, the molar fractions of CO, H2 and CH4 decrease in the oxidation zone due to high temperature oxidation and hence the molar fraction of CO2 increases.
Good qualitative agreement between model prediction and experimental data was achieved. However, to improve the simulation results, some modifications should be considered. Those modifications concern tar formation and mass transfer inside the particles:
1) In this study simulation results of parametric study of temperature and air ratio on gas composition (H2, CO, CO2, and CH4) without considering tar formation were achieved. However, tar formation consideration in the model might improve the predicted results. For this reason, detailed experimental data about the influence of operating conditions on the formation of tar along with the kinetics studies is needed in order to obtain a thorough evaluation.
2) For the future experimental work it is proposed to use the chemical formula CxHyOz as that of tar. The parameters (x, y, z) are temperature and heating rate dependent. Tar production can be taking in account by defining nonequilibrium products in the RGIBBS.
3) Mass transfer inside solid particles is also an important parameter in gas–solid reactions and heat transfer inside particles. Heat transfer is also important between phases, particles. This is another feature that should be included in the model in order to achieve better simulation prediction. Radial dispersion inside the reactor will also help to see wall effects on the hydrodynamics of the fluidized bed reactor.
7. Acknowledgements
The study is funded by EU LIFE PLUS project “SMARtCHP Demonstration of a Small scale Mobile Agricultural Residue gasification unit for decentralized Combined Heat and Power production”: http://smartchp.eng.auth.gr/en.
REFERENCES
- S. Hamel and W. Krumm, “Mathematical Modelling and Simulation of Bubbling Fluidised Bed Gasifiers,” Powder Technology, Vol. 120, No. 1-2, 2001, pp. 105-112. doi:10.1016/S0032-5910(01)00356-4
- S. Hamel and W. Krumm, “Modelling and Simulation of Bubbling Fluidized Bed Gasification Reactors,” Fuel Energy Abstracts, Vol. 43, No. 4, 2002, p. 250. doi:10.1016/S0140-6701(02)86192-6
- R. P. Ma, R. M. Felder and J. K. Ferrell, “Modelling a Pilot-Scale Fluidized Bed Coal Gasification Reactor,” Fuel Processing Technology, Vol. 19, No. 3, 1988, pp. 265-290. doi:10.1016/0378-3820(88)90103-8
- F. Chejne and J. P. Hernandez, “Modelling and Simulation of Coal Gasification Process in Fluidised Bed,” Fuel, Vol. 81, No. 13, 2002, pp. 1687-1702. doi:10.1016/S0016-2361(02)00036-4
- A. Sett and S. C. Bhattacharya, “Mathematical Modelling of a Fluidised-Bed Charcoal Gasifier,” Applied Energy, Vol. 30, No. 3, 1988, pp. 161-186. doi:10.1016/0306-2619(88)90043-8
- D. P. Ross, H. M. Yan and D. K. Zhang, “Modelling of a Laboratory-Scale Bubbling Fluidised-Bed Gasifier with Feeds of Both Char and Propane,” Fuel, Vol. 83, No. 14-15, 2004, pp. 1979-1990. doi:10.1016/j.fuel.2004.04.004
- L. Yu, J. Lu, X. Zhang and S. Zhang, “Numerical Simulation of the Bubbling Fluidized Bed Coal Gasification by the Kinetic Theory of Granular Flow (KTGF),” Fuel, Vol. 86, No. 5-6, 2007, pp. 722-734. doi:10.1016/j.fuel.2006.09.008
- J. Corella and A. Sanz, “Modelling Circulating Fluidized Bed Biomass Gasifiers. A Pseudo-Rigorous Model for Stationary State,” Fuel Processing Technology, Vol. 86, No. 9, 2005, pp. 1021-1053. doi:10.1016/j.fuproc.2004.11.013
- A. Sanz and J. Corella, “Modelling Circulating Fluidized Bed Biomass Gasifiers. Results from a Pseudo-Rigorous 1-Dimensional Model for Stationary State,” Fuel Processing Technology, Vol. 87, No. 3, 2006, pp. 247-258. doi:10.1016/j.fuproc.2005.08.003
- J. Corella, J. Herguido, J. M. Toledo and J. I. Gomez-Cı- vicos, “Modeling Fluidized Bed Biomass Gasifiers. Part II: Gasification with Steam in a Bubbling Fluidized Bed,” Proceedings of First World Conference on Biomass for Energy and Industry, Sevilla, Vol. 2, 2001, pp. 1971-1975.
- M. L. De Souza-Santos, “Comprehensive Modelling and Simulation of Fluidized Bed Boilers and Gasifiers,” Fuel, Vol. 68, No. 12, 1989, pp. 1507-1521. doi:10.1016/0016-2361(89)90288-3
- H. Jiang and R. V. Morey, “A Numerical Model of a Fluidized Bed Biomass Gasifier,” Biomass and Bioenergy, Vol. 3, No. 6, 1992, pp. 431-447. doi:10.1016/0961-9534(92)90039-S
- J. F. Haggerty and A. H. Pulsifer, “Modelling Coal Char Gasification in a Fluidized Bed,” Fuel, Vol. 51, No. 4, 1972, pp. 304-307. doi:10.1016/0016-2361(72)90008-7
- F. Marias, J. R. Puiggali and G. Flamant, “Modelling for Simulation of Fluidized Bed Incineration Process,” American Institute of Chemical Engineers Journal, Vol. 47, No. 6, 2001, pp. 1438-1460. doi:10.1002/aic.690470620
- F. G. van den Aarsen, A. A. C. M. Beenackers, W. P. M. van Swaaij, “Modelling of a Fluidized Bed wood Gasifier,” In: K. Ostergaard and A. Serensen, Eds., Fluidization V, Proceedings of the 5th Engineering Foundation, Engineering Foundation, New York, 1986.
- V. I. Mukosei, L. I. Kheifets and R. V. Dzhagatspanyan, “The Mathematical Simulation of a Fluidised-Bed Reactor,” Inzhenerno-Fizicheskii Zhournal, Vol. 12, No. 4, 1967, pp. 508-514.
- Y. He and V. Rudolph, “Gas-Solids Flow in the Riser of a Circulating Fluidized Bed,” Chemical Engineering Science, Vol. 50, No. 21, 1995, pp. 3443-3453. doi:10.1016/0009-2509(95)00170-A
- K. D. Panopoulos, L. E. Fryda, J. Karl, S. Poulou and E. Kakaras, “High Temperature Solid Oxide Fuel Cell Integrated with Novel Allothermal Biomass Gasification Part I: Modelling and Feasibility Study,” Journal of Power Sources, Vol. 159, No. 1, 2006, pp. 570-585. doi:10.1016/j.jpowsour.2005.12.024
- E. V. Samuilov, M. F. Faminskaya and E. S. Golovina, “Model and Calculation of the Gasification of a Single Carbon Particle,” Combustion, Explosion Shock Waves, Vol. 40, No. 1, 2004, pp. 77-84. doi:10.1023/B:CESW.0000013670.94694.38
- N. G. Deen, M. V. S. Annaland, M. A. Van der Hoef and J. A. M. Kuipers, “Review of Discrete Particle Modeling of Fluidized Beds,” Chemical Engineering Science, Vol. 62, No. 1-2, 2007, pp. 28-44. doi:10.1016/j.ces.2006.08.014
- R. A. Kundsen, T. Bailey and L. A. Fabiano, “Experience with ASPEN While Simulating a New Methanol Plant,” In: R. S. H. Mah and G. V. Reklaitis, Eds., Selected topics on computer-aided process design and analysis, American Institute of Chemical Engineers Symposium Series No. 214, 1982.
- K. T. Schwint, “Great Plains ASPEN Model Development, Methanol Synthesis Flowsheet. Final Topical Report,” National Technical Information Service, USA, 1985.
- R. E. Barker, J. M. Begovich, J. H. Clinton and P. J. Johnson, “ASPEN Modelling of the Tristate Indirect Lique Faction Process,” USA Oak Ridge National Laboratory, Oak Ridge, 1983.
- J. N. Phillips, M. R. Erbes and R. H. Eustis, “Study of the Off-Design Performance of Integrated Coal Gasification,” Proceedings Winter annual meeting of the American Society of Mechanical Engineers, Anaheim, 7-12 December 1986.
- P. L. Douglas and B. E. Young, “Modelling and Simulation of an AFBC Steam Heating Plant Using ASPEN/SP,” Fuel, Vol. 70, No. 2, 1990, pp. 145-154. doi:10.1016/0016-2361(91)90145-Z
- H. M. Yan and V. Rudolph, “Modeling a Compartmented Fluidized Bed Coal Gasifier Process Using ASPEN PLUS,” Chemical Engineering Communication, Vol. 183, No. 1, 2000, pp. 1-38. doi:10.1080/00986440008960499
- L. Backham, E. Croiset and P. L. Douglas, “Simulation of a Coal Hydrogasification Process with Integrated CO2 Capture,” Greenhouse Gas Control Technologies 7, Vol. 2, No. 2, 2005, pp. 1941-1945.
- H. G. Lee, K. M. Chung, C. Kim, S. H. Han and H. T. Kim, “Coal Gasification Simulation Using ASPEN PLUS,” US-Korea Joint Workshop on Coal Utilization Technology, Pittsburgh, 1992, pp. 447-474.
- K. G. Mansaray, A. M. Al-Taweel, A. E. Ghaly, F. Hamdullahpur and V. I. Ugursal, “Mathematical Modelling of a Fluidized Bed Rice Husk Gasifier,” Energy Sources, Vol. 22, No. 1, 2000, pp. 83-98. doi:10.1080/00908310050014243
- P. Basu, “Combustion and Gasification in Fluidized Beds,” Taylor Francis, Halifax, 2006.
- Y. Cao, Y. Wang, J. T. Riley and W. P. Pan, “A Novel Biomass Air Gasification Process of Producing Tar-Free Higher Heating Value Fuel Gas,” Fuel Processing Technology, Vol. 87, No. 4, 2006, pp. 343-353. doi:10.1016/j.fuproc.2005.10.003
- P. M. Lv, Z. H. Xiong, J. Chang, C. Z. Wu, Y. Chen and J. X. Zhu, “An Experimental Study on Biomass Air-Steam Gasification in a Fluidized Bed,” Bioresource Technology, Vol. 95, No. 1, 2004, pp. 95-101. doi:10.1016/j.biortech.2004.02.003
- A. Zabaniotou, V. Skoulou, G. Koufodimos and Z. Samaras, “Conceptual Desing and Preliminary Hydrodynamic Study of an Agro Biomass Bench Scale Gasification Fluidized Bed Reactor,” International Journal of Chemical Reactor Engineering, Vol. 6, No. 1, 2008, pp. 1-17. doi:10.2202/1542-6580.1639
- T. Nordgreen, T. Liliedahl and K. Sjöström, “Metallic Iron as a Tar Breakdown Catalyst Related to Atmospheric, Fluidised Bed Gasification of Biomass,” Fuel, Vol. 85, No. 5-6, 2006, pp. 689-694. doi:10.1016/j.fuel.2005.08.026
- P. Ollero, A. Serrera, R. Arjona and S. Alcantarilla, “The CO2 Gasification Kinetics of Olive Residue,” Biomass and Bioenergy, Vol. 24, No. 2, 2003, pp. 151-161. doi:10.1016/S0961-9534(02)00091-0
Nomenclature
Aθ stoichiometrically demanded mass ratio of air for the total combustion of biomass.
Aπ mass ratio between air and biomass that has been used in laboratory
Eair,gasif thermal content and enthalpy of air
Eb thermal content and enthalpy of biomass
Echar thermal content and enthalpy of char
Eloss energy losses
ER air equivalence ratio
Es enthalpy of a component
Eth thermal content and enthalpy of gasification gas
Eu thermal content and of a component
Fair,gasif mass flow of air
Fb mass flow of biomass
Fs mass flow of solids
Fth mass flow of gasification gas
h enthalpy
HHV high heat value
LHV low heat value
MBi molecular weight
mgas mass of a gas
n gasifier efficiency
yi molar fraction of a gas
NOTES
*Corresponding author.