American Journal of Analytical Chemistry
Vol.06 No.04(2015), Article ID:55209,12 pages
10.4236/ajac.2015.64035
TGA-DSC: A Screening Tool for the Evaluation of Hydrocracking Catalyst Performance
Muhammad Salman1*, Shazia Nisar1, Zahid Hussain2, Hina Salman2, Mohib R. Kazimi3
1Department of Chemistry, University of Karachi, Karachi, Pakistan
2Institute of Chemistry International Center for Chemical and Biological Sciences, University of Karachi, Karachi, Pakistan
3Department of Applied Chemistry and Chemical Technology, University of Karachi, Karachi, Pakistan
Email: *msqureshi98@gmail.com, zahidku@yahoo.com, mehandy15@hotmail.com, mrkazmi@uok.edu.pk
Copyright © 2015 by authors and Scientific Research Publishing Inc.
This work is licensed under the Creative Commons Attribution International License (CC BY).
http://creativecommons.org/licenses/by/4.0/


Received 12 February 2015; accepted 27 March 2015; published 31 March 2015;
ABSTRACT
DSC-TGA was used for screening of commercially available and synthesized catalyst for the degradation of polypropylene (PP). In this study, all the runs were performed with 50% load of the catalyst and the results were compared with those of PP + 50% pure silica having no catalytic activity. The degradation behavior of PP using catalyst Zeolyst-713 exhibited much higher degradation activity among the other catalysts used in this study. Moreover, it contributed to lowering of initial stage temperature showing a shape-selective effect. DSC-TGA tools such as Ton, Tmax, T99%, activation energy, enthalpy change in the process and coke content were used for screening. It was concluded that the pore construction and unique acid properties of the Zeolyst-713 as well as proper reaction temperatures were significant influential factors to fully exert this effect. In this work, kinetics of catalytic thermogravimetric degradation of PP used for domestic purposes was investigated using Alumino-silicate catalyst. Zeolyst-713 was observed to lower activation energy and enhances degradation activity in comparison with thermal degradation without a catalyst.
Keywords:
Thermogravimetric Analysis (TGA), DSC, Pyrolysis, Catalytic Degradation, Polypropylene Waste Plastic, Catalysis

1. Introduction
The quanta of plastic wastes generated by our society are on the rise. There is no option except recycling for conservation of resources and environment [1] .
Being a low biodegradable material, recycling of plastic waste has become one of the front line issues these days. Moreover, large scale production poses serious environmental problems, necessitating awareness of source reduction, re-use and recycling and propose environmentally friendly solution. Polypropylene, one of the core components of waste plastic is widely used as industrial thermoplastic. However, for polyethylene-terephthalate (PET) and other linear polyesters, chemical and physical recycling to lower grade plastics is available, but, most of the plastic wastes are either incinerated or buried that consequently cause aesthetic and environmental hazards. Given that incineration could not be the best possible option and might pose serious environmental problems, for sustainable growth and environmental protection, upgrading of waste plastic is necessary.
Among available options catalytic degradation requires lower temperatures ranging from 350˚C to 550˚C than thermal ranging between 500˚C to 900˚C, with production of more valuable products [2] - [8] . In addition, several studies have been reported using known hydro-cracking catalyst widely used in oil industry.
Activities of acidic catalyst on cracking of plastics were reported by Negelein et al., (sulfated zirconia, a strong acid catalyst, known to lower cracking temperature and facilitate the mechanism of hydride abstraction) [9] and Akpanudoh et al. [10] . Zeolite Y. and ZSM-5 accelerated the degradation of high density polyethylene (HDPE) through reducing the activation energy of the process. ZSM-5 also exhibited lower coke deposits compared to Zeolite Yas reported by Garforth et al. [11] . Acidity of catalyst is related to the degradation process. The higher the acidity of the catalyst, the higher is the resultant degradation with an increase in volatile saturated products. Akpanudoh et al., also showed that HZSM-5 and silica-alumina catalysts mainly produce olefins as primary volatile products. It was observed that polymer degradation was more efficient in the presence of the catalyst. Similar results were observed by Araujo et al. [12] . PP is an easily degradable compared to low density polyethylene LDPE and HDPE [13] .
Extensive work has been done for the characterization of the catalyst for plastic degradation and most commonly, TGA instrument has successfully been used. TGA-DSC analysis serves primarily as an assessment tool in the screening of various potential catalysts for polyolefin pyrolysis prior to the micro reactor or to a pilot plant.
This study screens the synthesized and commercially available catalyst performance of varying acidity, pore volume and surface area by TGA indices. PP has 25% market share in world consumption throughout the world among thermoplastics. Consequently, PP widely used in domestic and commercial application, had been selected for this study. The synthesized catalyst is a composite of USY zeolite and titania-alumina. TGA facilitates the investigation on degradation kinetics during pyrolysis of waste plastics [14] - [18] . In inert atmosphere and constant temperature ramping program it provides details of thermal events of plastic during pyrolysis by plotting weight loss of the sample as a function of temperature, crucial for designing and conversion on industrial scale. TGA method developed here for catalytic degradation would help in the development of cheaper catalyst.
2. Experimental
2.1. Polymer
The model plastic polypropylene (PP, Mn = 75,000; d = 978 kg/L) was used in this study.
2.2 Catalyst
Five catalysts were used and these were given numbers, C-1 to C-5 and C-6 which is pure silica (not a catalyst), for their identification. Catalyst C-1, beingtitania based, was synthesized in our laboratory according to the method described by Ali and Asaoka [19] and the procedure described elsewhere in [20] . Catalysts C-2 to C-5 were purchased from commercial sources largely used by petroleum refiners. RCD-8 is a new market catalyst of UOP for fluidized catalytic cracking of petroleum residues). Before being used in the reaction experiment, the catalysts were all treated with an air stream for 4 h at 400˚C for activation.
2.3 Instrument and Condition
Thermal and catalytic cracking experiments were carried out in TA Instruments SDTQ600 simultaneous TGA- DTA-DSC thermogravimetric analyzer. Fine powder of PP and dry catalyst mixed in 1:1 ratio, with a total load of 10 ± 0.5 mg were used. Additionally, samples were treated under nitrogen with higher purge rate of 100 ml/min in an open ceramic pan to improve the external heat transfer between the molten polymer and the outside of the catalyst particles. Nitrogen flow creates an inert atmosphere for reaction while heat transfer limitation disregards with small sample size and low heating rate. The samples were then equilibrated to 100˚C before being heated to 800˚C at a heating rate of 20˚C/min. Air was then introduced at 550˚C for the determination of coke content. G. Audisio, et al., observed that the inert (SiO2) material got mixed with PP as reference to evaluate PP degradation in the absence of catalytic action is better than PP only [21] [22] .
3. Result and Discussion
Degradation of PP was performed with catalysts of varying acidity, pore structure and surface area in a refinery and compared with the synthesized catalyst. Instead of pure PP, inert material (SiO2) similar in surface area to the catalysts was chosen as reference to evaluate PP degradation in the absence of catalytic action as shown in Figure 1(a) & Figure 1(b). G. Audisio et al., showed insignificant catalytic effect of SiO2 on PP degradation in terms of product yields and distribution also concluded that such reference is more adequate than pure PP [21] [22] .
 (a)
(a) (b)
(b)
Figure 1. (a) Over lay of DTG curve of PP and PP + 50%SiO2; (b) Over lay of TG curve of PP and PP + 50%SiO2.
The use of acid catalyst can enhance thermal degradation of synthetic polymers that could be monitored by thermogravimetry. For the present study, catalyst of wide ranging acidity and surface area was used. The detailed characteristics of the catalyst being in an amorphous form (SiO2-Al2O3) are given in Table 1.
Product distribution in the results of pyrolysis depends on both the pore size and acidity of the catalyst [1] .
The decomposition of polymer is very complex radical chain mechanism, involving initiation, propagation and termination reactions. Degradation of PP under different heating rates and carries gases reported in literature [23] [24] [27] [28] . Polymers are long chain macromolecules with high viscosity during degradation, it is assumed that the polymer macromolecules break down initially at the exterior of catalyst surface and then small fragments enter into the inner pore structure of catalyst to undergo further reactions [29] .
The differences obtained for polymer degradation could be explained by different Si/Al ratios as well as their porous structure: higher Si/Al means a reduction in the number of Al3+ cations in the adjacent positions, which provides strong Brønsted acid sites due to their isolation [24] [30] Acid-catalyzed degradation of hydrocarbons is recognized to proceed via carbonation mechanisms, initiated either by proton donation (Brønsted acid sites, strong acid sites) or by hydride abstraction (Lewis acid sites, mild acid sites) [24] [31] . In the case of HY zeolite, the initial polymer cracking most likely occurs at the acid sites positioned at the exterior surface of the zeolite crystals or at the openings of pores. This cracking produces smaller molecules, which are able to diffuse in to the interior of zeolite and transform into coke due to the strong Brønsted acid sites being there, leading to obstruction of the microporous structure [32] . PP is easily degradable compared to LDPE and HDPE [13] .
Although the process of catalytic degradation of PP is far from an elementary reaction, kinetic information derived from the rmogravimetric analysis and properties such as activation energies could be obtained from TG data. Reactions conducted in the bulk polymer involve more serious problem of heat transfer and mixing efficiency than those observed for small TG samples. 1:1 ratio eliminates the bulk pyrolysis of pure PP and influence of the catalyst on PP degradation could readily be determined by carrying TG experiments that allow useful comparison. For the characterization of thermal degradation process the experimental indices onset temperature (Ton), temperature of maximum rate of degradation (Tmax), energy required during main degradation step, the apparent activation energy of degradation process (EA) and remaining coke content were used. For the minimization effects of parallel non-catalytic bulk pyrolysis, effect of heating rate, and to reduce the instrumental and mixing variation, multiple runs were performed till the difference of Tmax for same composition became 2˚C and that of enthalpy change in the process differed to 5 j/g.
In Figure 2(a) & Figure 2(b), the mass loss (TG %) curves of all studied samples are presented at a heating rate of 20˚C/min. Pure PP initiated thermal degradation at about 380˚C, while the presence of catalyst caused a shift of initial mass loss towards lower temperatures depending upon the catalyst performance. There was a clear shift of initial decomposition temperature of almost all catalysts except C-5.
The temperatures of onset, Ton, T99%, and temperature at maximum-rate Tmax, for the degradation were examined on the basis of the derivative thermogram and a significant decrease was found in the presence of catalysts, except for C-5, as shown in Table 2 and Figure 3. Plastics with similar structure―HDPE & LDPE―had T99%, in the range of 491˚C - 505˚C [3] . Tonvalues for PP over C-3 were smaller than those of the other catalysts. These results indicate that C-3 lowers PP decomposition temperature considerably. The order of decreasing Ton is as below.

Table 1. Characteristic of used catalyst.
Table 2. Comparison of onset-temperatures (Ton), T99%, moisture% and maximum-rate temperatures (Tmax) for PP degradation on catalyst and on SiO2 (inert reference material).
 (a)
(a) (b)
(b)
Figure 2. (a) Over lay of TG curve of PP and PP + 50%SiO2; (b) Overlay of TGA curve of PP + 50% Silica with 50% load of catalyst.
The analysis of the thermograms of catalysts Figure 4 shows a regular decrease in weight versus temperature. Such weight loss occurs with a quite constant rate. This weight loss is missing in the run of pure PP.

Figure 3. Comparison of Ton, Tmax and Tend of studied catalyst.
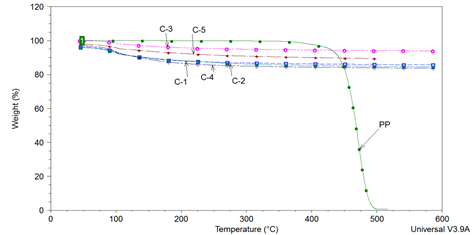
Figure 4. Overlay of TGA of used catalyst C-1 to C-5 and pure PP.
These observations were compared with the thermal analyses of each catalyst without polymer to evaluate the weight variation related to the catalyst. It is evident that a slight, but not negligible, loss of weight is attributable to the catalyst, probably due to the release of physical and structural water, occurring next to the major weight loss in PP sample. The weight loss of catalyst was relatively small and relatively linear with temperature. Weight loss is more important after 100˚C at higher temperatures as summarized in Table 1. Moisture content depends on structure, pore volume and acidic property of the catalyst. Tmax indices of the catalyst are in the following order.
3.1. Kinetics of Polymer Degradation
Arrhenius Equation was applied for the determination of activation energy and pre-exponential factor. Activation energy (Ea) with 50% catalyst load was determined by equation 4 and is summarized in Table 3. From main degradation steps, 10 to 90% data was selected for kinetic evaluation. The activation energy for the pyrolysis of virgin PP with 50% SiO2 was found to be 310.7 kj/mole. A considerable decrease in Activation energy was observed with the catalyst, but this effect was not very significant when using C-5.
Kinetic parameters were determined on the basis of two assumptions: 1) the degradation reaction is of the first order and 2) catalytic decomposition is dominant, by integral method and Equation (1) [25] [26].
(1)
where x could be determined by:
(2)
Weight loss rate was calculated by the following expression.
(3)
where Wf is the final mass at the end of pyrolysis (here at 99% of main degradation step), Wo is the initial weight loss and Wt is the weight loss at time t.
For a constant heating rate Equation (1) is rearranged as follows.
(4)
For constant heating rate
Plotting of graph between ln[−ln(1−x)/T2] versus 1/T of PP showed linear dependence on temperature as shown in Figure 5, slope of the curve gave the Ea value as summarized in Table 3 [25] [26] . Figure 5 shows the pictorial graph of PP degradation and Figure 6 depicts Ea comparison.
Figure 6 showed that for C-5 although Tmax, Ton and T99% not lower considerably but they decreased activation energy compared, with without catalytic reaction. This is evidence for some catalytic activity but different product distribution that ultimately leaves residue.
On the basis of Tmax, Ton, T99% and activation energy values, C-3 was found to be superior over other catalysts

Figure 5. Ggraph between ln[−ln(1 − x)/T2] versus 1/T for determination of Ea of pure PP.
Table 3. Summary of Ea value.
aMeasured weight fraction.
used during this study and was selected for stepwise Ea calculation. Stepwise Ea was determined through the splitting of whole process into different steps, taking 0 to10% as independent single step up to 90% to 100% for the main degradation process only for C-3 which is shown in Table 4. Table 4 indicates that after each step, activation energy is increased showing that as degradation proceeds, heavier molecules remain in pan which ultimately depends on preceding steps and results in residue in TGA pan. In TGA run where no hydrogen is added to the system, initially lower molecular weight hydrocarbons with high H: C ratio mainly in gaseous state are formed.
3.2. Amount of Coke/Waxy Material
TGA is also a good tool for the determination of Coke content [1] TG run turns catalyst black most probably due to residual compound formed during pyrolysis, when operated up to 500˚C. The formation of coke is equally probable. For the estimation of coke/residue content the reaction mixtures were heated further up to 800˚C by the introduction of oxygen in the system that burn the remaining coke/residue present even in the lattice of catalyst. This weight loss is shown in Figure 7. Despite the weight loss due to moisture initially weight loss is the major reaction that produces the product of interest and was therefore selected for the kinetic study.
Further use of second weight loss had its utility for the determination of catalyst performance. Of course, the second weight loss is equally important for the screening of catalyst. More coke/residue product forming catalyst blocks the active catalyst sites and needs to be reactivated for reuse. The quantities of coke produced in the reaction are directly related to the specific structure of the catalyst. If the sizes of the pore are insignificant the

Figure 6. Comparison of activation energy for C-1 to C-6.
Table 4. Step wise Ea for C-3 in main degradation step.
accumulation of large cracked molecules is not allowed. It has been reported that due to their specific relatively narrow pore size and structure ZSM-5 Zeolites have low coking properties. Small pore size does not allow deposition of bigger cracked molecules into the pores as compared to Zeolites of other type [33] . For direct application, the regeneration of catalyst is very crucial. Enormous amount of heat is generated during this exothermic process as shown in DSC curve Figure 8.
This generated energy perhaps might be used for activation catalyst for new feed. If the removal of coke is not fully accomplished, it may cause catalyst deactivation. Each cycle of polymer addition may introduce a limit in the use of polymer/catalyst ratios; one has to either introduce more fresh catalyst or to regenerate it. The quantity of coke/residue production is directly related to heating rate, acidity of catalyst, outer and inner acidic sides of catalyst pore size and surface area of catalyst. A logical guess suggests that pyrolysis products of high C:H ratio gives low coke content and vice versa, therefore, this weight loss has its utility for the screening tool of catalyst performance.
Table 5 summarizes the coke/residue content with each catalyst. During degradation C-3 distributes products selecting lowest energy path in such a way that only small amount of coke/residue remains in the pan and proves superiority over the other. Coke/residue content has the following decreasing order.
3.3. DSC Study
Catalysts not only lower the activation energy and Tmax but also lower the required energy in main endothermic

Figure 7. DTGA & TG curve of PP with 50% catalyst.

Figure 8. DSC endothermic and exothermic profile of PP with 50% catalyst.
process. Figure 9 shows not only a shift of Tmax but a curve depicts endothermic behavior. Activation energy has its own utility but in closed continuous reaction vessel, once the feed is activated, the extra amount of energy is used to activate new feed and the energy required for the process becomes very important as it actually determine the cost of the process. Energy required for the process is also important parameter for catalyst screening.
The catalyst degrades plastic in such a way that in each step molecules requires lower enthalpy of reaction and it depending upon the catalyst’s acidic active site and pore structure, ultimately its performance is determined. Table 5 shows the energy required for each used catalyst and are compared with PP with 50% SiO2. It is observed that the catalyst lowers the required energy than thermal degradation. Only C-3 was found to be considerably superior, whereas C-5 didnot lower the energy significantly. TGA facilitated determination of enthalpy change during the reaction which provide ultimately helpful for the screening of catalyst for its activity for degradation. Linear curve was used for estimation of enthalpy change in the process.
4. Conclusions
The values of Ton and Tmax are correlated with the kinetics and the mechanism of the degradation. The two measures, Tmax as well as Ton can be regarded as good direct measures of the catalytic effect. In the present study it is apparent that the influence of the catalyst on PP degradation could be examined on the basis of kinetic parameters derived from kinetic interpretation from TG data.
For the pilot plant and direct application, the regeneration of catalyst or the removal of high molecular compounds is very crucial. The energy released on the burning of formed products that is an exothermic process produces the enormous amount of heat depending upon the amount of products. This generated energy might be used for the activation of fresh added feed of polymer in the plant. Catalysts that provide lowest energy path for degradation are of superior activity than others. They are economical and hence save energy and money. Moreover, they are also easy to handle.
Catalytic activity for degradation and product distribution are shared effects of acidity surface area and pore

Figure 9. DSC endothermic curve of PP with all studied catalyst at 50% load.
Table 5. Coke/residue content and energy used in the endothermic curve.
aMeasured weight fraction.
volume. Coke content, energy consumption, enthalpy change, activation energy and Tmax are good indices for catalyst performance evaluation. In this study, Zeolyst Z-713 was found to be superior over other used catalysts that lower coke content, activation energy, Tmax and enthalpy required for the process.
In this work a novel usage of TGA, is done in terms of screening of catalyst. The procedure not only proved to be time-saving and cost effective, but also highly accurate. An overall result demonstrates an ideal stage for implementation at pilot plant level. Important parameters of TGA run will be used to calculate Ton, Tmax, T99% coke content and enthalpy for monitoring hydro-cracking catalyst performance.
Acknowledgements
The authors would like to thank Dr. Farhat Ali, Higher Education Commission, and Dean of Sciences University of Karachi for financial support. The facility support provided by H. E. J. Research Institute of Chemistry, ICCBS are gratefully acknowledged.
References
- 1. Billingham, N.C. (1999) Polymers and the Environment. London: Gerald Scott. Royal Society of Chemistry.
- 2. Marcilla, A., Gomez, A., Reyes-Labarta, J.A. and Giner, A. (2003) Catalytic Pyrolysis of Polypropylene Using MCM-41: Kinetic Model. Polymer Degradation and Stability, 80, 233-240. http://dx.doi.org/10.1016/S0141-3910(02)00403-2
- 3. Graciliano, E.C., Silva, A.O.S., Souza, M.J. and Araujo, A.S. (2005) Thermo Gravimetric Kinetics of Polypropylene Degradation on ZSM-12 and ZSM-5 Catalysts. Catalysis Today, 107, 507-512.
- 4. Hardman, S., Leng, S.A. and Wilson, D.C. (1993) BP Chemicals Limited. Polymer Cracking, European Patent Application, 567292.
- 5. Kaminsky, W., Schlesselmann, B. and Simon, C. (1995) Olefins from Polyolefins and Mixed Plastics by Pyrolysis. Journal of Analytical and Applied Pyrolysis, 32, 19-27. http://dx.doi.org/10.1016/0165-2370(94)00830-T
- 6. Sodero, S.F., Berruti, F. and Behie, L.A. (1996) Ultrapyrolytic Cracking of Polyethylene—A High Yield Recycling Method. Chemical Engineering Science, 51, 2805-2810. http://dx.doi.org/10.1016/0009-2509(96)00156-X
- 7. Mastellone, M.L., Perugini, F., Ponte, M. and Arena, U. (2002) Fluidized Bed Pyrolysis of a Recycled Polyethylene. Polymer Degradation and Stability, 76, 479-487. http://dx.doi.org/10.1016/S0141-3910(02)00052-6
- 8. Fortelny, I., Michalkova, D. and Krulis, Z. (2004) An Efficient Method of Material Recycling of Municipal Plastic Waste. Polymer Degradation and Stability, 85, 975-979. http://dx.doi.org/10.1016/j.polymdegradstab.2004.01.024
- 9. Negelein, D.L., Lin, R. and White, R.L. (1998) Effects of Catalyst Acidity and HZSM-5 Channel Volume on Polypropylene Cracking. Journal of Applied Polymer Science, 67, 341-348. http://dx.doi.org/10.1002/(SICI)1097-4628(19980110)67:2<341::AID-APP15>3.0.CO;2-0
- 10. Akpanudoh, N.S., Gobin, K. and Manos, G. (2005) Catalytic Degradation of Plastic Waste to Liquid Fuel over Commercial Cracking Catalysts: Effect of Polymer to Catalyst Ratio/Acidity Content. Journal of Molecular Catalysis A: Chemical, 235, 67-73.
- 11. Ali, S., Garforth, A., Harris, D., Rawlence, D. and Uemichi, Y. (2002) Polymer Waste Recycling over “Used” Catalysts. Catalysis Today, 75, 247-255. http://dx.doi.org/10.1016/S0920-5861(02)00076-7
- 12. Araujo, A., Fernandes Jr., V. and Fernandes, G. (2002) Thermogravimetric Kinetics of Polyethelyne Degredation over Silicoaluminophosphate. Thermochimica Acta, 392-393, 55-61. http://dx.doi.org/10.1016/S0040-6031(02)00072-2
- 13. Wu, C.H., Chang, C.Y., Hor, J.L., Shih, S.M., Chen, L.W. and Chang, F.W. (1993) On the Thermal Treatment of Plastic Mixtures of MSW: Pyrolysis Kinetics. Waste Management, 13, 221-235. http://dx.doi.org/10.1016/0956-053X(93)90046-Y
- 14. Williams, P.T. and Ahmad, N. (1999) Influence of Process Conditions on the Pyrolysis of Pakistani Oil Shales. Fuel, 78, 653-662. http://dx.doi.org/10.1016/S0016-2361(98)00190-2
- 15. Jaber, J. and Probert, S. (2000) Non-Isothermal Thermo-gravimetry and Decomposition Kinetics of Two Jordanian Oil Shales under Different Processing Conditions. Fuel Processing Technology, 63, 57-70. http://dx.doi.org/10.1016/S0378-3820(99)00064-8
- 16. Williams, P.T. and Ahmad, N. (2000) Investigation of Oil-Shale Pyrolysis Processing Conditions Using Thermogravimetric Analysis. Applied Energy, 66, 113-133. http://dx.doi.org/10.1016/S0306-2619(99)00038-0
- 17. Bockhorn, H., Hornung, A., Hornung, U. and Schawaller, D. (1999) Kinetic Study on the Thermal Degradation of Polypropylene and Polyethylene. Journal of Analytical and Applied Pyrolysis, 48, 93-109. http://dx.doi.org/10.1016/S0165-2370(98)00131-4
- 18. Aguado, R., Olazar, M., Gaisán, B., Prieto, R. and Bilbao, J. (2002) Kinetic Study of Polyolefin Pyrolysis in a Conical Spouted Bed Reactor. Industrial & Engineering Chemistry Research, 41, 4559-4566. http://dx.doi.org/10.1021/ie0201260
- 19. Ali, M. and Asaoka, S. (2009) Ni-Mo-Titania-Alumina Catalysts with USY Zeolite for Low Pressure Hydrodesulfurization and Hydrocracking. Petroleum Science and Technology, 27, 984-997. http://dx.doi.org/10.1080/10916460802455723
- 20. Ali, M.F. and Qureshi, M.S. (2011) Catalyzed Pyrolysis of Plastics: A Thermogravimetric Study. African Journal of Pure and Applied Chemistry, 5, 284-292.
- 21. Audisio, G., Silvani, A., Beltrame, P. and Carniti, P. (1984) Catalytic Thermal Degradation of Polymers: Degradation of Polypropylene. Journal of Analytical and Applied Pyrolysis, 7, 83-90. http://dx.doi.org/10.1016/0165-2370(84)80042-X
- 22. Carniti, P., Gervasini, A., Beltrame, P., Audisio, G. and Bertini, F. (1995) Polystyrene Thermodegradation. III. Effect of Acidic Catalysts on Radical Formation and Volatile Product Distribution. Applied Catalysis A: General, 127, 139-155. http://dx.doi.org/10.1016/0926-860X(95)00044-5
- 23. Lee, K.H. and Shin, D.H. (2003) Catalytic Degradation of Waste HDPE over Acidic Catalysts with Different Pore Sizes. Journal of Industrial and Engineering Chemistry, 9, 584-589.
- 24. Machado, A.V., Neves, I., Botelho, G. and Rebelo, P. (2006) In Thermogravimetric Study of Polyethylene Catalytic Degradation by Zeolites, Materials Science forum, Trans Tech Publ, 901-904.
- 25. Liu, Q., Hu, H., Zhou, Q., Zhu, S. and Chen, G. (2004) Effect of Inorganic Matter on Reactivity and Kinetics of Coal Pyrolysis. Fuel, 83, 713-718. http://dx.doi.org/10.1016/j.fuel.2003.08.017
- 26. Biagini, E., Lippi, F., Petarca, L. and Tognotti, L. (2002) Devolatilization Rate of Biomasses and Coal-Biomass Blends: An Experimental Investigation. Fuel, 81, 1041-1050. http://dx.doi.org/10.1016/S0016-2361(01)00204-6
- 27. Kiran, E. and Gillham, J. (1976) Pyrolysis-Molecular Weight Chromatography: A New Online System for Analysis of Polymers. II. Thermal Decomposition of Polyolefins: Polyethylene, Polypropylene, Polyisobutylene. Journal of Applied Polymer Science, 20, 2045-2068. http://dx.doi.org/10.1002/app.1976.070200803
- 28. Lattimer, R.P. (1995) Pyrolysis Field Ionization Mass Spectrometry of Polyolefins. Journal of Analytical and Applied Pyrolysis, 31, 203-225. http://dx.doi.org/10.1016/0165-2370(94)00824-K
- 29. Lin, Y.H. and Yang, M.H. (2007) Catalytic Pyrolysis of Polyolefin Waste into Valuable Hydrocarbons over Reused Catalyst from Refinery FCC Units. Applied Catalysis A: General, 328, 132-139. http://dx.doi.org/10.1016/j.apcata.2007.05.039
- 30. Neves, I.C., Botelho, G., Machado, A.V. and Rebelo, P. (2007) Catalytic Degradation of Polyethylene: An Evaluation of the Effect of Dealuminated Y Zeolites Using Thermal Analysis. Materials Chemistry and Physics, 104, 5-9. http://dx.doi.org/10.1016/j.matchemphys.2007.02.032
- 31. Gobin, K. and Manos, G. (2004) Polymer Degradation to Fuels over Microporous Catalysts as a Novel Tertiary Plastic Recycling Method. Polymer Degradation and Stability, 83, 267-279. http://dx.doi.org/10.1016/S0141-3910(03)00272-6
- 32. Guisnet, M. and Magnoux, P. (1989) Coking and Deactivation of Zeolites: Influence of the Pore Structure. Applied Catalysis, 54, 1-27. http://dx.doi.org/10.1016/S0166-9834(00)82350-7
- 33. Park, J.W., Kim, J.H. and Seo, G. (2002) The Effect of Pore Shape on the Catalytic Performance of Zeolites in the Liquid-Phase Degradation of HDPE. Polymer Degradation and Stability, 76, 495-501. http://dx.doi.org/10.1016/S0141-3910(02)00059-9
NOTES
*Corresponding author.