American Journal of Analytical Chemistry
Vol. 3 No. 2 (2012) , Article ID: 17294 , 7 pages DOI:10.4236/ajac.2012.32024
LA-ICP-MS Calibrations for Intact Rock Samples with Internal Standard and Modified Constant-Sum Methods*
Department of Earth and Environmental Sciences, University of Texas at Arlington, Arlington, USA
Email: #maxhu@uta.edu
Received December 15, 2011; revised January 20, 2012; accepted January 29, 2012
Keywords: LA-ICP-MS; Quantitative Calibration; Internal Standard Method; Modified Constant-Sum Method
ABSTRACT
Laser ablation coupled with inductively coupled plasma-mass spectrometry (LA-ICP-MS) calibration was conducted with multiple spot analyses on eleven intact rock samples using both an internal standard (IS) method and a modified constant-sum (MCS) method. Methods were then compared for reported bulk elemental composition of the rocks. The MCS method was based on the sum of eight major elements, which is spatially more stable than one single major element as used in the IS method, and is quite constant among different rock samples. Calibrations were performed with standard reference materials NIST SRM 610, 612, 614, and 616. Little difference was found between using a single standard and a set of standards, because of the good linearity shown by the reference materials. Comparison of the two calibration methods shows that the MCS method produced better and more stable results than the IS method for heterogeneous samples. With the MCS method, approximately 94% to 95% of the total measurements are within the range of ±100% relative deviation, compared with 82% to 86% with the IS method. The IS method resulted insubstantial overestimations for some rock samples (e.g., 648% for Basalt BCR-2 using NIST SRM 610 as the calibration standard), while the largest deviation with the MCS method was 216% for U in Eagle Ford shale #80 sample. For Quartz latite QLO-1, a relative homogeneous sample, the IS method generated slightly better results than the MCS method. Regardless of method, spatially heterogeneous distribution of elements in the intact rock at the scale of the laser spot is considered to be the main reason for the large relative deviations seen in our work compared to published results.
1. Introduction
Laser ablation coupled with inductively coupled plasmamass spectrometry (LA-ICP-MS) is a method for obtaining multi-elemental, micro-scale concentration measurements with high sensitivity. This is desirable when performing micro-scale and feature-based elemental mapping in environmental monitoring studies, such as chemical distribution in hard barrier rocks (e.g., [1]). LA-ICP-MS has already been well proven as a powerful tool for rapid and quantitative trace element analyses in a variety of materials (e.g., [2-4]). However, LA-ICP-MS has often been considered to be only semi-quantitative, because of the lack of matrix-matching calibration standards [5]. Attempts to more rigorously quantify LA-ICP-MS data involve calibration of the (changing) mass response of the ICP-MS, and correction for differences in ablation yield between the sample and calibration standard [5].
Two calibration methods are commonly used, which we refer to as internal-standard (IS) and constant-sum (CS) [6]. The internal-standard method requires that the concentration of at least one (usually major) element be known for, and uniformly distributed within, the sample. However, this is rarely the case in geological samples, for which elemental distributions are heterogeneously distributed across a wide range of length scales. In fact, the smaller the laser spot, the greater the local geochemical heterogeneity that will be manifested. In contrast, the constant-sum method uses the sum of 100% of all sample constituents (oxides) as a normalization standard, and therefore does not require the choice of an internal standard [7-11]. However, different oxide states (e.g., Fe) raise uncertainty in back-calculating elemental concentrations from the oxide concentrations. Furthermore, monitoring all (major, minor, and trace) elements will practically increase the measurement times.
In this work, both the internal standard (IS) and a modified constant-sum (MCS) methods are used for quantitative elemental concentration calculation with eleven intact rock samples, and the concentrations are compared to those measured on powdered samples of these rocks. In the MCS method, instead of summing to 100% across all oxides, the relatively constant sum of eight major elements is used as the calibration basis. Calibrations are conducted with both single and multiple standard reference materials of NIST SRM 610, 612, 614, and 616 and the results are compared and discussed in Section 3.2.
2. Experimental
2.1. Instrumentation and Operating Conditions
A UP-213 laser ablation system (New Wave, Freemont, CA), interfaced with a PerkinElmer/SCIEX ELAN DRC II (Sheldon, CT) ICP-MS system, was used in this study. Helium was used as the carrier gas to transfer the lasergenerated aerosol through a glass tee into the ICP-MS. At the same flow rate as helium (0.6 L/min), argon was used as the make-up gas to maintain the plasma. Argon was also used to bring in liquid standards (2 µg/L (ppb) each6Li, 45Sc, 115In, and 209Bi), which were continuously introduced into the ICP-MS to monitor its stability and provide a basis for time-drift correction. The ICP-MS sensitivity was tuned to keep the 115In signal response high, while maintaining the oxide ratio (156CeO/140Ce) and doubly-charged Ba2+/Ba+ (70/140) less than 3% (see Table 1 for operating conditions and parameters). During data acquisition, signal intensities (counts per second, CPS) were recorded for thirteen elements with a range of atomic mass (i.e., 23Na, 24Mg, 27Al, 29Si, 44Ca, 55Mn, 85Rb, 88Sr, 133Cs, 138Ba, 208Pb, 232Th, and 238U). Note that although it is the isotope that is measured, the resultant concentration is for the element. This is because the concentration of each element, instead of isotope, is used as the reference material concentration, and the same isotope is monitored in both samples and reference materials.
2.2. Sample Description and Laser Ablation Routine
Eleven intact rock samples from different sources with different mineralogy were used in this study for LA-ICPMS analyses. They are numbered from 1 to 11 as: Andesite AGV-1, Shale SGR-1, Granite G-2, Basalt BCR-2, Rhyolite RGM-1, Quartz latite QLO-1, Syenite STM-1, Eagle Ford Shale #53, #78, #80, and #103. The first 7 samples come from the U.S. Geological Survey (USGS), which provide recommended and information values of elemental concentration for the powdered samples, from various quantitative measurements. The chemical composition of Eagle Ford shale (4 samples at different depths of a borehole) was measured by X-ray fluorescence (XRF) (Harold Rowe. the University of Texas at Arlington, personal communication).
Laser ablation was conducted at multiple (5-6) spots, with a spot size of 80 µm, for both reference materials and samples (Table 1). For NIST SRM glass samples, different numbers of laser pulses (5, 20, 100, and 200 for SRM 610, 612, 614, and 616, respectively) were used to account for their different concentrations of trace elements. For geological samples, 20 laser pulses were fired in each sampling spot. The sampling spots were spaced 1 mm apart to better account for heterogeneity of the geological samples. For example, granite is a coarse-grained rock with primary grain sizes larger than the laser spot size used. An advantage of using LA-ICP-MS, compared to bulk measurements on powdered samples, is the ability to assess spatial variability between sampling spots. Different extents of heterogeneity in the scale of ~400 µm can be observed from the photos taken by LA software during spot analyses. Figure 1 shows two examples with large (basalt BCR-2) and small (quartz latite QLO-1) extents of heterogeneity, which will be discussed in Section 3.2.
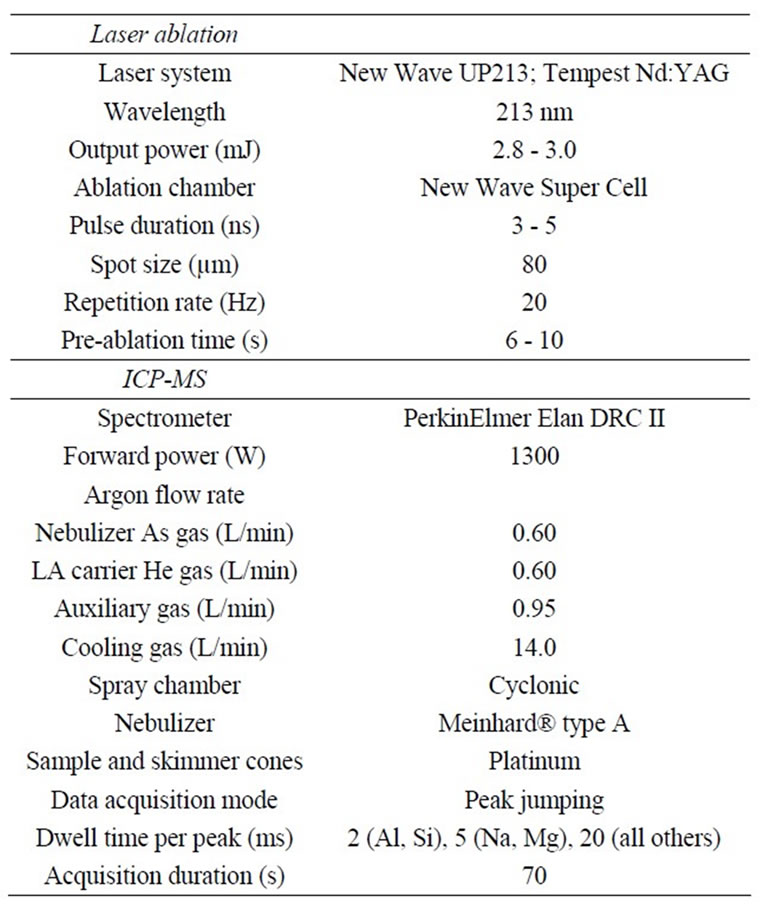
Table 1. Operating conditions for LA-ICP-MS.
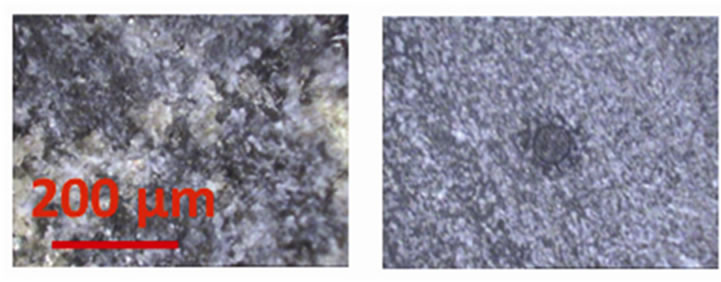
Figure 1. Laser ablation images of two samples with different heterogeneities. Left: basalt BCR-2; right: quartz latite QLO-1 (the darker circle is the sampling spot, which is 80 µm).
2.3. Data Correction and Calibration
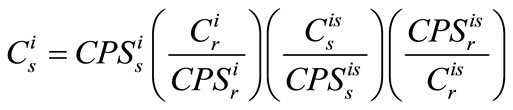
Calibration of element concentration (C) based on signal intensity (CPS) using the internal standard method is based on the equation
 (1)
(1)
where the subscripts r and s refer to reference material and sample, respectively, and the superscripts i and is respectively denote different elements and the internal standard.
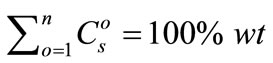
The constant-sum quantification method was originally proposed by Gratuze [7], where summing the oxide concentrations of all n elements ( ) to 100% was used as the basis for calibration:
 (2)
(2)
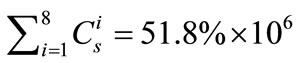
However, as discussed in the Introduction (Section 1), collecting concentrations of all major elements is problematic. In this work we modified this method, as a compromise of a single and all elements, to use the sum of eight major elements (Na, Mg, Al, Si, Ca, Fe, K, and Mn) as the basis. These elements have shown a constant mass fraction of 51.8% ± 1.1% among 12 different rocks (Table 2). Rudnick and Gao [12] reported the elemental composition of upper continental crust (Table 2), with nine elements (the eight elements used in this work, plus Ti with a weight percentage of 0.38%) making up 100%. In future work, these nine elements can be selected in the MCS method.
The sum of eight major elements is expected to give a more uniform distribution spatially than a single element at the sampling spot, and this will be especially useful for the elemental quantification in heterogeneous natural rock. In essence, this modified constant-sum (MCS) method is a compromise between the IS method and Gratuze’s [7] sum-to-100% method. With the unit of concentration being mg/kg (ppm), Equation (2) was modified to
 (3)
(3)
Therefore,  , the ratio of ablation yield parameters between reference material and sample, can be calculated as
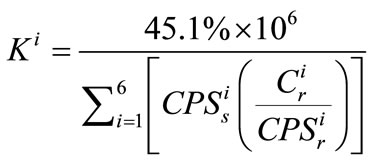 (4)
(4)
Subsequently, element concentration can be calculated as:
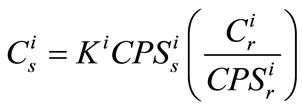 (5)
(5)
The modified constant sum method is explicitly derived based on the concentration of each element instead of their oxides, and requires the measurement of just 8 major elements during sample analyses by LA-ICP-MS; therefore, it is easier to implement than the sum-to-100% method. Before applying the afore-mentioned equations in calculating , all
, all  data need to be normalized to a per-pulse basis, and correction is made for time drift of the instrument.
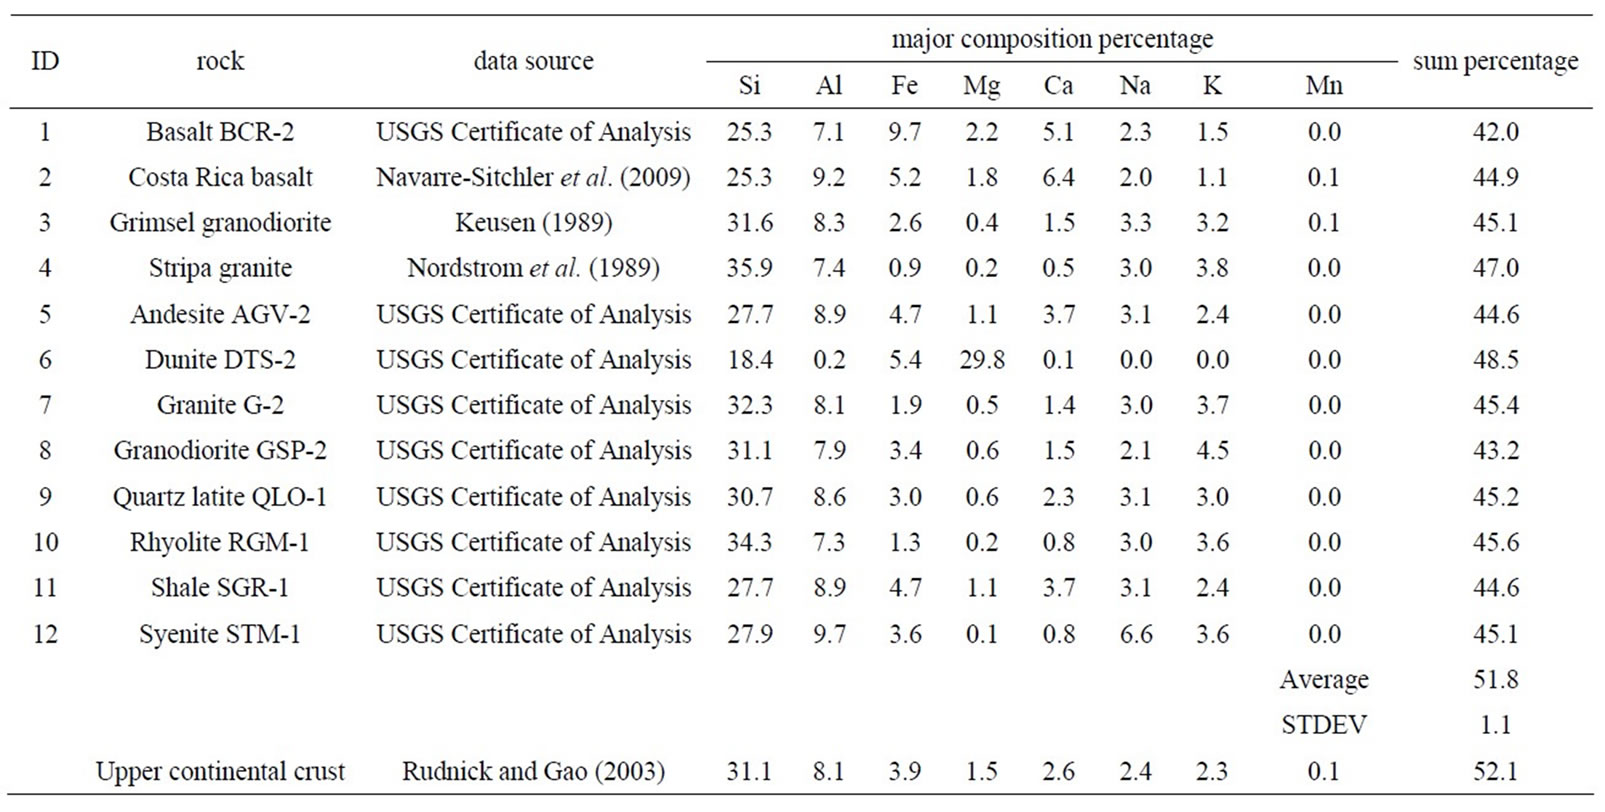
Table 2. Eight major composition percentages for twelve rocks.
3. Results and Discussion
3.1. Calibration Curve of Standard Reference Materials
Liquid standards (2 µg/L each for 6Li, 45Sc, 115In, and 209Bi) were continuously introduced into the ICP-MS and their responses were monitored when laser was fired and solid signals were collected. Signal intensities for the four liquid internal standards were largely stable over 6 hours’ run time (Figure 2). The spike patterns coincided with the sample change where He/Ar gas dynamics were disturbed, a longer wait time between sample change and data collection would minimize the spike pattern. However, the signal response change from solid signals was captured in the liquid standard, where 115In intensity was used for time-drift correction.
Concentrations of Na, Al, Si, and Ca are basically the same for the four reference materials (NIST SRM 610, 612, 614, and 616), which contain sixty-one trace elements in a glass matrix, in concentrations reported by Kurosawa et al. [13]. Therefore, no standard curve was made for these four elements. Figure 3 shows the standard curves for nine other elements. Linearity can be observed for most of the elements, but Mg, Mn, and Pbdeviate some from a linear relationship. In calibration with multi-reference materials, segmented linear coefficients were thus used for Mg, Mn, and Pb.
3.2. Calibration Results with the Internal Standard (IS) Method
Aluminum was selected as the internal standard element, because it is contained in many minerals in these geological samples. Ki was calculated based on  for each reference material. Calibrated concentrations at 5 to 6 spots were averaged and then compared to the certified or measured concentrations for each sample (from USGS or literature) to calculate relative deviation [(calibrated concentration—certified concentration)/certified concentration]. Figure 4 shows the results calibrated with SRM 610. The IS method should generate the same overestimation or under-estimation for different elements, if the fractionations are the same for the references and samples. A consistently substantial over-estimation (>100%) is observed for Si for approximately one-third of the rock samples. The maximum is 648% (Basalt BCR-2). Conversely, a consistent underestimation is observed for Mn and Mg in most rocks samples. This indicates that the fractionation of these elements is different between the reference materials and samples. Other calculations fall in the range between –100% and 400%, while 82.1% of the calculations are within ±100%. The results are similar with the other NIST calibration standards (Table 3).
Figure 5 shows the relative standard deviation (of 5 to 6 spots for each sample) for the LA-ICP-MS measurements with SRM 610 as the calibration standard. Substantial heterogeneity (>20%) can be observed for many elements in most of the samples. Quartz latite QLO-1 shows the least heterogeneity (relative standard deviation <20% except for Mg), while granite G-2 and basalt BCR-2 have larger heterogeneity, with many elements having relative standard deviation >100%. The obtained heterogeneity can be attributed to the inherent heterogeneity of the rock samples and/or the artificial heterogeneity caused by the IS method; more discussion is provided at Section 3.3.
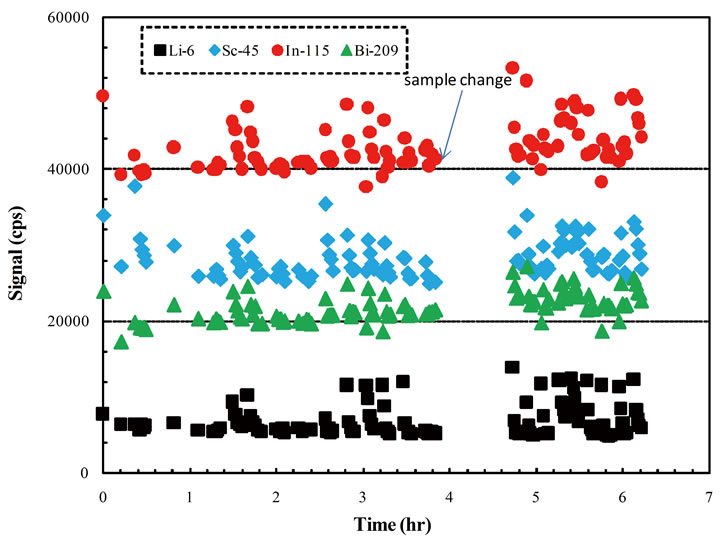
Figure 2. Time drift of four liquid internal standards.
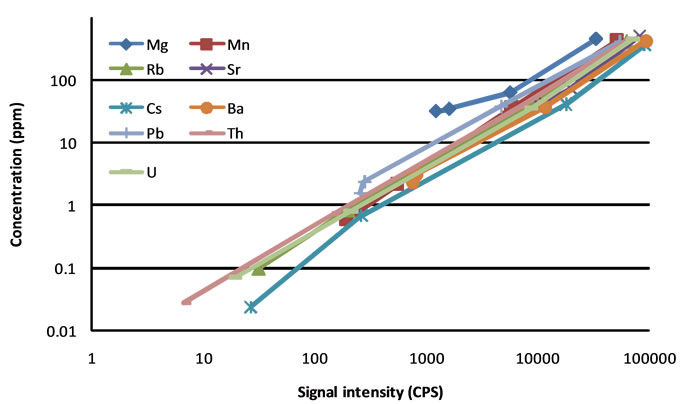
Figure 3. Signal intensity and concentration relationships of nine elements in four SRMs (from high to low concentrations: SRM 610, 612, 614, and 616).
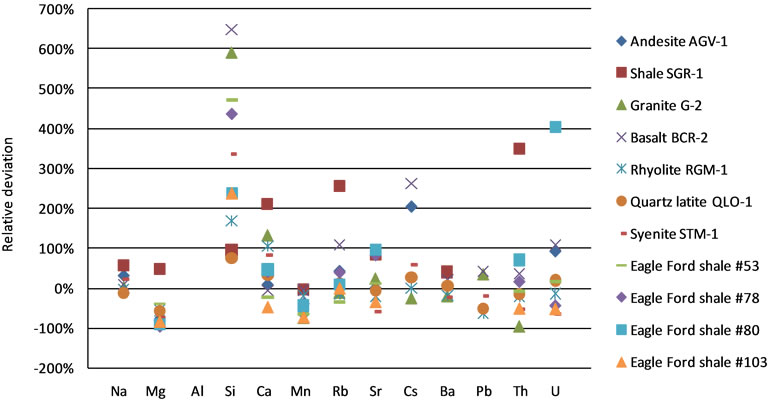
Figure 4. Relative deviation of the calibrated concentrations by IS method with SRM 610 for eleven rock samples.
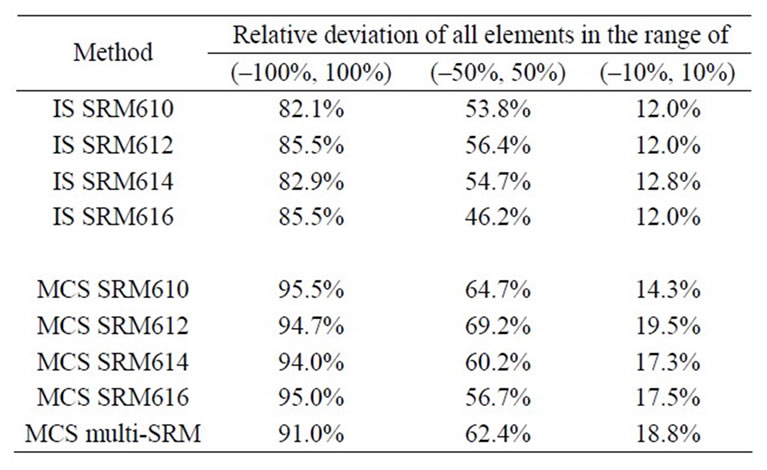
Table 3. Relative deviation obtained from IS and MCS methods with different SRM reference materials.
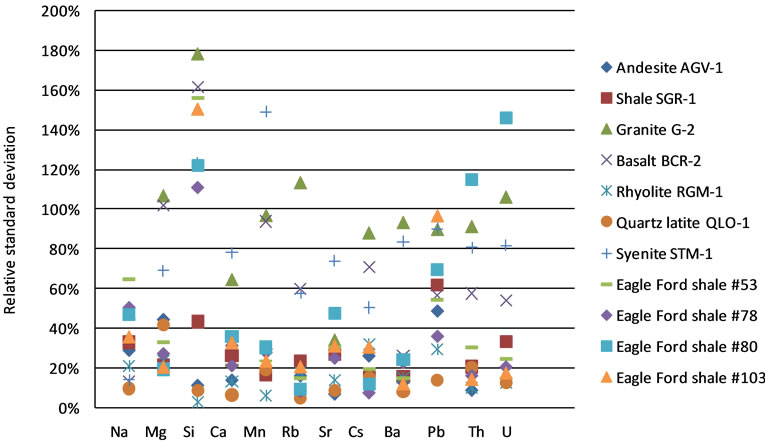
Figure 5. Relative standard deviation of LA-ICP-MS measurements calibrated by IS method with SRM 610 for eleven rock samples.
3.3. Calibration Results with the Modified Constant-Sum Method
Figure 6 shows the relative deviation obtained with MCS method using SRM 610 as the reference material. All data fall in the range –100% to 250%, a much narrower range than that from the IS method. Calibrations with the other reference materials produced similar results, statistics for which are presented in Table 2. Calibration using all four reference materials produced more results within ±10%; however, it did not improve performance within the ranges of ±50% and ±100%. This is expected for elements with a good linearity in the reference materials. For elements with segmented linearities, the similar performance is caused by the fact that the certified and measured concentrations of Mg (2000 - 10,000 ppm) and Mn (100 - 700 ppm) in these rock samples are in the range between SRM 610 and 612. Only Pb has concentrations (4 - 30 ppm) spanning three reference materials (SRM 610, 612, and 614). Therefore, the segmentation method did not show its advantage.
The relative standard deviation of the measurement calibrated by MCS method with SRM 610 as reference material is shown in Figure 7. As in Figure 5, quartz latite QLO-1 has the most uniform elemental distribution, while granite G-2 and basalt BCR-2 show the greatest heterogeneity. However, the relative standard deviation is generally smaller with MCS method than that with IS method. This indicates that t the IS method may overestimate the inherent heterogeneity.
The average magnitude of relative deviation (the absolute value of the relative deviation) of all measured elements was calculated for both IS and MCS methods, with SRM 610 as the reference material, to facilitate the overall performance comparison of these two methods. Figure 8 shows the results. The MCS method generally produced better accuracy, and also obtained more stable performance than the IS method; however, the average magnitude of relative deviation of quartz latite QLO-1 is slightly smaller with IS method (28.4%) than with MCS method (35.0%). This indicates for very uniform samples, IS method can work better than MCS method.
3.4. Discussion
Both IS and MCS methods generated larger deviations from the known concentrations than those reported in other studies (e.g., within ±10% in [11] and [14]). Several issues may contribute to these large deviations. In both above-mentioned works, reference glasses and minerals
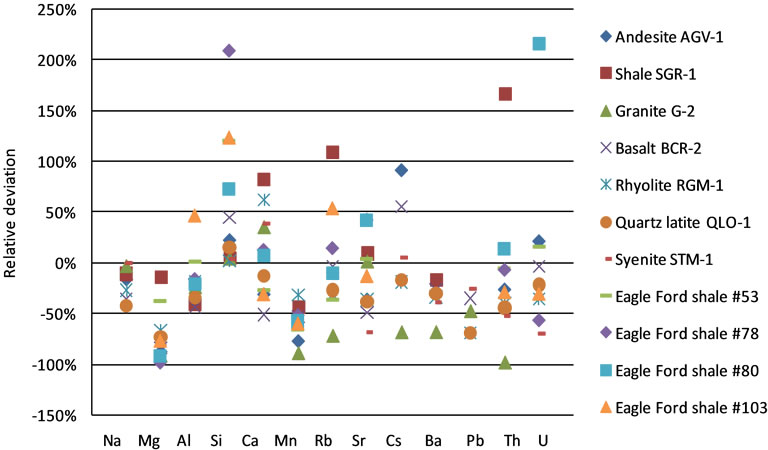
Figure 6. Relative deviation of the calibrated concentrations by MCS method with SRM 610 for eleven rock samples.
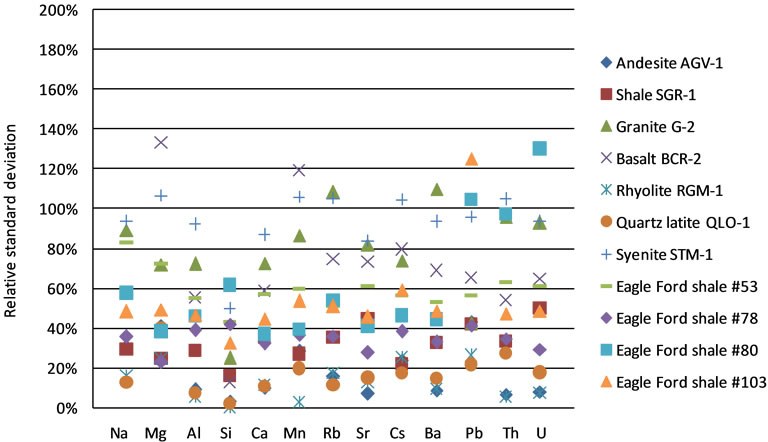
Figure 7. Relative standard deviation of LA-ICP-MS measurement calibrated by MCS method with SRM 610 for eleven rock samples.
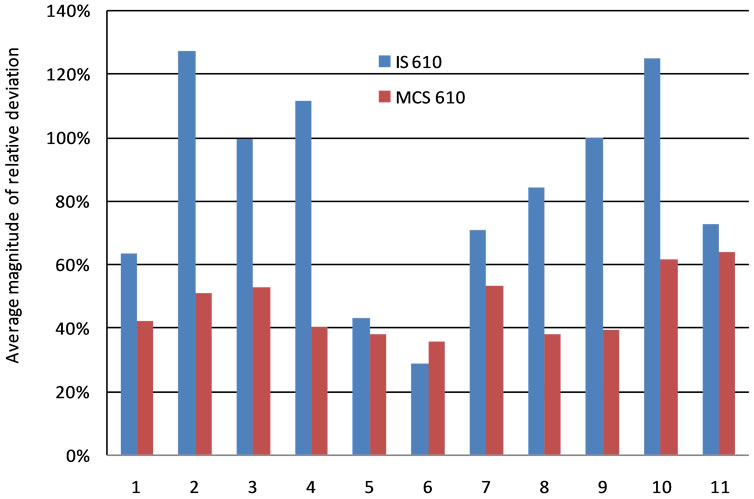
Figure 8. Average magnitude of relative deviations from IS and MCS methods for eleven rock samples. The average magnitudes of relative deviations were calculated as the average of the absolute values of the relative deviations of all the measured elements. The rocks from 1 to 11 are: Andesite AGV-1, Shale SGR-1, Granite G-2, Basalt BCR-2, RhyoliteRGM-1, Quartz latite QLO-1, SyeniteSTM-1, Eagle Ford shale #53, Eagle Ford shale #78, Eagle Ford shale #80, and Eagle Ford shale #103.
were used, rather than intact rock samples with their inherent spatial heterogeneity (Figures 4 and 6). The use of NIST SRM series glasses, which were suggested by some researchers to be not homogeneous (e.g., [15]), can also contribute to the larger deviation. In addition, this work used the spot analyses of a limited laser pulse of 20 which sampled a small volume, compared to line scans that most LA-ICP-MS method papers employed (including [14]). Furthermore, a quadruple ICP-MS and UV-213 nm laser ablation system were used in this work; these are more readily available in a research lab than sectorfield ICP-MS and Excimer 193 nm laser used in other studies.
4. Conclusions
A modified constant-sum (MCS) calibration method was developed based on eight major elements (Na, Mg, Al, Si, Ca, Fe, K, and Mn), the sum of which is relatively constant among twelve different rock samples (51.8% ± 1.1%). Compared to the internal standard (IS) method, where a single element is used as the basis for calibration, the sum of six elements is more uniformly distributed spatially in geological samples and therefore can serve as a better basis for calibration, especially for samples with large heterogeneity at the scale of the laser spot. Both IS and MCS methods were applied for eleven rock samples with known elemental concentrations using LA-ICP-MS to test their performance. In addition, a comparison with different reference materials was also made among NIST SRM 610, 612, 614, and 616.
Both IS and MCS methods generated larger relative deviation compared to those reported in the literature. Heterogeneity of element distribution in the spot size scale in these intact rock samples is considered the most important contributing factor. Comparison between IS and MCS methods showed that generally the MCS produced better accuracy than the IS method. IS method generated large deviation from measured concentrations, especially for major elements such as Si (e.g., 648% for Basalt BCR-2 with SRM 610). For the minor elements, the results were relatively better with the IS method. MCS method resulted in a smaller deviation, with approximately 95% of all the results within the range of ±100%, compared to ~85% with IS method. On the other hand, the MCS method generated more stable results for different rock samples than the IS method. The average magnitude of relative deviation with the reference material of SRM 610 ranged from 35% to 64% with MCS method, while from 28% to 552% with IS method. However, for the very homogeneous sample, quartz latite QLO-1, the average magnitude of relative deviation is smaller with the IS method than with the MCS method.
With different reference materials, either MCS method or IS method did not show much difference in the results. Multi-reference material calibration did not produce better accuracy with MCS method. Although it is usually a routine to run all reference materials of SRM 610, 612, 614, and 616 in LA-ICP-MS measurements, no preference with respect to the calibration can be made based on this study.
5. Acknowledgements
This work was financially supported by the University of Texas at Arlington and RPSEA through the “UltraDeepwater and Unconventional Natural Gas and Other Petroleum Resources” program authorized by the U.S. Energy Policy Act of 2005.RPSEA (www.rpsea.org) is a nonprofit corporation whose mission is to provide a stewardship role in ensuring the focused research, development and deployment of safe and environmentally responsible technology that can effectively deliver hydrocarbons from domestic resources to the citizens of the United States. RPSEA, operating as a consortium of premier U.S. energy research universities, industry, and independent research organizations, manages the program under a contract with the U.S. Department of Energy’s National Energy Technology Laboratory.
REFERENCES
- Q. Hu and A. Möri, “Radionuclide Transport in Fractured Granite Interface Zones,” Physics and Chemistry of the Earth, Vol. 33, No. 14-16, 2008, pp. 1042-1049. doi:10.1016/j.pce.2008.05.015
- R. E. Russo, X. L. Mao, H. C. Liu, J. Gonzalez and S. S. Mao, “Laser Ablation in Analytical Chemistry—A Review,” Talanta, Vol. 57, No. 3, 2002, pp. 425-451. doi:10.1016/S0039-9140(02)00053-X
- H. P. Longerich, “Laser Ablation-Inductively Coupled Plasma-Mass Spectrometry: An Introduction,” In: P. Sylvester, Ed., Laser-Ablation-ICP-MS in the Earth Sciences: Current Practices and Outstanding Issues, Mineralogical Association of Canada, Vol. 40, 2008, pp. 1-18.
- P. J. Sylvester, “LA-(MC)-ICP-MS Trends in 2006 and 2007 with Particular Emphasis on Measurement Uncertainties,” Geostandards and Geoanalytical Research, Vol. 32, No. 4, 2008, pp. 469-488. doi:10.1111/j.1751-908X.2008.00924.x
- S. E. Jackson, “Calibration Strategies for Elemental Analysis by LA-ICP-MS,” In: P. Sylvester, Ed., LaserAblation-ICP-MS in the Earth Sciences: Current Practices and Outstanding Issues, Mineralogical Association of Canada, Vol. 40, 2008, pp. 169-188.
- H. P. Longerich, S. E. Jackson and D. Günther, “Laser Ablation Inductively Coupled Plasma Mass Spectrometric Transient Signal Data Acqusition and Analyte Concentration Calculation,” Journal of Analytical Atomic Spectrometry, Vol. 11, No. 9, 1996, pp. 899-904. doi:10.1039/ja9961100899
- B. Gratuze, “Obsidian Characterization by LA-ICP-MS and Its Application to Prehistoric Trade in the Mediterranean and the Near East: Sources and Distribution of Obsidian within the Aegean and Anatolia,” Journal of Archaeological Science, Vol. 26, No. 8, 1999, pp. 869-881. doi:10.1006/jasc.1999.0459
- M. Guillong, K. Hametner, E. Reusser, S. A. Wilson and D. Günther, “Preliminary Characterization of New Glass Reference Materials (GSA-1G, GSC-1G, GSD-1G and GSE-1G) by Laser Ablation-Inductively Coupled PlasmaMass Spectrometry Using 193 nm, 213 nm and 266 nm Wavelengths,” Geostandards and Geoanalytical Research, Vol. 29, No. 3, 2005, pp. 315-331. doi:10.1111/j.1751-908X.2005.tb00903.x
- L. Halicz and D. Günther, “Quantitative Analysis of Silicates Using LA-ICP-MS with Liquid Calibration,” Journal of Analytical Atomic Spectrometry, Vol. 19, No. 12, 2004, pp. 1539-1545. doi:10.1039/b410132d
- J. E. Gagnon, B. J. Fryer, I. M. Samson and A. E. Williams-Jones, “Quantitative Analysis of Silicate Certified Reference Materials by LA-ICP-MS with and without an Internal Standard,” Journal of Analytical Atomic Spectrometry, Vol. 23, No. 11, 2008, pp. 1529-1537. doi:10.1039/b801807n
- Y. Liu, Z. Hu, S. Gao, D. Günther, J. Xu, C. Gao and H. Chen, “In Situ Analysis of Major and Trace Elements of Anhydrous Minerals by LA-ICP-MS without Applying an Internal Standard,” Chemical Geology, Vol. 257, No. 1-2, 2008, pp. 34-43. doi:10.1016/j.chemgeo.2008.08.004
- R. L. Rudnick and S. Gao, “Composition of the Continental Crust,” In: R. L. Rudnick, Ed., The Crust, Vol. 3, Treatise on Geochemistry, Elsevier-Pergamon, Oxford, 2003, pp. 1-64.
- M. Kurosawa, S. E. Jackson and S. Sueno, “Trace Element Analysis of NIST SRM 614 and 616 Glass Reference Materials by Laser Ablation Microprobe-Inductively Coupled Plasma-Mass Spectrometry,” Geostandards Newsletter, Vol. 26, No. 1, 2002, pp. 75-84. doi:10.1111/j.1751-908X.2002.tb00625.x
- M. Humayun, F.A. Davis and M. M. Hirschmann, “Major Element Analysis of Natural Silicates by Laser Ablation ICP-MS,” Journal of Analytical Atomic Spectrometry, Vol. 25, No. 7, 2010, pp. 998-1025. doi:10.1039/c001391a
- K. Jochum, U. Weis, B. Stoll, D. Kuzmin, Q. Yang, I. Raczek, D. Jacob, A. Stracke, K. Birbaum, D. Frick, D. Günther and J. Enzweiler, “Determination of Reference Values for NIST SRM 610-617 Glasses Following ISO Guidelines,” Geostandards and Geoanalytical Research, Vol. 35, No. 4, 2011, pp. 397-429.
NOTES
*Author Contribution: S. Peng performed the data analysis, including LA-ICP-MS data correction and calibration, and took the lead in writing the manuscript. Q. Hu conducted the LA-ICP-MS experiments and data extraction, and revised the manuscript.
#Corresponding author.