Modeling and Numerical Simulation of Material Science
Vol.3 No.4(2013), Article ID:38457,5 pages DOI:10.4236/mnsms.2013.34024
Behavioural Modelling of Lips Seal Made with Polytetrafluoroethylene Enriched by Glass Fibers
1Materials and Hydrology Laboratory, Department of Mechanical Engineering, Djillali Liabes University, Sidi Bel Abbes, Algeria
2Materials and Hydrology Laboratory, Department of Civil Engineering, Djillali Liabes University, Sidi Bel Abbes, Algeria
Email: *bounazef@yahoo.com
Copyright © 2013 Ali Djeffal et al. This is an open access article distributed under the Creative Commons Attribution License, which permits unrestricted use, distribution, and reproduction in any medium, provided the original work is properly cited.
Received August 20, 2013; revised September 24, 2013; accepted October 12, 2013
Keywords: Composite material; Friction; Wear; Glass fibers; Design of experiments; Modelling
ABSTRACT
Polytetrafluoroethylene reinforced with glass fibers is a composite material widely used in industry mainly for the manufacture of seals at the level of the rotary shafts of vehicles and stationary floor machines such as turbines and compressors. However, due to elastic and viscous-plastic properties of this material, it wears quickly under the influence of some external parameters during operation. There is therefore material loss, increased clearance and loss of sealing. This work summarises a series of tests carried out with this material in order to analyse the variation of the friction coefficient due to the roughness of the work piece brought into contact with the PTFE, the linear velocity of contact between them and material yield strength. To do this analysis, we used the method of unconventional design of experiments to model the behaviour of material and consequently make decisions to reduce this wear. The results are shown and deeply analysed in the following text as a polynomial mathematical model, graphs, contours and response surfaces illustrating the holding of this material under the effect of the three parameters mentioned above. The previous PTFE samples enriched with chopped glass fibers are not subjected to axially force this time, contrary to the force applied radially. The advantage of this method is the relative linear velocity at the contact sample-disc and the applied pressure remains constant. Under the action of the weight “P” applied on the sample, it comes into friction with the rotating disc whose roughness changes from experience to another; it is expressed by the values of Ra. Tangential friction force appears at the point of contact and is equilibrated by measured force Fm on the lever. The calculation of the moment relative bench axis caused by 2 forces gives the coefficient of friction. Knowing the values of frictional force Ft by calculation and the weight P, we determine then the friction coefficient.
1. Bench Testing and Experimental Part
Contrary to what was done before, the samples of PTFE enriched with chopped glass fibers were not subjected this time by axially force or pressure, but by radially force (Figure 1). The advantage of this method is that the relative linear velocity at the contact of seal and disk and the applied pressure remain constant [1,2].
2. Mounting of the Test Piece System
Under the action of the weight applied to the top of the sample, it rubs with the rotating disk. Roughness changes from experiment to another; it is expressed by the measures of “Ra”. A tangential frictional force Ft appears at the point of contact, and is balanced by Fm force. It is applied on the lever and measured by an electronic dynamometer. Calculating the moment relative to rotating axis caused by these 2 forces, we obtain the value of fric-

Figure 1. Test bench.
tion force. Knowing the values of the frictional force and weight, then it determines the friction coefficient μ.
3. Experimental Tests
To apply the method of design of experiments, 37 experiments were carried in which three external parameters change values [3,4]. These are the roughness of the disk that depends on the rate of the PTFE [5-7] fibers in which “Ra” is 0.2 µm and 0.6 µm, the rotational disk speed that predetermines the linear velocity at the contact point between sample and disc, it varies from 0.1 m/s to 71.7 m/s and finally the material characteristic namely the yield point (Elastic limit) that varies between 0.525 MPa to 4.994 MPa. These experiments were performed by varying three parameters at the same time following specific process to create necessary conditions to form a matrix of unconventional design of experiments. We conducted 37 experiments and calculate the friction coefficients; the results vary from 0.0466 to 0.3431 and are represented in responses of experiments column. As shown in table 1, the responses are obviously the average of 3 consecutive tests conducted in the same working conditions without changing the parameter values.
4. Interpretation of Results
The interpretation is based on the mathematical model obtained in polynomial form that takes into account in its action, the surface roughness “Ra” with the variable x1, the elastic limit of the material with variable x2, and the linear velocity with x3 variable. Other terms of the polynomial model are the interaction between three parameters that act simultaneously on the friction coefficient “μ”. The mathematical model is composed of seven monomials that add between them, interprets the response “y” that represents the coefficient of friction under the action of the algebraic sum of the three parameters and their interactions; the response takes following form in Equation (1):
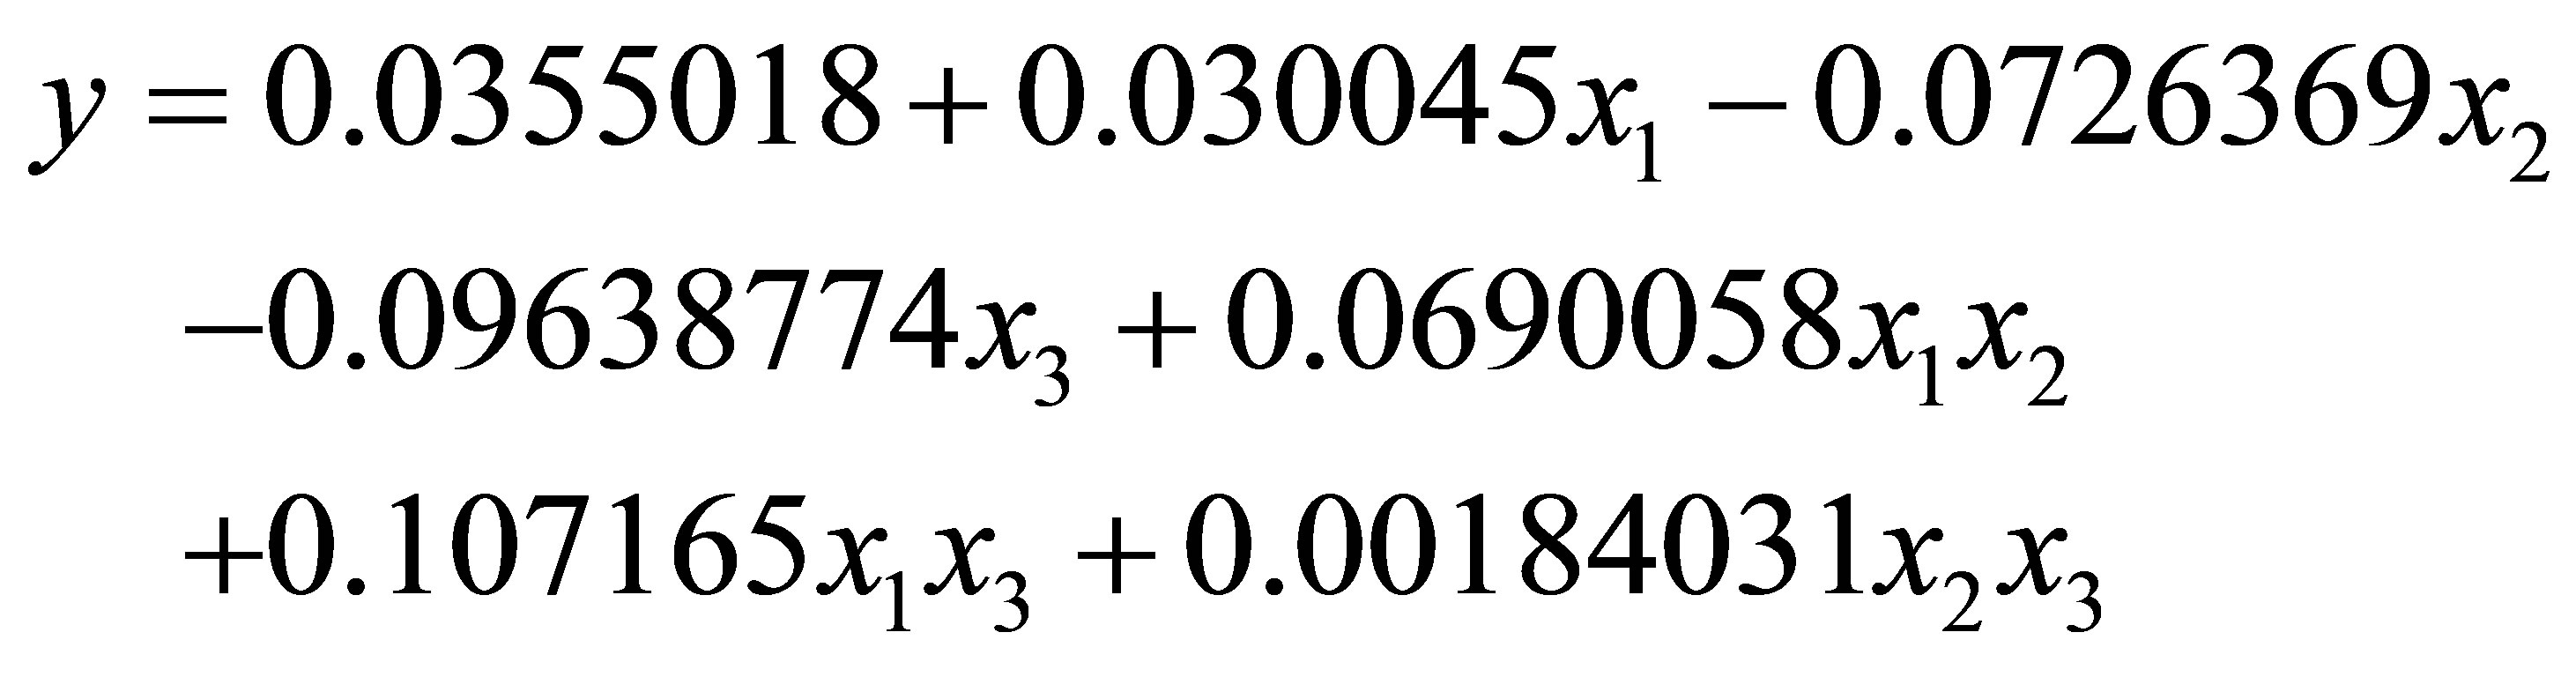 (1)
(1)
At first sight, we see that increasing of disc roughness “Ra” increases the coefficient of friction “μ“ by the positive coefficient of x1, while the increase of the elastic limit of the material in passing from sample to another, and the linear speed at the point of contact are reduced by the negative sign of the terms in the polynomial. The final action depends of course on the simultaneous actions of the three parameters and their interactions.
Figure 2 shows how the values of 37 experimental points are deviated compared to the calculated values using the mathematical model. It was found that the largest
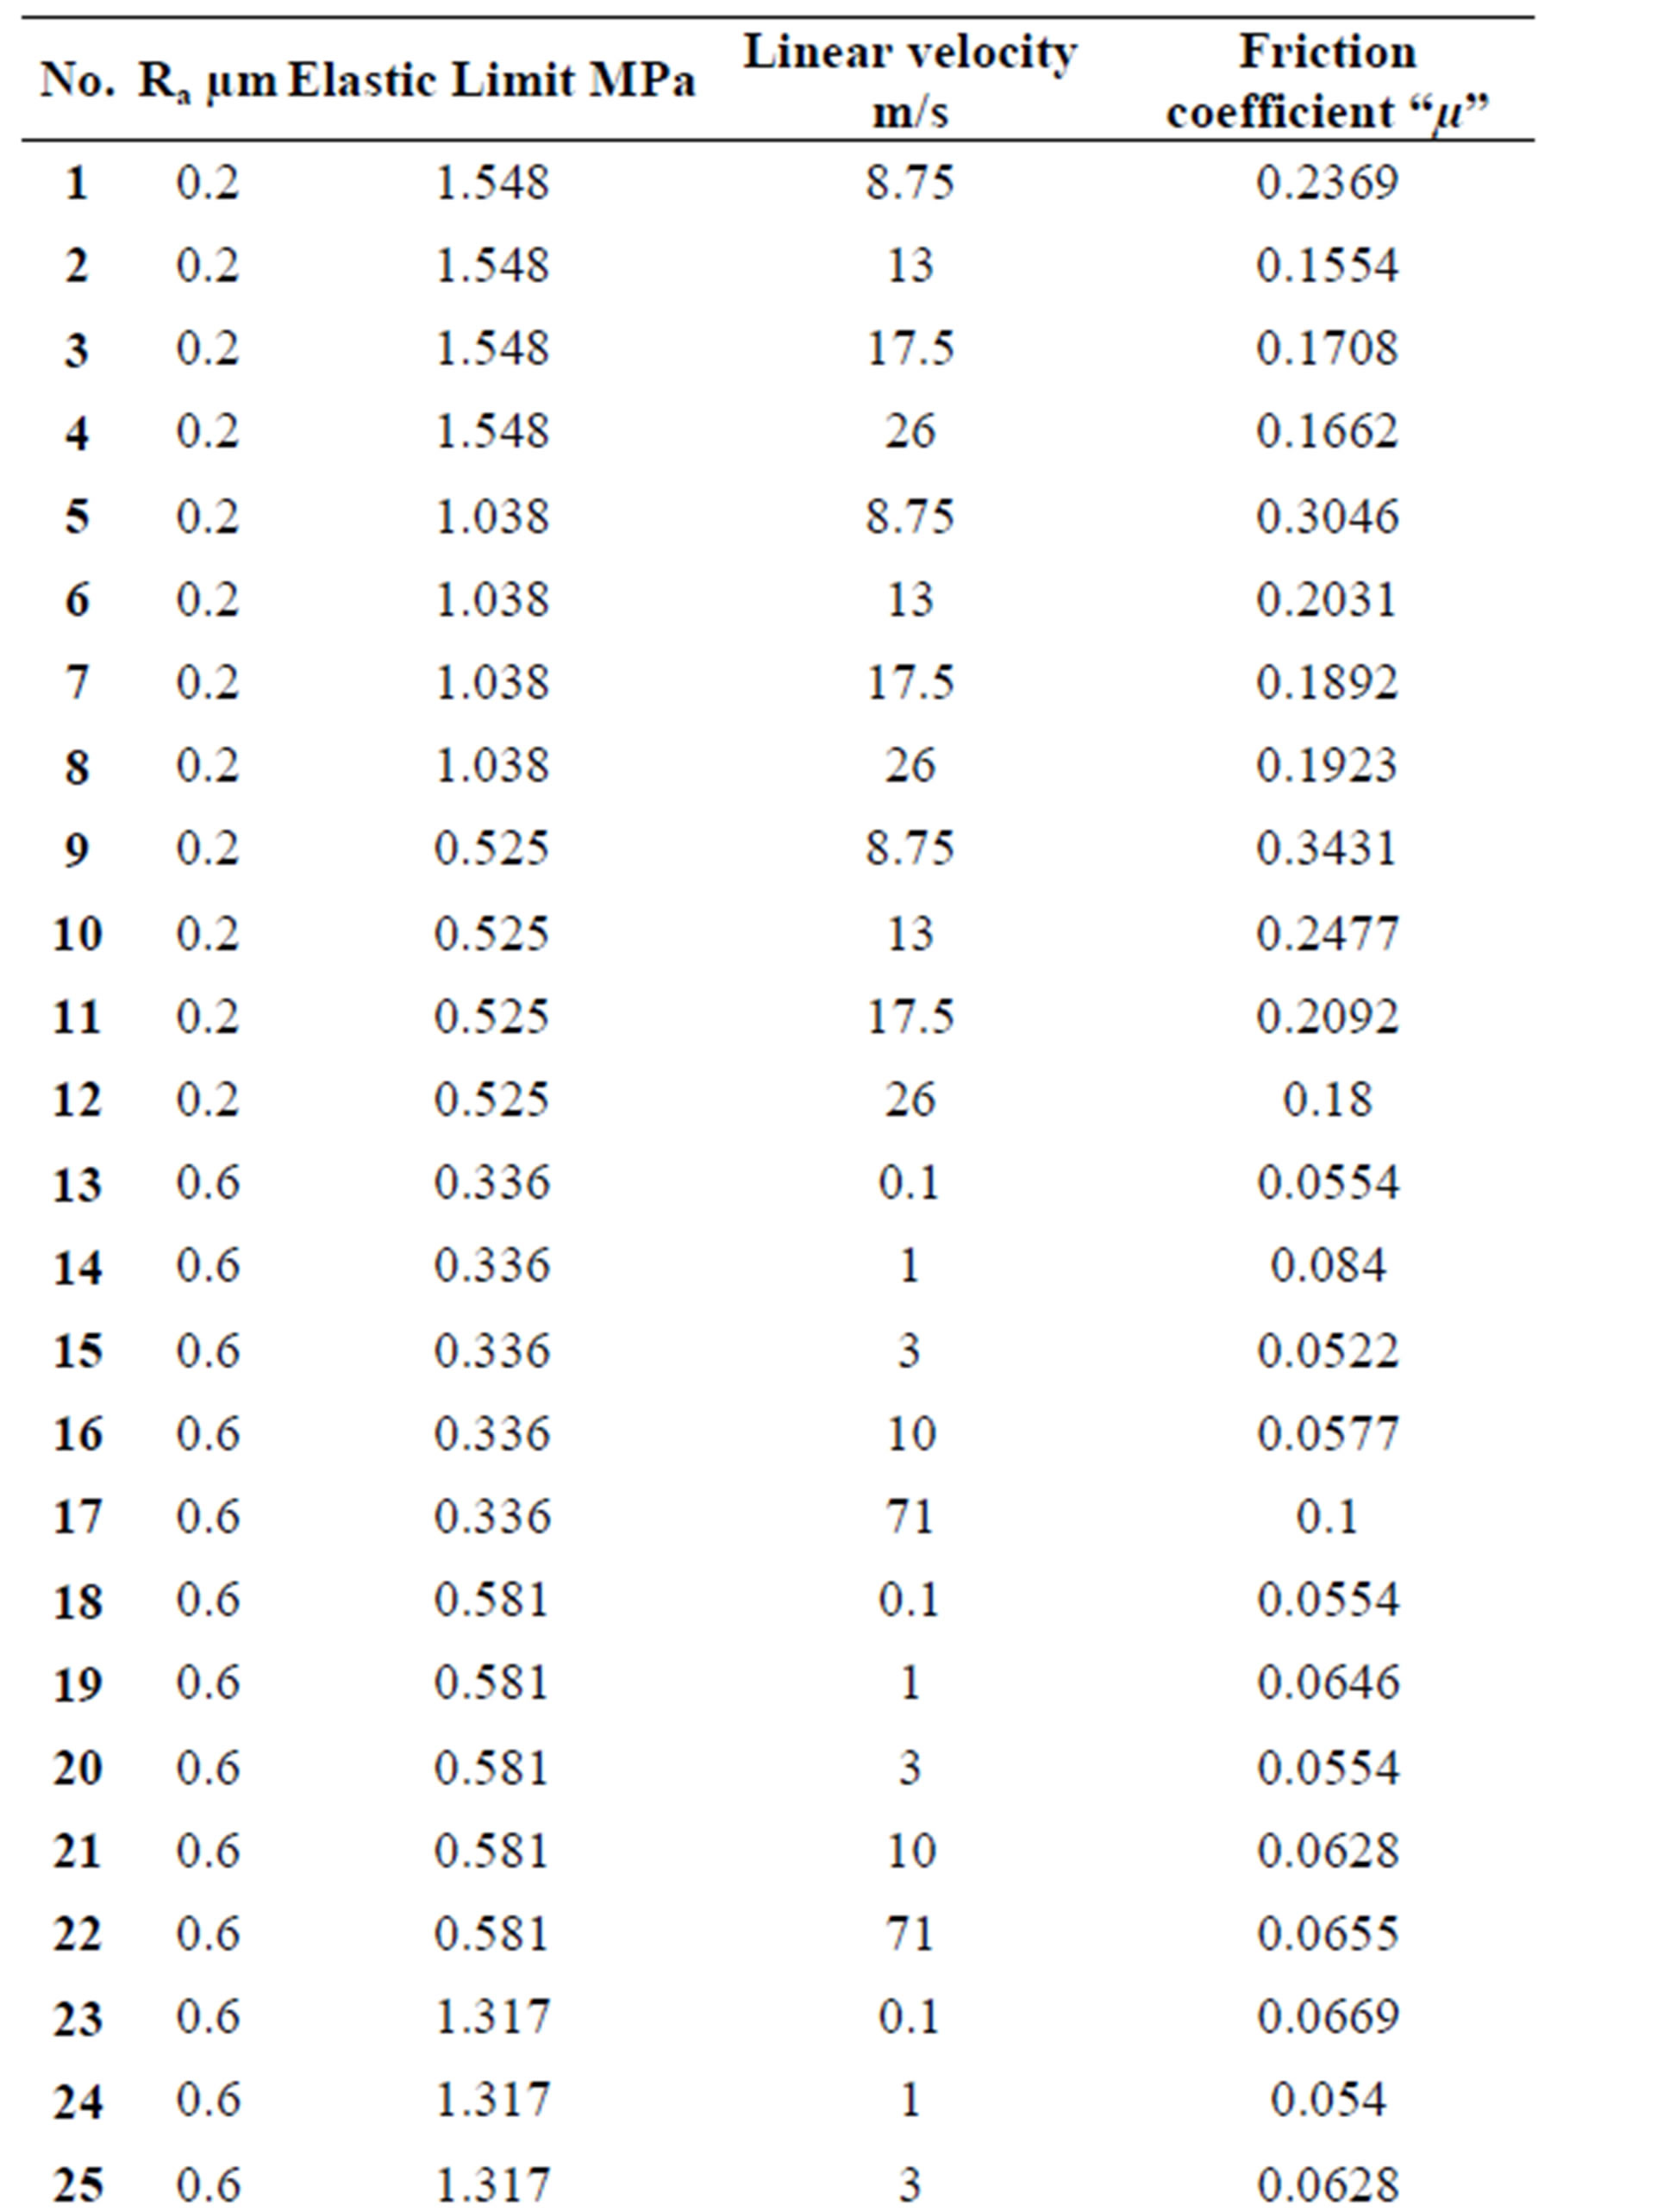
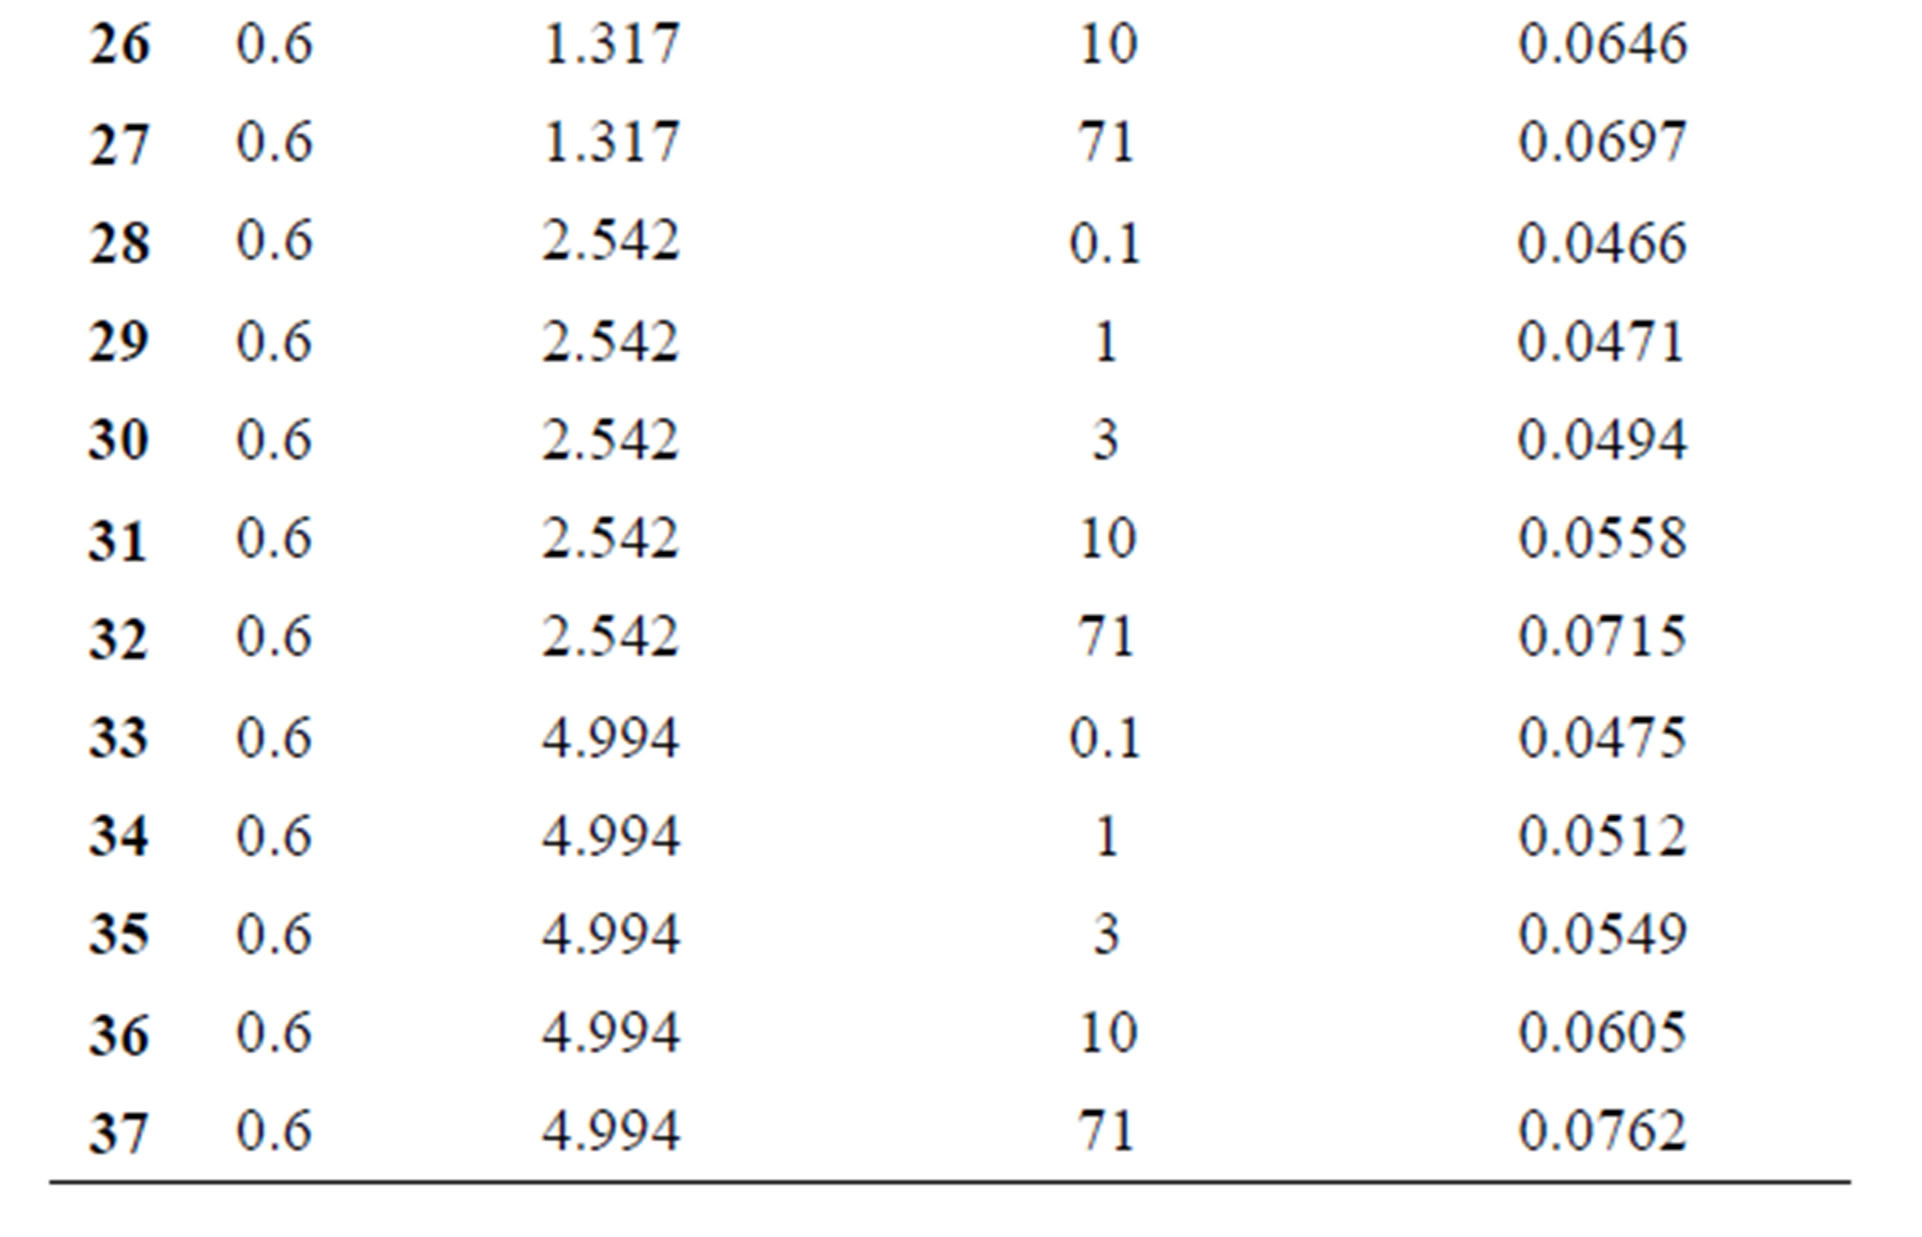
Table 1. Experiments design matrix.
deviation is recorded at the experience number 17 where it reaches 0.0518425 or 15.1% of the measured value, while the small deviation is 0.000609618 at experience number 21 or 0.97% of the measured value.
The contours are the projections of the response surface; they illustrate how the coefficient of friction varies according to variation of disc roughness and its linear velocity. It is evident that negative values are obtained only by the mathematical model, so they are rejected for a physical meaning. Smaller values of the coefficient of friction are obtained for large values of linear velocity
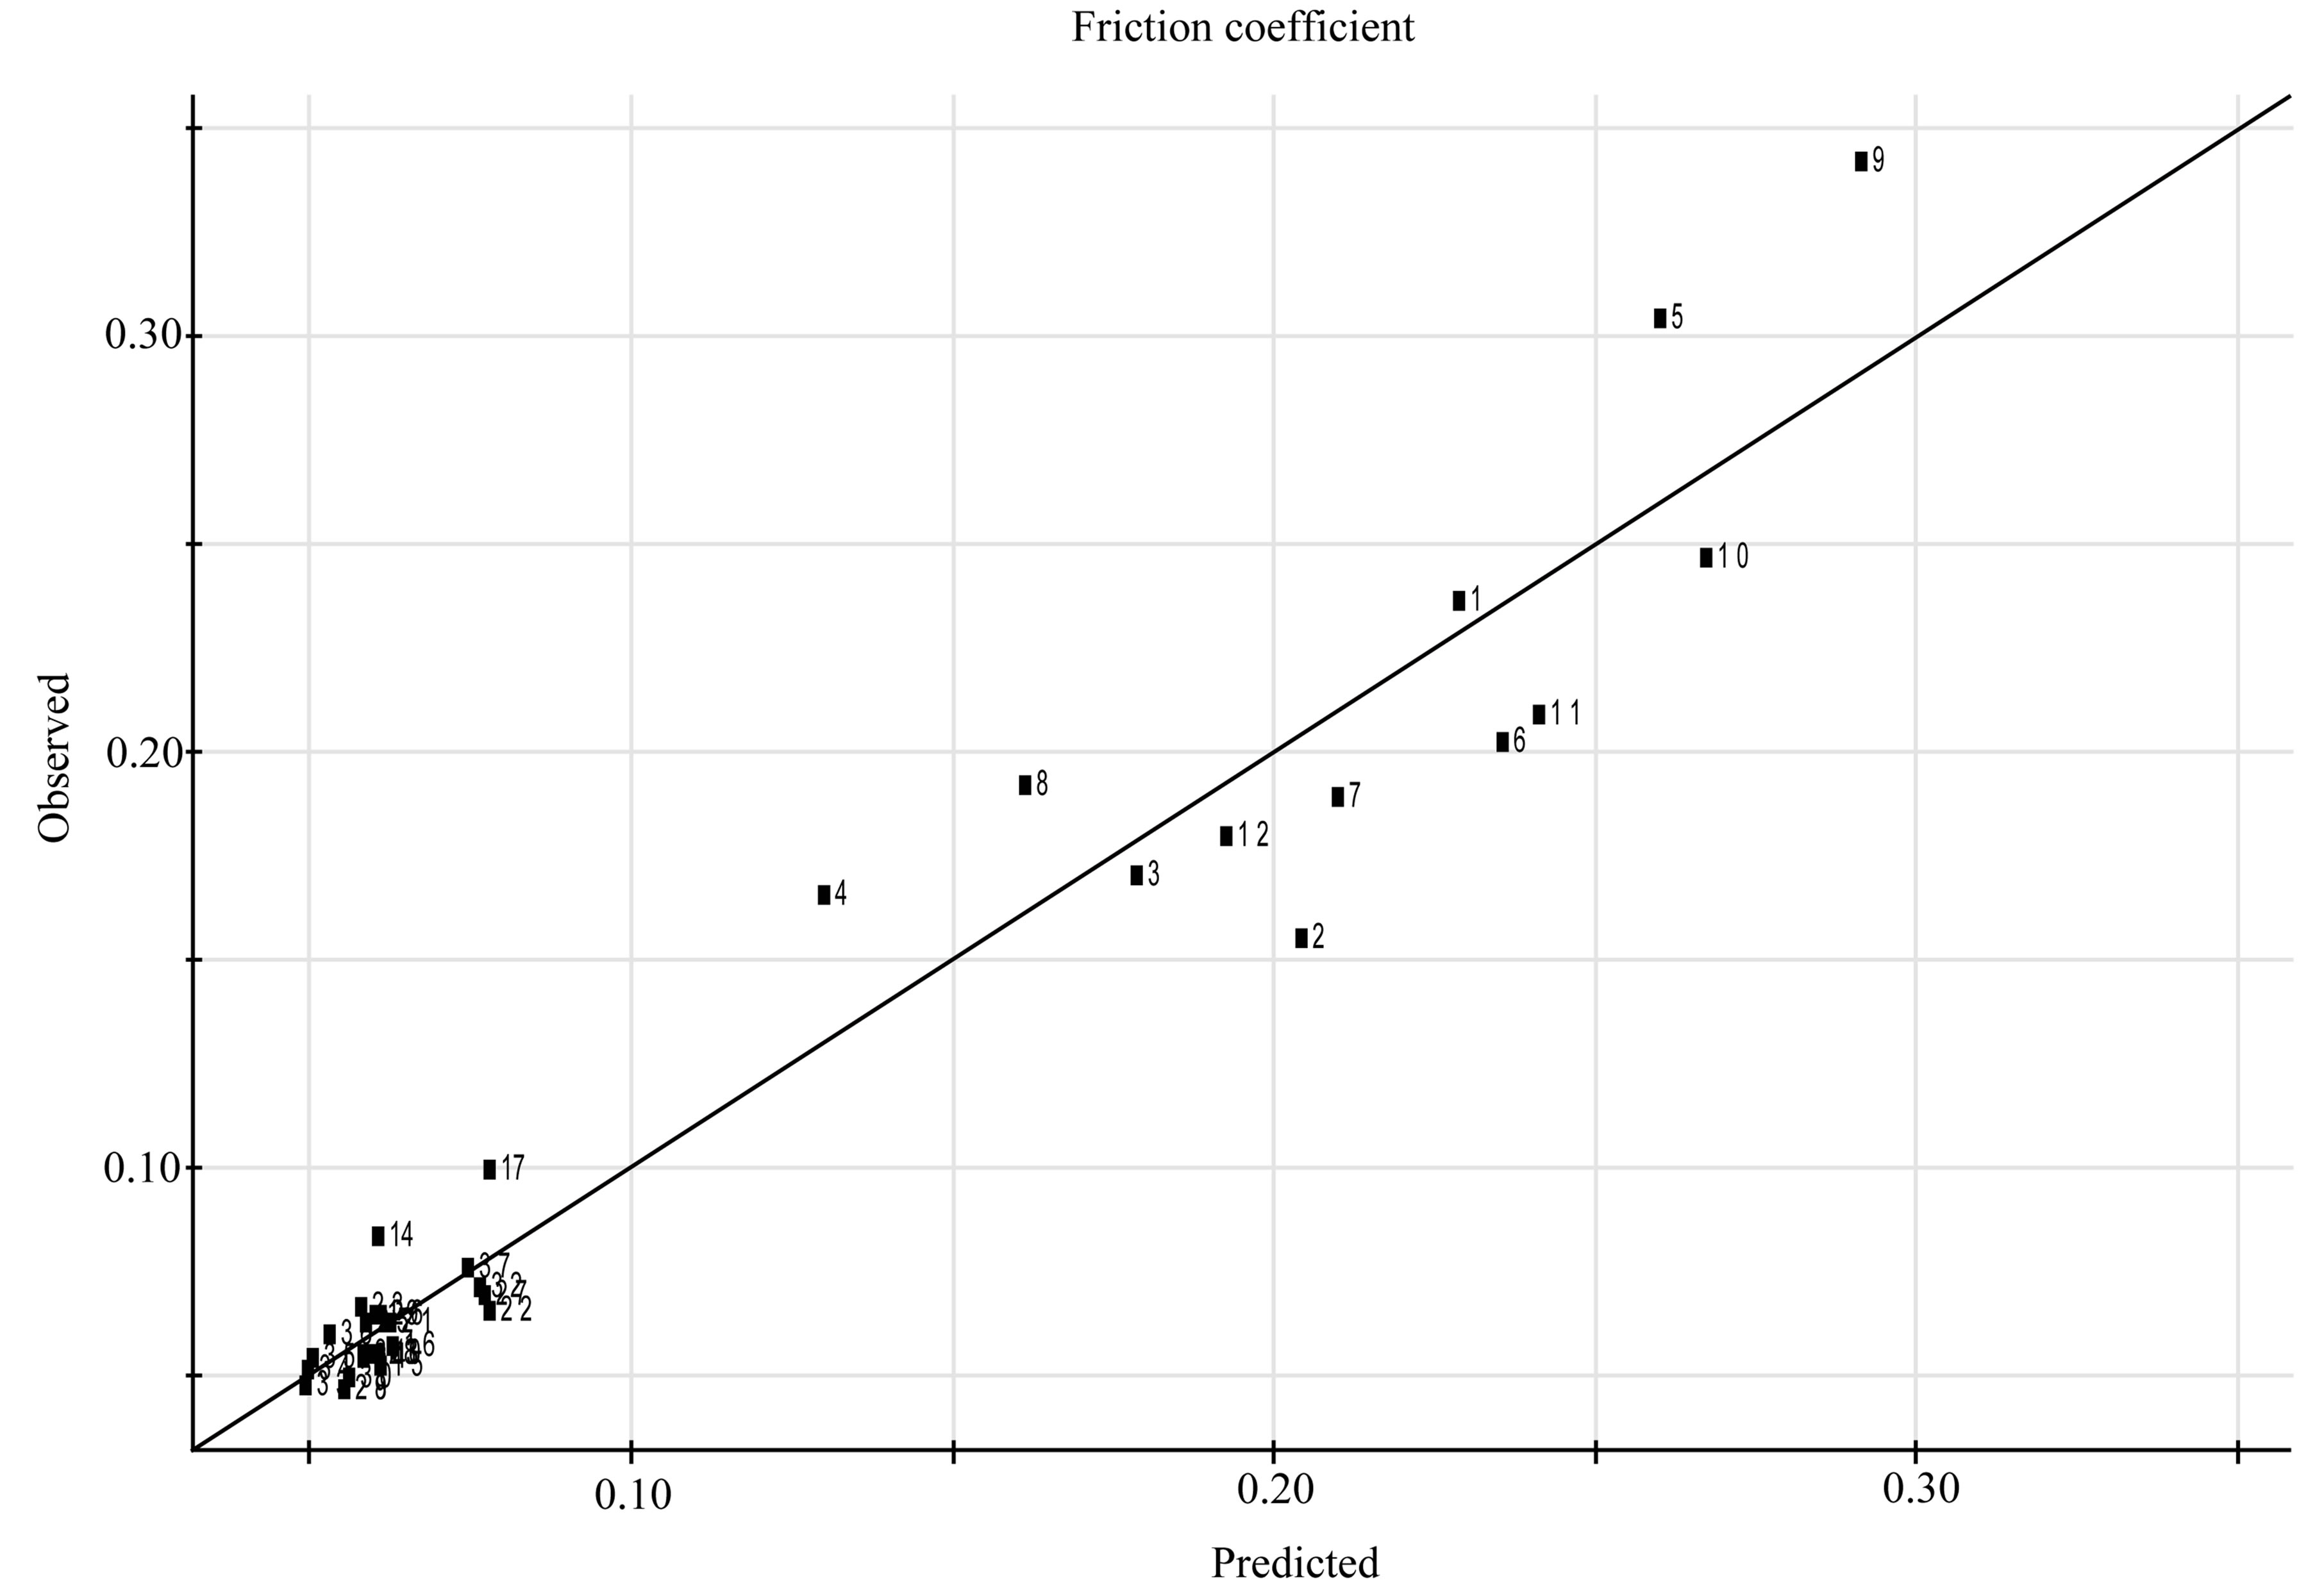
Figure 2. Deviations of experimental points compared with mathematical model.
combined with small roughness values of the disc (Figure 3).
The contour that defines the coefficient of friction of 0.012 is the positive limit values, beyond, these are negative values, and they do not really existing. It is delimited by a roughness of 0.2 microns and velocity of 35 m/s and again roughness of 0.51 and linear velocity of contact point of 70 m/s (Figure 4).
For a material with high yield strength compared to previous cases, the behaviour is completely different (Figure 5). For all velocities exceed 13 m/s, the friction coefficient is theoretical negative. We just interest on the positive areas of the graph. We notice that for velocities below 10 m/s and despite the increase in the roughness of the disk from 0.2 microns to 0.4 microns, the friction coefficient remains stable because the contours are horizontal (contours from 0.019 to 0.05 µm). Beyond 0.4 microns roughness, the vertical contours become the friction coefficient is stable. The explanation that we have given for three values of the elastic limit of the material can be done to several experimental values. Only it will become too expensive if the number of experiments increases considerably. The mathematical model through the response surfaces and contours allows do. Beyond this value range, the model converges and does not adequately describe the material behaviour. So far, we have treated cases where two parameters act simultaneously while the 3rd remains constant (yield) for three values, minimum, median and maximum values. Now, to know the effect of three parameters simultaneously and their interactions, we must return to the mathematical model expressed by Equation (1). It is sufficient to assign values to variables “xi” between the minimum and maximum to obtain values of “y” which then represent the coefficient of friction. The behaviour of the PTFE fortified by glass fibers behave as elastic-viscous-plastic material. It has the property of having relatively low coefficient of friction despite the presence of the reinforcing fibers. They are introduced into the matrix of material to increase the yield point and are used mainly as machines seal working in the conditions of temperature and pressure it supports. However with the increase of the specific property of the material, the friction coefficient changes, added to that, the interactions with the two other parameters. When the elastic limit is 0.336 MPa, the coefficient of friction reaches very low values. In the recommended working zone visible on the graph (Figure 3) displaying fairly low friction coefficients is bounded by lines isoresponse between 0.002 and 0.062. The conditions giving rise to the area below the line isoresponse of 0.082 should be avoided. When the elastic limit is 2.665 MPa (Figure 4), the recommended working area is delimited by the lines isoresponse 0.012 and 0.054. Negative values of the friction coefficient have no physical
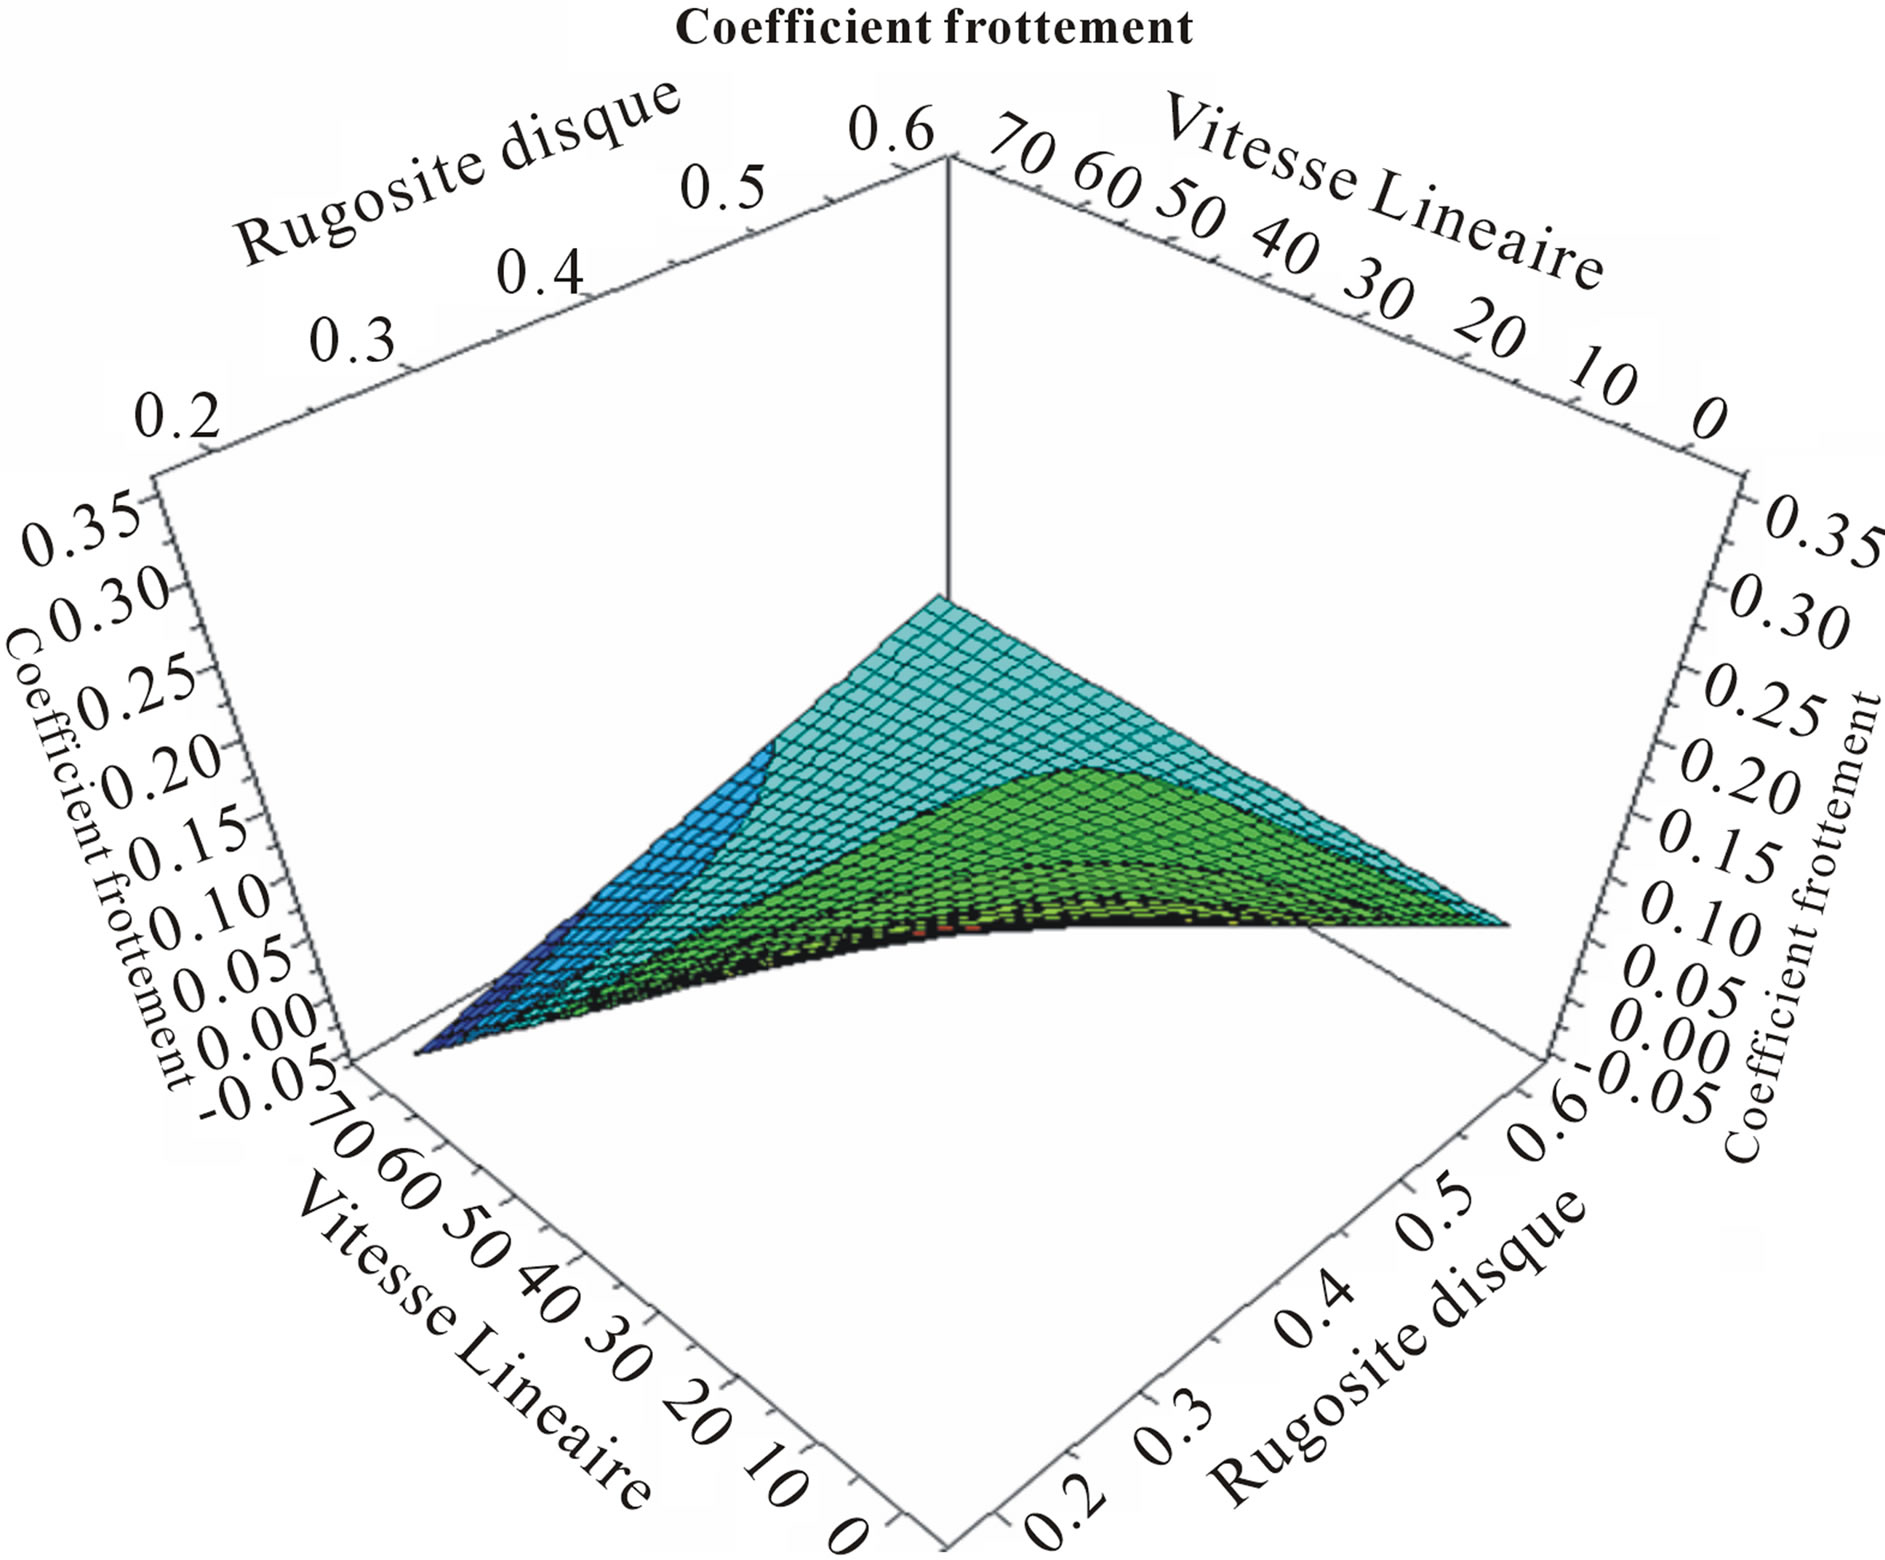

Figure 3. Response surface and contours for minimum yield strength of 0.336 MPa.
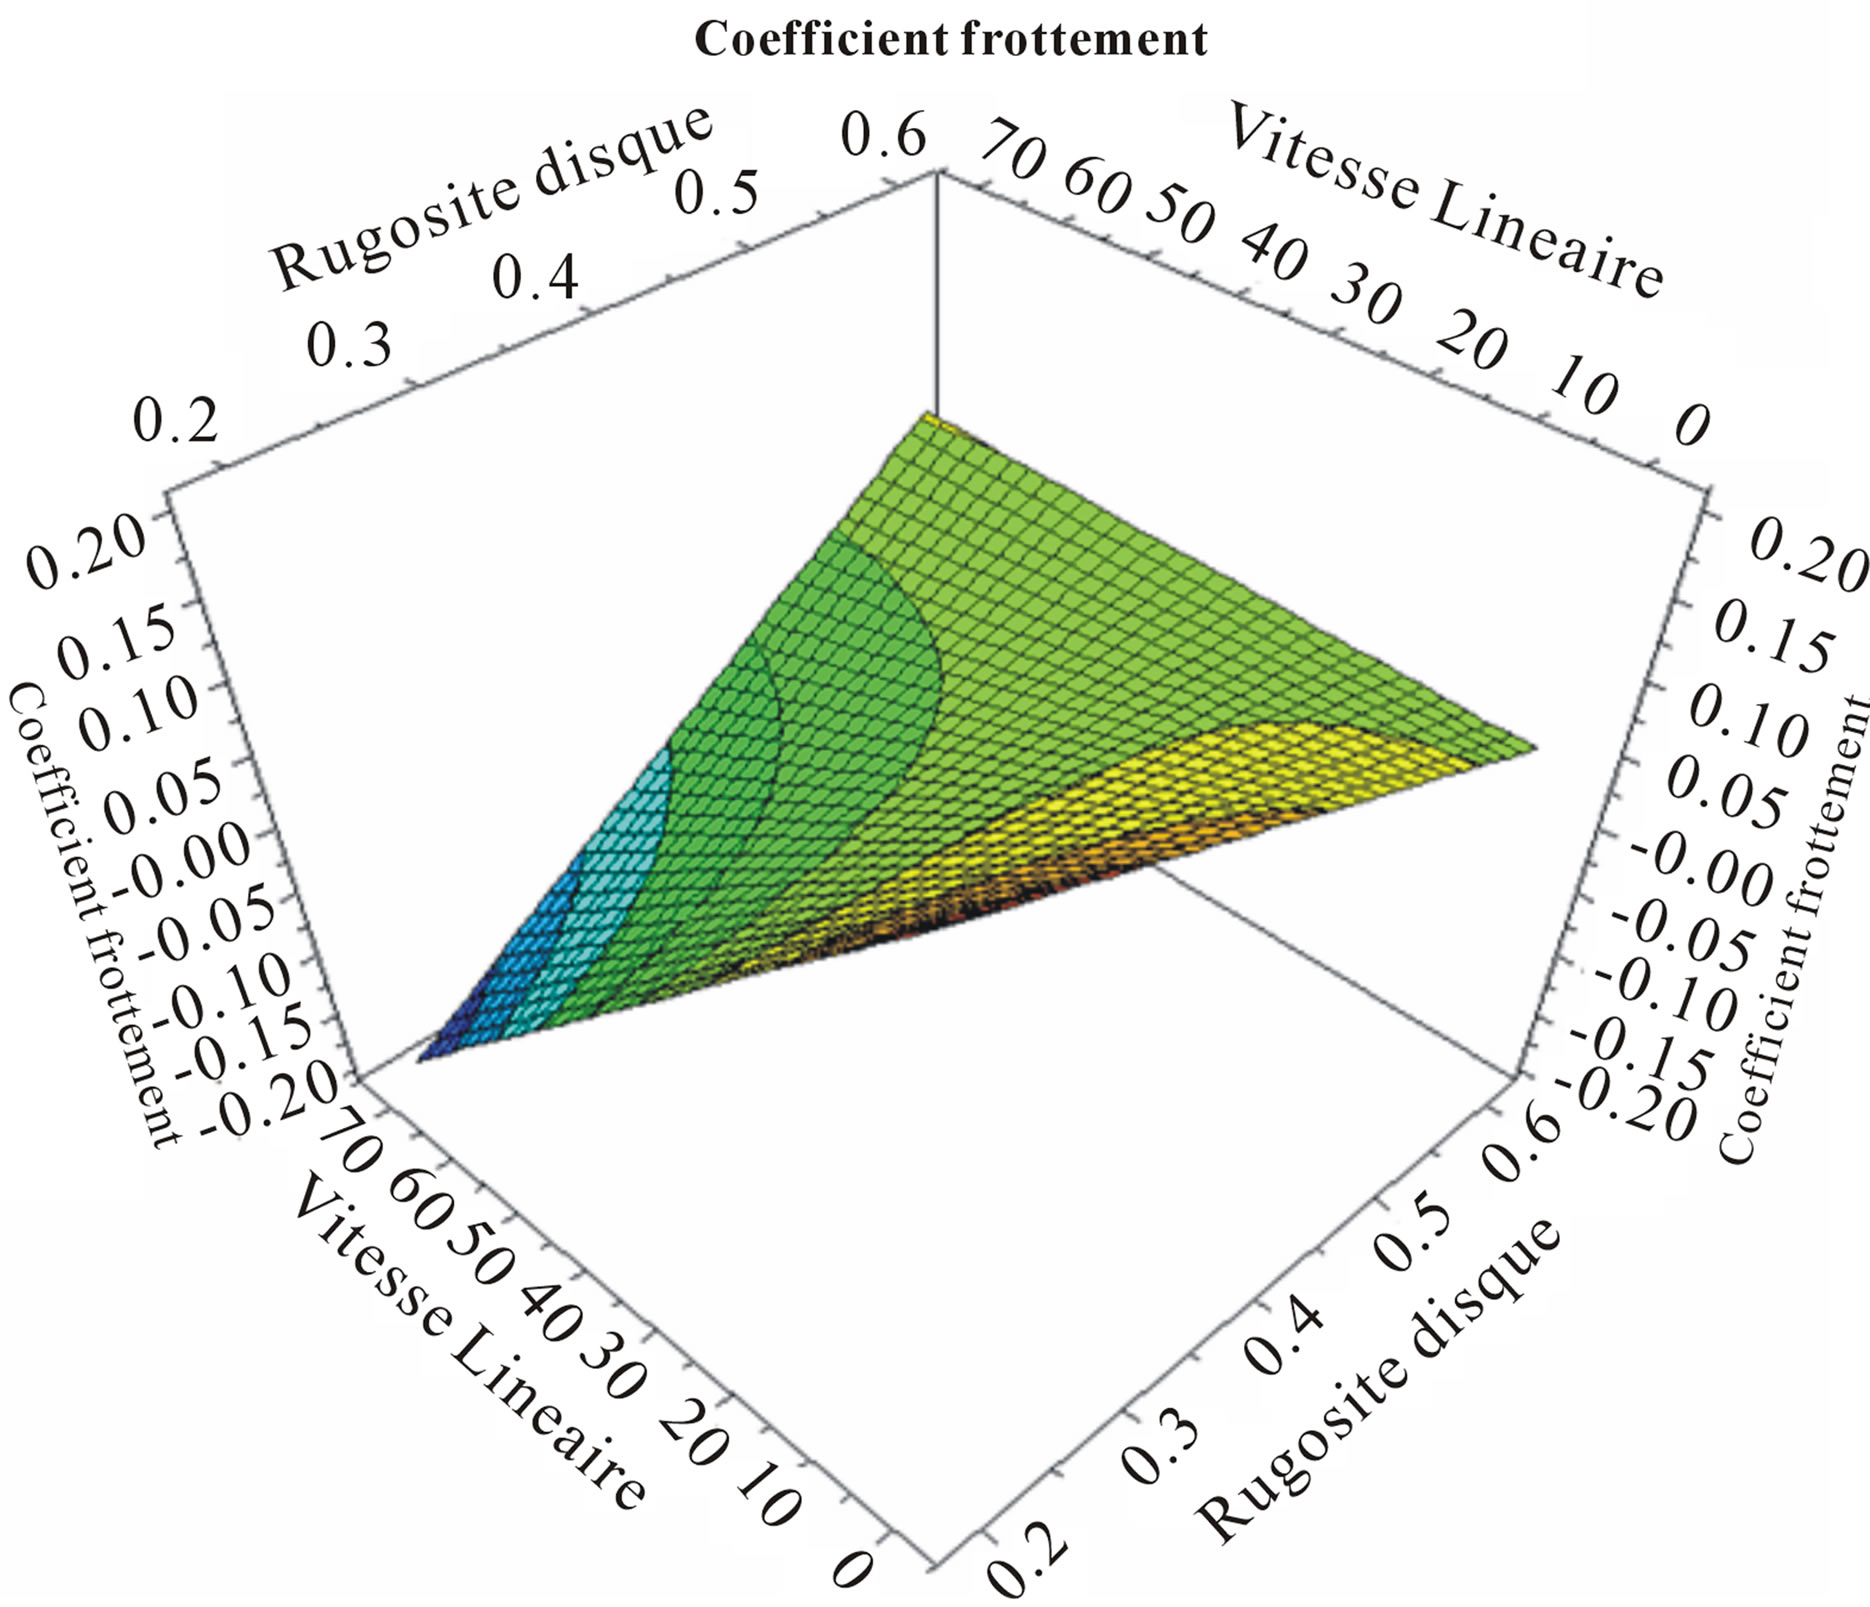
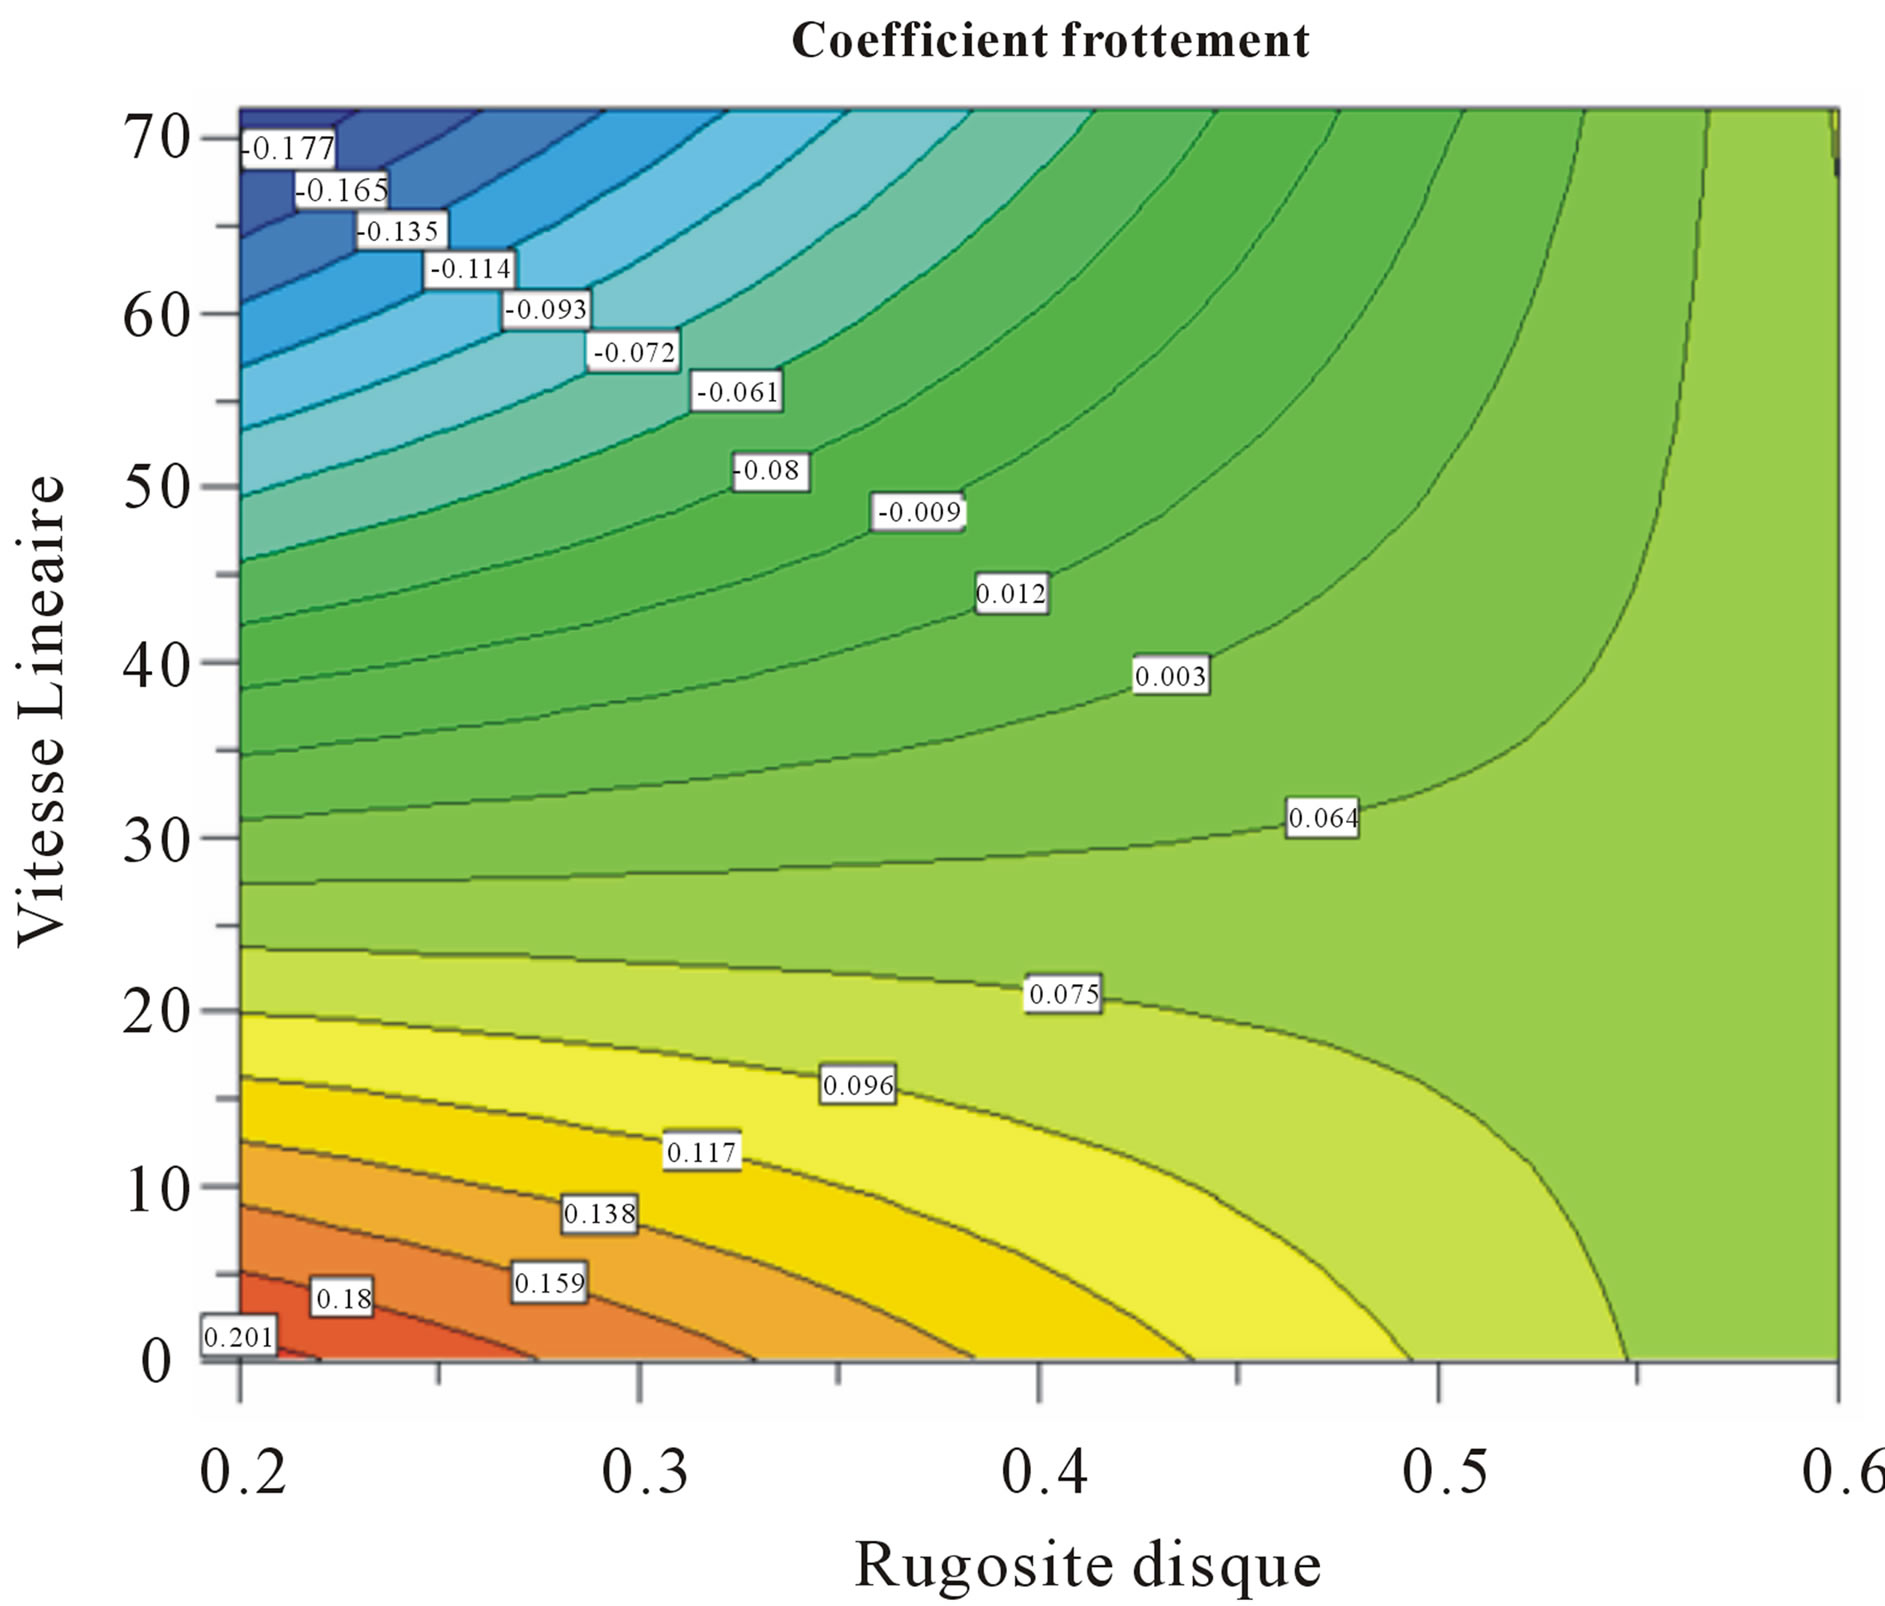
Figure 4. Response surface and contours for middle yield strength of 2.665 MPa.
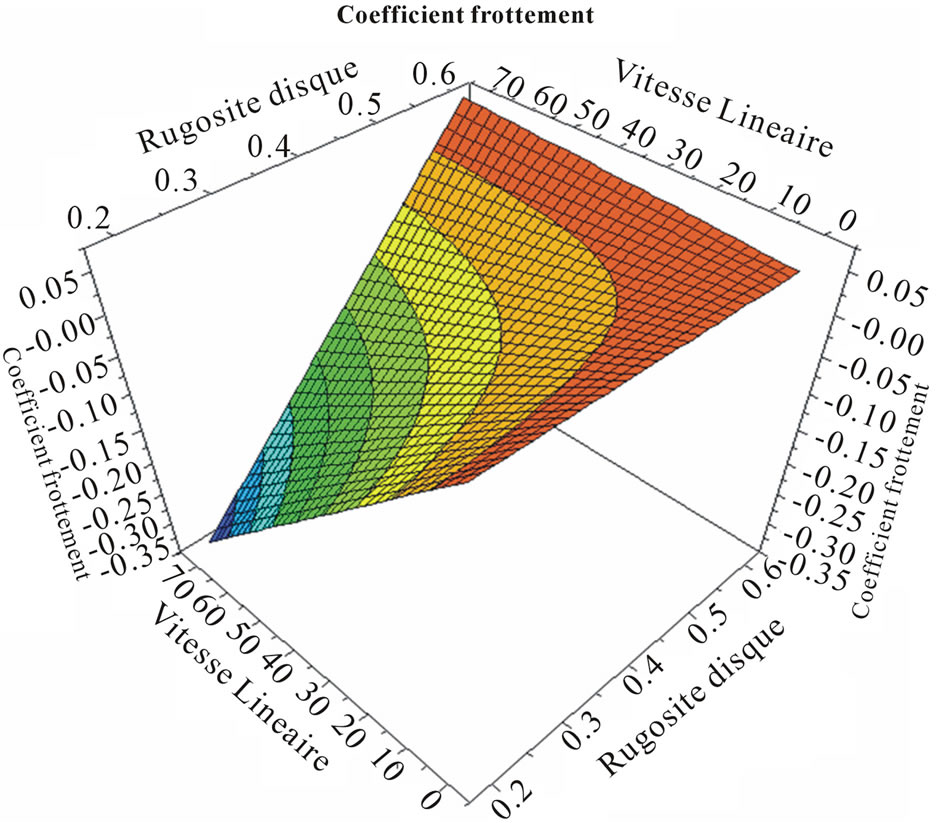

Figure 5. Response surface and contours for maximum yield strength of 4.994 MPa.
meaning, they are rejected. Other coefficient values are high; the working conditions that do appear are avoided (Below a linear velocity of 30 m/s combined roughness of the disk from 0.2 µm to 0.55 µm). When the elastic limit is high i.e. 4.994 MPa (Figure 5), the recommended working area is situated under line isoresponse of –0.002; in other words, the linear velocity must be below 12.1 m/s for values range of disc roughness ranging from 0.2 µm to 0.6 µm. In this last case, great majority of the surface includes negative values, they are physically rejected.
5. Conclusion
The tightness in machineries and equipments by a lip seal of Polytetrafluoroethylene and reinforced by glass fibers which are cut into tiny filaments is ensured by its industrial lifetime depending on the conditions of work and its yield. Its use is interesting because, in addition to the fairly low coefficient of friction, it can withstand at temperatures beyond the common industrial temperature (–150˚C - 250˚C). However, PTFE has some known drawbacks industry. The implementation is special and difficult and it cannot be melt-processed (it is non-moldable material on conventional processing). It is formed by a sintering method. PTFE degrades at 400˚C and is close to its transformation temperature (380˚C), with the release of hydrofluoric acid (corrosive) and gaseous monomer.
REFERENCES
- L. M. Keer, Y. Xu, H. S. Cheng and J. L. Xuan, “Simulation of Wear Particle Creation in Asperity Contacts Using the Finite Element Method,” Tribology Transactions, Vol. 36, No. 4, 1993, pp. 613-620. http://dx.doi.org/10.1080/10402009308983202
- K. Maekawa and M. Maeda, “Simulation Analysis of Three-Dimensional Continuous Chip, Formation Process,” Seimitsu Kogaku Kaishir Journal of the Japan Society for Precision Engineering, Vol. 59, No. 11, 1993.
- R. A. Fischer, “Statistical Methods for Research Workers,” Oliver and Boyd, London, 1925.
- D. Benoist, Y. Tourbier and S. Germain-Tourbier, “Plan d’Expérience: Construction et Analyse,” Tec & Doc. Lavoisier, French Edition, Paris, 1994.
- Chr. Hoffmann, “Untersuchungen an PTFE-Wellen-Dichtunge,” Dissertation, University Stuttgart, Germany, 1995.
- M. W. J. Lewis, “Friction and Wear of PTFE-Based Reciprocating Seals,” ASLE Preprint, No. 84-LC-6A-2, ASLErASME Lubrication, San Diego, 22-24 October, 1984.
- H. Sui, H. Pohl, A. Oppermann, U. Schomburg, G. Upper and F. Hatch, “Material and Computational Analysis of PTFE Seals, SAE Paper Series 951055,” International Congress and Exposition, Detroit, 27 February-2 March, 1995.
NOTES
*Corresponding author.