Journal of Geoscience and Environment Protection
Vol.04 No.01(2016), Article ID:62751,7 pages
10.4236/gep.2016.41012
Analysis of Mountain Rangeland Changes, Using Remotely-Sensed Data, (Case Study: Dehdez Area, Iran)
Ali A. Torahi1, Elham Manuchehri2
1Department of Remote Sensing and GIS, Faculty of Geographical Sciences, Kharazmi University, Tehran, Iran
2Natural Resources Engineering (Range Management), Isfahan University of Technology, Isfahan, Iran

Copyright © 2016 by authors and Scientific Research Publishing Inc.
This work is licensed under the Creative Commons Attribution International License (CC BY).
http://creativecommons.org/licenses/by/4.0/


Received 16 March 2015; accepted 11 January 2016; published 14 January 2016
ABSTRACT
The land-cover dynamics has been quite conspicuous over the last three decades in Dehdez area, Iran. Therefore, the present study was undertaken in the Dehdez area to assess the trends of rangelands dynamics in the study area during the period 1990-2006. Two clear, cloud-free Landsat and one ASTER images were selected to classify the study area. All images were rectified to UTM zone 39, WGS84 using at least 25 well distributed ground control points and nearest neighbor resampling. Land-use/cover mapping is achieved through interpretation of Landsat TM satellite images of 1990, 1998 and ASTER image of 2006. Fieldwork was carried out to collect data for training and validating land-use/cover interpretation from satellite image of 2006, and for qualitative description of the characteristics of each land-use/cover class. In order to create a testing sample set, first of all, a set of testing points was selected randomly. A supervised classification technique with Maximum Likelihood Algorithm was applied based on 48 training samples for the image of 2006, and 42 samples for the images of 1990 and 1998 and the land-use/cover maps were produced. Error matrices were used to assess classification accuracy. The results showed rangeland covers about 30.8%, 36.7% and 45% of the total geographical area of the Dehdez area in 1990, 1998 and 2006, respectively. Overall accuracies of land-use/cover classification for 1990, 1998 and 2006 were 89.37%, 75.24% and 71.14%, respectively. Kappa values obtained were of 78.71%, 55.61% and 51.41% of accuracy for the 1990, 1998 and 2006, respectively. During 16 years span period (1990-2006) about 1738.4 ha, 383.7 ha, 32.8 ha and 890.1 ha of rangelands were converted to forest, agriculture, water and settlement. The total rich rangelands in the area, accounted for 38.5%, 44% and 42.2% in 1990, 1998 and 2006, respectively. The total poor rangeland in the area accounted for 61.5%, 56% and 57.8% in 1990, 1998 and 2006, respectively. Satellite Remote Sensing enabled the generation of a detailed rangeland map and the separation of grazing intensity levels in rangelands could be generated with the relatively little effort in areas that were difficult to access.
Keywords:
Rangeland, Changes, Remote Sensing, Dehdez, Iran

1. Introduction
On an area basis, rangelands contribute significantly to the world’s land surface and an important share is devoted to grazing. Management of these areas alters drastically their natural characteristics [1] . With increasing livestock, pressure on natural and semi-natural rangelands is also increased. But not all range types have the same production potential. Destruction of rangeland is mainly related to overpopulation. To enhance food production, grasslands possessing fertile soils have been ploughed and converted to agricultural lands [2] . Three syndromes, i.e., desertification, woody encroachment, and deforestation are inherent to global grazing. These syndromes have widespread and differential effects on the structure, biochemistry, hydrology and biosphere- atmosphere exchange of grazed ecosystems as well as represent a major component of global environmental change [3] . Managing the rangelands represents a major shift in thinking and practice. In some parts of the world leading many to believe this is the required stimuli to develop a sustainable rangelands management approach [4] . There is an increasing need for better management of rangelands in developing countries in view of the alarming depletion causing by population pressure, agricultural expansion, and misuse of rangelands [5] . Basic to the implementation of any rangelands management strategy, whether it is for assessment and allocation to sustainable uses or for rehabilitation of rangelands and denudate lands, is a clear understanding of how much natural resources there are, where they are located, and their present condition [6] . Knowledge of the rangelands and its geographical environment are essential for proper planning of sustainable rangelands management. To meet those requirements, precise and up-to-date information regarding the status of the rangelands and potential of rangelands rehabilitation is important to upgrade and to design proper management for future improvement of the rangelands [7] . Several studies report successful mapping of rangelands in arid and semi-arid environments as well as in temperate areas based on remotely sensed data based on remotely sensed data [8] . In tropical and subtropical areas, attempts to classify land-cover have been performed [9] . In the study area, raring cattle are a very important economic activity and continuous grazing all year round is possible at almost all sites [10] . Hence, precise land-cover information and a quantification of the study area are required. The present study was undertaken in the Dehdez area to assess the trends of rangelands dynamics in the study area during the period 1990-2006.
2. Study Area
The study was carried out in Dehdez area that is located in the southern part of Iran and in south-eastern Khuzestan province between the 50˚12'14'' to 50˚33'25''E and 31˚35'05'' to 31˚58'12''N (Figure 1). The area consists of hills and mountains and less of gentle slope. The altitude ranges from 580 to 3000m asl and covers an area of 512 Km2. Mainly three forest types are dominating in the area. They are Amygdalus scoparia, Quercus persica and Pistacia attlantica forest. Quercus sp. (Quercus persica) forest is pioneer and dominant forest species of this area [10] . The area is covered by forest, shrub land, agriculture, settlements, villages, riverbeds and water body. On the basis of literature, there are different soils in the study area. Three main order of soil can be seen in the area, consist of Mollisols, Entisols, Inseptisol and Alfisols [11] . Different lithology in parent material on mountains and hills are seen that make a top sequence with different slopes. On the steep slopes, the soils are shallow with high drainage and highly affected by erosion, coarse texture with high gravels.
3. Methodology
3.1. Image Pre-Processing
Two clear, cloud-free Landsat and one ASTER images were selected to classify the study area: June 17, 1990; May 18, 1998 and June 21, 2006. The Dehdez area is entirely contained within Landsat and ASTER path 164, row 38. All images were rectified to UTM zone 39, WGS84 using at least 25 well distributed ground control points and nearest neighbor resampling. The root mean square errors were less than 0.25 pixel (7.5 m) for each

Figure 1. Location map of Dehdez in Khuzestan province, Iran.
of the three images. Image processing was performed using ENVI 4.5. Land-use/cover mapping is achieved through interpretation of Landsat TM satellite images of 1990, 1998 and ASTER image of 2006.
3.2. Image Classification
Training
Classification scheme was based on the land cover and land use classification system developed by [12] for interpretation of remote sensor data at various scales and resolutions. Based on the Anderson land-use/cover classification system, the land-use and land-covers are classified as forest land, rangeland, water bodies, agricultural land and residential land. The unsupervised image classification method carried out prior to field visit, in order to determine strata for ground truth. Fieldwork carried out to collect data for training and validating land-use/cover interpretation from satellite image of 2006, and for qualitative description of the characteristics of each land-use/cover class. Also, it is necessary to collect other ancillary data and historical data required for classification of 1990 and 1998 images [13] . In order to create a testing sample set, first of all a set of testing points is selected randomly [14] . However, reaching all those random points in practice is infeasible because study area is a very complex with very steep slope, and very difficult to access, especially areas which are very far from the road/path. So, a modification is made in the field, whereby 95 randomly points used and all cover classes, which were mapped in the vicinity of these points were checked. For classification of images of 1990 and 1998 simple random sampling is applied [14] .
Allocation
The image classification is carried out in ENVI software. A supervised classification technique with Maximum Likelihood Algorithm was applied. The classification was based on 48 training samples for the image of 2006, and 42 samples for the images of 1990 and 1998. The land-use/cover maps of 1990, 1998 and 2006 were produced by using supervised image classification technique based on the Maximum Likelihood Classifier (MLC) and 132 training samples [15] . Finally, a 3 * 3 majority filter was applied to each classification to recode isolated pixels classified differently than the majority class of the window.
Testing
An independent sample of an average of 95 polygons, with about 100 pixels for each selected polygon, was randomly selected from each classification to assess classification accuracies [16] . Error matrices as cross-tabu- lations of the mapped class vs. the reference class were used to assess classification accuracy [17] . Overall accuracy, user’s and producer’s accuracies, and the Kappa statistic were then derived from the error matrices.
4. Results and Discussion
The land-use/cover pattern in the area as a whole showed that the rangeland covers about 30.8%, 36.7% and 45% of the total geographical area of the Dehdez area in 1990, 1998 and 2006, respectively. According to the confusion matrix, the overall accuracies of land-use/cover classification for 1990, 1998 and 2006 were 89.37%, 75.24% and 71.14%, respectively. The Kappa statistic was made for verifying the accuracy and trusty of land-use/cover maps. The Kappa values obtained were of 78.71%, 55.61% and 51.41% of accuracy for the 1990, 1998 and 2006, respectively. Monitoring of land-use/cover reflected changes were greater in extent over the span of 16 years in the land under different categories. During 16 years span period (1990-2006) about 1738.4 ha, 383.7 ha, 32.8 ha and 890.1 ha of rangelands were converted to forest, agriculture, water and settlement. Overall, because of conversion of other land covers in to rangeland, the total rangeland increased by 14.2% during 1990-2006 (Figure 2). The rate of rangeland increment was approximately 1.77% per year (Table 1). There are two types of rangelands in Dehdez area viz., rich rangeland and poor rangeland. Spatial distribution revealed that the northern and some eastern parts of the area dominated by the rich rangelands (Figure 3). Total rich rangelands in the area, accounts for 38.5%, 44% and 42.2% in 1990, 1998 and 2006, respectively (Table 2). Because of steep slopes and inaccessibility of these areas the rangelands have suitable condition and more species diversity than the other parts. Spatial distribution shows that the poor rangelands were dominated in southern and eastern parts of the area (Figure 3). The total poor rangeland in the area, accounts for 61.5%, 56% and 57.8% in 1990, 1998 and 2006, respectively (Table 2). These rangelands are used to be as pasture lands and most of them are degraded by the livestock overgrazing. People used to graze their livestock wherever the accessible poor rangelands they found. Basically, the poor rangelands close to the settlement seems under intensive grazing. High degradation is visible in the poor rangelands of the area and species that are better able to withstand grazing have crowded out original species in many areas.

Table 1. Rangeland changes resultant from the land-cover change detection analysis in Dehdez region.
Table 2. Area under different rangeland types in Dehdez area.
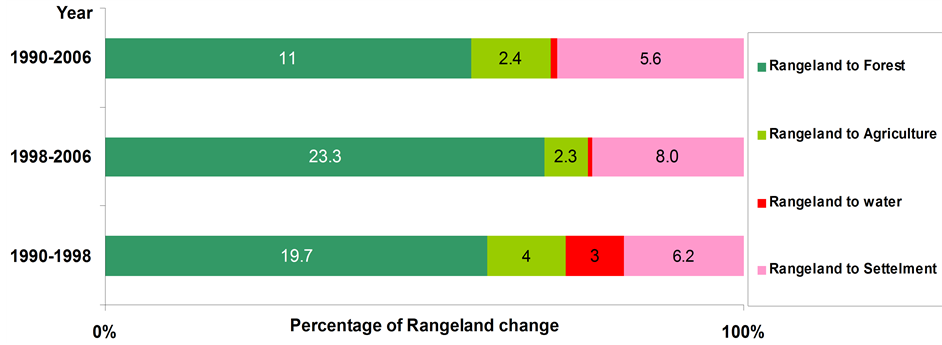
Figure 2. Rangeland changes in different directions as a percentage of the total rangeland area for the years1990-1998, 1998-2006 and 1990-2006.
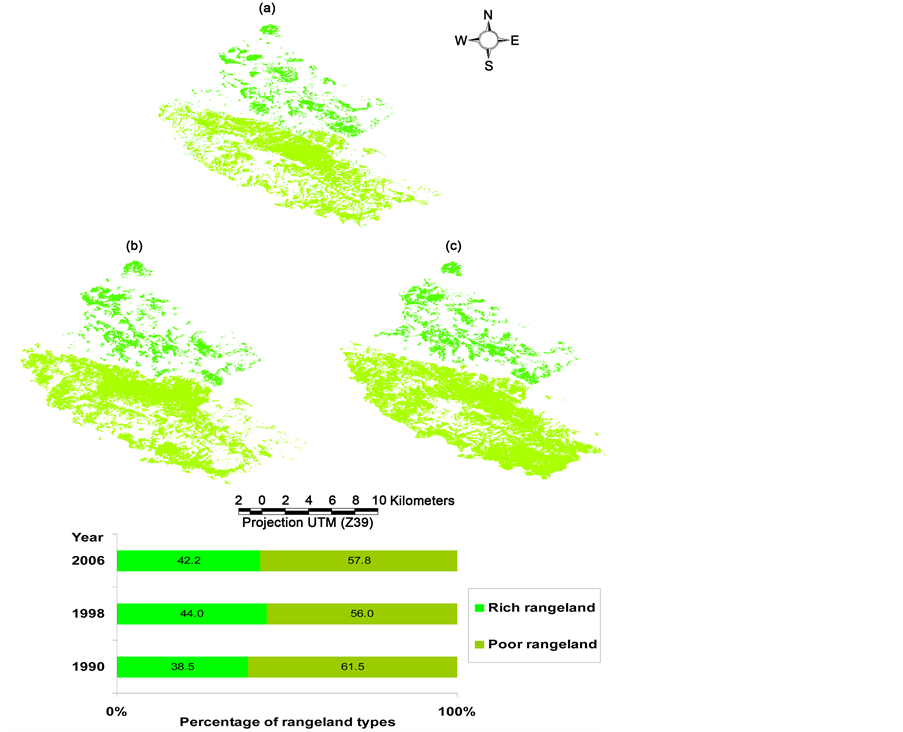
Figure 3. Rangeland in Dehdez area: (a) 1990; (b) 1998 and (c) 2006 and comparison of respective extents of rangeland types by percentage in the area.
5. Conclusion
Satellite Remote Sensing enables the generation of a detailed rangeland map and the separation of grazing intensity levels in rangelands can be generated with the relatively little effort in areas that are difficult to access [18] . It also presents a more realistic appraisal of livestock grazing pressure in the area and sets a framework for future management plan. About 36.6% of Dehdez’s area of rangeland shows mismanagement features and almost 26% is classified as intensively or overgrazed. Based on land-cover dynamic map, the area of rangelands is increased during the period of study, but because of the high pressure of human activity the quality of these rangelands is seriously affected. Therefore, many changes have been occurred in the rangeland, because of over grazing. Certain factors are responsible for the changes: human activities, domestic animals and ecological conditions. Still, human activity is the primary factor to affect the rangelands in this area. Animal husbandry is the factor of subsidiary kind as people cause a lot of consumption of grass and frequent pasturing by domestic animals. The rangelands get ruined by domestic animal, agricultural activities like deep plaguing and decreasing in the efficiency of soil in the area. The rangelands are exploited for medicinal plants as well as fuel and its wood quality, make cause for the demolition. This process produces further even more harmful conditions for the rangelands while quality of vegetation cover is reduced so much even for food and fodder. The damaging union of these factors is adversely affecting the ecological cycle in further. Natural rangelands are consequently changing into the agricultural and less natural vegetation cover. Quality of vegetation cover is decreased because of the unbalanced conditions like the unequal ratio of vegetation cover and animals. The lack of plant cover due to overgrazing causes soil erosion by water and wind. In conclusion, efforts should be made to prevent degradation and deterioration of rangelands irrespective of scale and geographic location.
Cite this paper
Ali A.Torahi,ElhamManuchehri, (2016) Analysis of Mountain Rangeland Changes, Using Remotely-Sensed Data, (Case Study: Dehdez Area, Iran). Journal of Geoscience and Environment Protection,04,100-106. doi: 10.4236/gep.2016.41012
References
- 1. Asner, G.P., Elmore, A.G., Olander, L.P., Martin, R.E. and Harris, A.T. (2004) Grazing Systems, Ecosystem Responses, and Global Change. Annual Review of Environment and Resources, 29, 261-299.
http://dx.doi.org/10.1146/annurev.energy.29.062403.102142 - 2. Cook, F.M. (1999) The Challenge of Sustainable Forests. Forest Resources Policy in Malaysia, 1970-1995. University of Hawaii Press, Honolulu.
- 3. Laliberte, A.S., Rango, A., Havstad, K.M., Paris, J.F., Beck, R.F. and McNeely, R. (2004) Object-Oriented Image Analysis for Mapping Shrub Encroachment from 1937 to 2003 in Southern New Mexico. Remote Sensing of Environment, 93, 198-210.
http://dx.doi.org/10.1016/j.rse.2004.07.011 - 4. Evans, J. and Geerken, R. (2006) Classifying Rangeland Vegetation Type and Coverage Using a Fourier Component Based Similarity Measure. Remote Sensing of Environment, 105, 1-8.
http://dx.doi.org/10.1016/j.rse.2006.05.017 - 5. Sedano, F., Gong, P. and Ferrao, M. (2005) Land Cover Assessment with MODIS Imagery in Southern African Miombo Ecosystems. Remote Sensing of Environment, 98, 429-441.
http://dx.doi.org/10.1016/j.rse.2005.08.009 - 6. David, S.W. and John, T.F. (1996) Remote Sensing Imagery for Natural Resources Monitoring—A Guide for First Time Users. Columbia University Press, New York.
- 7. Richards, J.A. (1993) Remote Sensing Digital Image Analysis. An Introduction, 2nd Edition, Springer-Velarg, Berlin Heidelberg.
http://dx.doi.org/10.1007/978-3-642-88087-2 - 8. Serneels, S. (2001) Divers and Impact of Land-Use/Land-Cover Change in the Serengeti-Mara Ecosystem: A Spatial Modeling Approach Based on Remote Sensing Data. Universite Catholique de Louvain, Belgium, Louvain.
- 9. Lillesand, T.M. and Kiefer, R.W. (2000) Remote Sensing and Image Interpretation. 4th Edition, Wiley & Sons, New York, 724.
- 10. Fattahi, M. (1995) Investigation of Zagros Natural Resources and the Important Factors of Demolition. Institute of Forests and Range Lands Researches, 57.
- 11. Piraste (2004) Use of Remote Sensing and GIS to Interprate Structural and Tectonic of Zagros Belt-Southweast Iran. Thesise of PhD, Aligarh Muslim University, 197.
- 12. Anderson, A. (1976) Land Use and Land Cover Classification System. Geological Survey Professional Paper 964, Washington DC.
- 13. Serneels, S., Said, M.Y. and Lambin, E.F. (2000) Land-Cover Changes around Major East Afrian Wildlife Reserves: The Mara Ecosystem. International Journal of Remote Sensing, 22, 3397-3420.
http://dx.doi.org/10.1080/01431160152609236 - 14. Jensen, J.R. (1996) Introductory Digital Image Processing. Trentice Hall, New Jersay.
- 15. Lunettaa, R.S., Ediriwickremba, J., Johnsonb, D.M., Lyonc, J.G. and McKerrowb, A. (2002) Impacts of Vegetation Dynamics on the Identification of Land-Cover Change in a Biologically Complex Community in North Carolina, USA. Remote Sensing of Environment, 82, 258-270.
http://dx.doi.org/10.1016/S0034-4257(02)00042-1 - 16. De Gier, A., Westinga, E., Beerens, S., van Laake, P. and Savenije, H. (1999) User Requirements Study for Remote Sensing-Base Spatial Information for the Sustainable Management of Forests—Final Report: ITC; FAO; National Reference Centre for Nature Management [IKC Natuurbeheer].
- 17. Congalton, R.G. and Green, K. (1999) Assessing the Accuracy of Remotely Sensed Data: Principles and Practices. Florida’ Lewis Publishers, Boca Rotan, 43-64.
- 18. Petit, C., Scudder, T. and Lambin, E.F. (2001) Quantifying Processes of Land-Cover Change by Remote Sensing: Resettlement and Rapid Land-Cover Changes in South Eastern Zambia. International Journal of Remote Sensing, 22, 3435-3456.
http://dx.doi.org/10.1080/01431160010006881