American Journal of Industrial and Business Management
Vol. 3 No. 3 (2013) , Article ID: 34117 , 10 pages DOI:10.4236/ajibm.2013.33042
Analysis of Relationships between Port Activity and Other Sectors of the Economy: Evidence from Cote d’Ivoire
![]()
Department of Transportation Economics and Maritime Management, School of Economics and Management, Shanghai Maritime University, Shanghai, China.
Email: stephnomel@hotmail.com
Copyright © 2013 Nomel Paul Stéphane Essoh. This is an open access article distributed under the Creative Commons Attribution License, which permits unrestricted use, distribution, and reproduction in any medium, provided the original work is properly cited.
Received April 30th, 2013; revised May 30th, 2013; accepted June 30th, 2013
Keywords: Port Activity; Correlation; Economic Sectors Activities; Port Traffic; Causality; GDP
ABSTRACT
This research paper aims to study the correlation between the port activity and the activity of the different services sectors. By comparing trends between them and analyzing the causality relationships between the port traffic and the other economic sectors, our study tends to present how the activity of the port of Abidjan could have a decisive effect on the local economy. To meet our objectives, correlation analysis and statistical test tools Eviews and other techniques have been run with data provided by local agencies and port authority. By doing so, our research study finds that there is existing correlation between port activity and activity generated by the other services sectors and its contribution can accelerate the economic growth.
1. Introduction
The new stage of ports industrialization to support the maritime transportation plays a crucial role in economic integration and accentuates the mutual co-dependence with other sectors of the economy. This relationship of the port with its complexes of vicinity with other sectors creates significantly conditions for economic growth. The expansion of the tertiary sector that classically involves mainly business services such as banking, insurance, trade, transportation, communication and other services sectors providing service to non-merchants, remains the backbone and the most contributor of GDP creation during 20 years (1992 to 2011) in Cote d’Ivoire. As the economic engine, the port of Abidjan contributed to more than the 82% of the customs taxes collection and constitutes the major gateway and hub of seaborne trade in the sub-region with more than 80% of the regional trade exchange [1]. Consequently, this port supports the business development of the tertiary sector and informal business services which by its functions contributes to the development of government revenues and incomes that constitute its budget consolidation [2]. However, exploring the concept of port’ basic activities and its relationship with other economic activities is to shift from the microeconomic point of view to a macroeconomic assessment which attempt to involve the aggregate effects of the relationships on economic growth.
However, in this paper, we examine the correlations between the port activity and the other services sectors of the economy in Cote d’Ivoire. We study the causality between the port and the other economic sectors and finally, we figure out whether the port activity could have an impact on the whole economy. Although correlations do not imply causality, they do help to identify relationships that may be worth analyzing more deeply in future studies. This paper is organized in 4 parts. Section 2 tends to highlight the concept of relationship, correlation and causality. Section 3 gives the methodology and data and presents the computed correlations and evaluation methods using econometric models with a tool to test the hypotheses involved in our study. Section 4 presents the analysis of the results and findings, and Section 5 ends the paper with the conclusion.
2. Literature and Identification of Concepts
First, much of prior analysis regarding transport and economic infrastructure has focused on the aggregate effects of public investment on growth or development either at national or at state level. But all the attempted modeling efforts might not consider the important information necessary for decision-making such as econometric or statistical and causal relationships between port activity especially the traffics and the economic activities of the other sectors. The first recent study examining the role of capital infrastructure on economic growth was Aschauer [3] assertion, which found a positive relationship between infrastructure investment and economic productivity. Gramlich [4] identifies infrastructure capital as large capital intensive natural monopolies such as transportation facilities, water and sewer lines and communication systems.
However, a few researches have investigated their emergence, impact and contribution to economic development in the African context.
Literature on Relationship of Port and Economic Activities
Since our study tends to highlight the existing relationship between the port activity and other sectors of service, it is relevant to investigate insights of concepts such as port activity and find the economic meaning of its relationships with other economic sectors. And later studies find in statistics term and view point, the notion of correlation and causality which constitutes more a notion of degree rather a nature.
The functional structure of the port of Abidjan allows many firms to operate and provide services in terms of cargo handling, consignment, pilotage, towage, shipping and transit, loading/unloading and transportation, and dealing with capital transfer, worker remittances and exchange transactions, all constitute the overall economic activities that could affect and impact the national and regional economic growth. Oum and Park [5] identify among other factors that, transport linkage, airport, port and intermodal transport facilities are among the most important factors that attract foreign direct investment in the northeast Asian region. The assertion follows the Steven K. [6] study of transportation infrastructure investment that may impact on economic activity based on the nature of the causal relationship. N. R. Smith and D. Guemes-Castorena [7] in their cross observation study of logistics capabilities, reveal that the correlation between number of ports and the economic indicators suggest that the utilization of port is a more important factor in economic development of State of Mexico while arguing that there is a strong correlation between flow and industrial GDP. Although there are similarities in the definition of seaports, many researchers have developed different opinions and views on the concept of ports in leading textbooks of port economics. However, port activities can be introduced in two main categories that explain the port community as the whole of the economic activity. The first activities known as authority consist in administrating the police and planning of nautical and land infrastructures. The second are business or industrial activities that handle operations generating profits by providing services. However, the concept of port industry and its activity varies according to the geographic, economic and institutional approaches. For Martin Stopford [8], port is just a geographic area that facilitates the berthing of ships while he limits the definition of port to a location for loading/unloading ships. Other definition from leading encyclopedia considers port as a facility which is built for receiving ships and transferring cargo [9]. In the geographic sense, port is defined as a space designed for receiving and dwelling ships. P. W. Langen and M. Nijdam [10] argues that ports often attract economic activities that benefit from the proximity to cargo flows and by comparing ports to airport and train station develop that port is a transport node that has three basic functions: transfer point in a transport chain, a place for temporary storage and a node of consolidation.
But in the economic approach, port is seen as a complex system of materials and immaterial elements as well as physical equipments used to provide services to ships, goods and cargos. While in institutional sense, it is considered as a resourceful institution organized or a nonstructured legal entity authorized to exercise simultaneously competencies of operations, public works and police function. In summary we consider port industry as the whole of the economic activity which is strictly port-related: port authorities, pilots, stowage, tub boats, custom, police and shipping agents: Port Community.
3. Methodology and Data
3.1. Data Source and Specification
The sources of the time series data used concern fundamentally the port activities and other macroeconomic data and indicators that are the observations pooled over the period of 1992 to 2012. The following Table 1 shows the sources of data collected from main economic department and national statistics authorities. Theoretically, highlighting the causal relationships between these economic variables provides us some thoughts and favourite insights to understand the economic phenomenon.
3.2. Data Analysis and Tool for Testing
To study the different relationships that exist between the port activity and other variables of the economy, we can simply proceed to the correlations analysis.
Statistical methods are used to fit the mathematical functional form to the data. With the software EVIEWS version 5, the ordinary least square (OLS) model has been run to estimate the causal relationships between these variables. To reach our objective with strategic
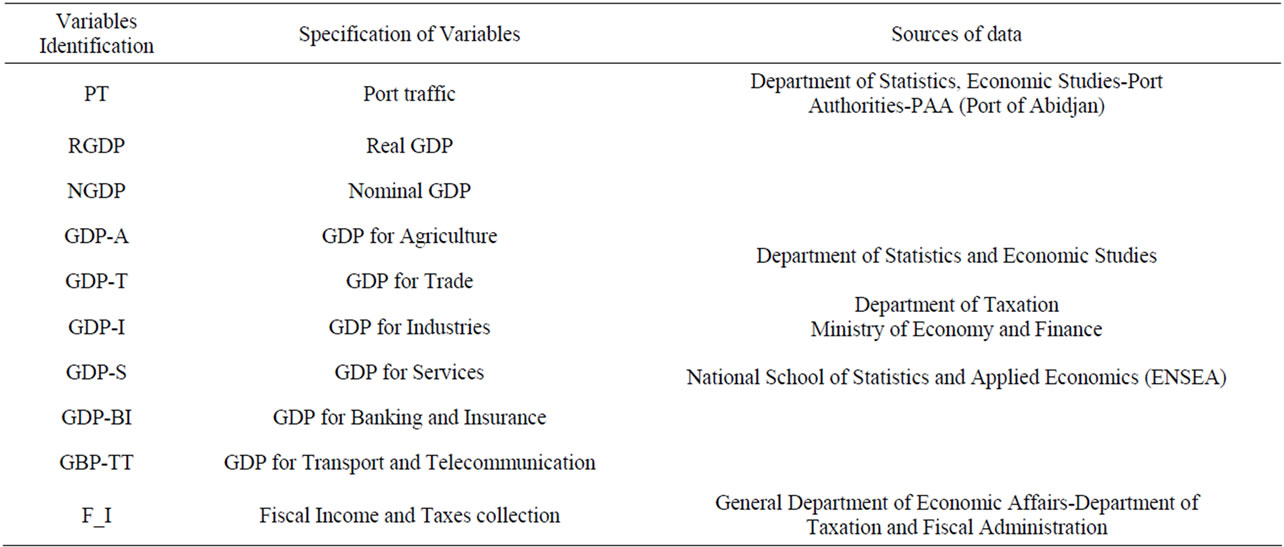
Table 1. Data source and specification.
verification of our hypothesis, different tests are run in order to identify and find out the existing cointegrating relationships between the model variables, the Johansen [11] cointegration test is run. Error-correction Model (ECM) is necessary for series that are non-stationary and cointegrated. For example Engel and Granger demonstrated that all the cointegrated series can be represented by an ECM [12]. However, our target is to reveal prominently the relationships between these variables and also figure out if the port activity can affects the other variables and obviously have direct or indirect impact on the whole economy. The unit root tests also would allow to highlight the nature of stationarity or whether there is no at all by determining the deterministic or stochastic trend of the a constant. Other test such as Dickey-Fuller test, the Augmented Dicky-Fuller (ADF) test, and the Phillips-Perron test will allow identifying the stationarity or the non-stationarity of a series.
3.3. Mathematical Formulation
It is paramount to know that the ADF test has been run by taking into account the three following models:
Model 3: This is model with constant and trend
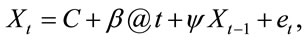 (3.1)
(3.1)
Model 2: It is a model with constant but without tendency
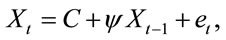 (3.2)
(3.2)
Model 1 is the model without constant and trend
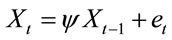 (3.3)
(3.3)
In such models stationary test is required and is about to run the null hypothesis and nonstationary test ρ = 0 against the alternative hypothesis ρ < 0 by referring to the values tabulated by Dickey and Fuller.
Applying the cointegration model will allow us to correct false or fallacious regression or just we do not have it at all. The theory of cointegration tries to estimate the long-run relationship using the nonstationary series themselves, rather than their first differences.
Engel and Granger have demonstrated that when we have two non-stationary variables
(Yt ~> I(1) and Xt ~ > I(1)), we can have the following one:
 or
or .
.
The purpose for underlying the cointegration is that for a short term, Xt and Yt can present a divergent trend but they will be trending upwards together in long run as far as both are nonstationary. Therefore, it is clear that there is a stable relationship in a long run between Xt and Yt. This long term relationship is called cointegration and can be given as follow:
 (3.4)
(3.4)
The disadvantage of the Engle and Granger [10] method is that it does not allow distinguishing several cointegrating relationships. When we study simultaneouly the variables N where N > 2, we can have (N–1) cointegrating relationships. The Engle and Granger method [12] does allow us to get just only one cointegrating relationship. This is why for bringing solution to that difficulty, Johansen [13] has proposed a methodological approach. Johansen method is a multi various approach of cointegration which is based on the method of maximum likelihood estimation (MLE).
In this method, Johansen sequence test consists in finding the number of cointegrating relationships r, so that we can use the method of maximum likelihood estimation. It is clear, it is a convenient and worthy method that allows giving us the number of the cointegrating relationships that has been estimated.
4. Analysis of Results and Findings
4.1. Correlation between Port Traffic and Primary Sectors
The global analysis of Cote d’Ivoire’s commodities export through the port to other countries in Europe and Asia is characterized by food and agricultural products which support the primary sector. International demand for cocoa beans indicating the pricing power and export taxes affects also the shipping market of the port of Abidjan. Representing almost 40% of the country’s total export and 50% of the agricultural exports, Cocoa plays a major role in the Ivoirian’s economy and its production impact on the market of all the sectors.
Other special crops such as coffee, cotton, pineapple, banana, rubber, timber, cashew nuts, shear nut, and seed exported by the neighbouring countries are handled and exported by the port of Abidjan. By increasing steadily, they represented 57% of the total agricultural production in 2009 as against 43% in 2002, an increase of 12% in five years. Indeed the international trade exchange related to agricultural products has impacted the primary sector in Cote d’Ivoire with an increase of 3.8 percent of the value added which draws a growth of 1.4 percent in 2010. This economic performance is mainly supported by improvement of the special crops and commodities production but also is due to the intensive and beneficial port operations reforms implemented ever since. As we observe, the illustration of the Figure 1 shows the trend of the two variables in time period.
The value of 0.91 as the coefficient of the correlation that has been calculated between the share of primary sector production in the total production of gross domestic production of agriculture (GDP-A) and the port traffic (PT). We can therefore assert that there is a linear relationship between the two variables (refer to Table 2).
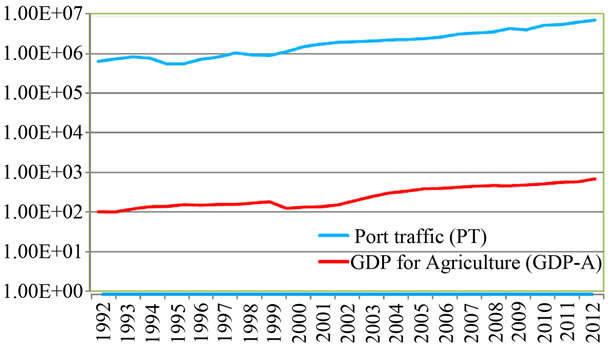
Figure 1. Comparative trend between agricultural production and port traffic (in tonnage).
4.2. Port Traffic and the Secondary Sector
The value of the coefficient of correlation is 0.94. This value has calculated between the share of the industrial sector production and the port traffic. Since the value is positive, we can then presume that there is a linear correlation between the two variables (refer to Table 2).
The relationship of the two variables (Port traffic and production of industrial sector) is due to the increasing demand for shipping services of geological resources such as crude oil, mines, petroleum products and gas.
Although the activity of industrial sector has reasonable size in the local market, the oil’s export of Cote d’Ivoire and its shipment to foreign countries in Europe and North America is handled at the port. The treatment and transformation of 1 percent of Nigerian crude oil is made by the Société Ivoirienne de Raffinerie, SIR (National Company of Oil Refinery) and transited through the port of Abidjan which in return is forwarded and distributed to most of West African countries. Another factor remains in the support from foreign direct investment in the industrial sector having relations with the port industrialization in logistics facilities, handling capacity and its traffic activities growth namely the distribution and transit of oil tank to the dry ports in landlocked and hinterlands countries. The Petroleum code of 1996 that offers important advantages to petroleum companies wishing to operate in this sector in both on concession and production contract basis has facilitated the FDI and increased since the port traffic in exporting petroleum products.
As we can observe, the Figure 2 describes the gradual trend of the relationship between the industrial production and the port traffics.
4.3. Port Traffic and Service Sectors
As defined in the literature, services sector can be considered as the non-physical or immaterial economic goods that are produced and consumed simultaneously and constitutes the group of activities that are non-industrial and agricultural. However, this sector includes other production services that may constitute agricultural and industrial activities. Banking organizations, insurance firms, trade businesses, transport services, telecommunication and other related services. The regime of free zone for ICT and Biotechnology adopted by law, grants important tax and customs revenues to the operating companies and firms that improve their service delivery in the sector of communication. In overall, we observe in the following work how the trend of the trade structure and port traffic explain the correlation between the two activities identified as variables.
4.3.1. Relationship between Port Activity and Trade
Economies of most of developing countries in the sub-Saharan Africa are strongly supported by the services activities sectors and Cote d’Ivoire is not far from this economic reality.
Since as early as the 15th century, European sailors began trading along the coast of what is now Côte d’Ivoire. And since, trade with the outside world has been an essential element of the region’s prosperity. Over the first two months of 2006 the traffic of the port of Abidjan recorded a rise of 21.9 percent. This rise of the traffic is namely related to the petroleum products with more than 50% which imports is around 509,000 tonnes (8.8%) against exports of 1.2 million tonnes representing more than 106 percent.
However, Cote d’Ivoire trade remains a sector that its activities generate value added and recorded in 2010 a growth of 6.9 percent exceeding the last 2009 with 4.7 percent, 5.2 percent for 2008 and 5.7 in 2007. (Refer to Figure 3). This growth has been possible because of the competitiveness improvement of the port of Abidjan. with the growing needs of exports to outside the continent. Re-exportation activities in West African region are some of the particularities of port activities and traffic that occupy today almost the 78 percent of foreign exchange. Also the important cargo flux and traffic of imports from world market which are transited to landlocked countries through transshipment means. Wholesalers from Mali, Burkina Faso, Niger, Guinea and Nigerians in West Africa sub-region, see the port of Abidjan as a focal point and core center of their provisions which in return grant to local workers the part of the profit for services delivery in transport, customs clearance, warehousing, black market for currency exchange, shipping agents etc. Consequently we can observe the direct impact of activities related to re-export through port to port since the re-exportation that characterizes the trade sector remains a competitive and efficient economic activity. As indicates the Table 2, the coefficient of correlation is 0.96. Therefore, we can reach a conclusion that there is a correlation between the port activity and the trade sector.
4.3.2. Relationship between Port Activity and the Transport Sector
The natural and geographic location of Cote d’Ivoire with its two seaports made the country an excellent hub and gateway of West African commodities export to the outside world. With its privileged position and access to the Atlantic Ocean, the port of Abidjan by offering the hinterland countries such as Burkina Faso, Mali and Niger, a competitive trade market for their crops and commodities in the international exchange scene, has increased the demand of multimodal transport services especially in the urban area. With its modern infrastructure the port is linked to road network built to serve the merchandises flow. A road network of more than 80,000 km serviceable, more than 6000 km of paved roads, railways system of 660 km linking from Southern region to the North and roads linking to major cities especially to the two ports cities Abidjan and San-Pedro are served to the shipment of cargo. Forwarding of goods from the port to the their final destination, transportation and logistics companies are concerned about this activity sector. Forwarding agents and concessionaries collaborate with roads and rail transporters based on negotiation of hiring trucks, railway wagon or trailers for the physical transfer and shipment of the cargos and goods to their respective owners. As result, transportation of cargo remains one of the first categories of activities that support the traffics of the Port of Abidjan. Observation of Figure 4 in appendix, obviously leads us to assert that a strong correlation exist between the two variables. The calculation of coefficient of correlation between the share of production of this sector and the port traffic gives a value of 0.99.
4.3.3. Relationship between Port Activity and the Bank and Insurance
The flow of cargos and other goods, especially the prohibited with high tax payment are mostly operated by exports and imports companies running in the port area and in other strategic zones of the port city. Legally registered these companies deal with exchanges transactions that are handled by banks and financial firms operating in the countries. Capital transfer, financial linkages and workers' remittances from and to hinterland are profitable to banking and insurance companies. Other goods such as second hand vehicle imported from Europe and Asia by local import and export companies generate a flow of liquidity at the level of the port [2]. Yet and now, these different players and sectors especially the trade sector deal with the port of Abidjan for their various foreign exchanges. Obviously the banking sector facilitates the money flow in port sector through the movement and flux of capital and funds in account transacted by these users and players. We can therefore confirm that there is a relationship between the port and the banks/insurance companies. (Refer to Figure 5 in appendix). The calculation of coefficient of correlation between the share of production of the trade sector and the port traffic gives a value of 0.97 while the correlation between the share of bank service in the total production and the port traffic computes a score of 0.96, which means that a linear relation does exist between them.
4.4. Granger Causality Testing
Study and estimation of Causality can be developed through various statistical tests. The Granger causality test is indentified as the last test that tends to make a comparison between two distinct models [14]. In the first model Granger considers a simple autoregressive formulation of the process that has been studied. In the second model, Granger adds the explanatory variable that has been lagged over several periods. According to this, we could say that if the second model is statistically more significant than the first one, then the process X causes the process Y.
Applying EVIEWS version 5 software program enable us to specify the number of lags that we propose to integrate in the models for Granger causality testing. For our analysis, we propose to consider a sufficient number of lags regardless their high level that corresponds to the number of significant periods. We can choose a number of lags that is equal to 3 in the study. The results of the causality test are shown in the appendix (Table 3).
4.5. Causality between Port Activity and Activities of Other Sectors of the Economy
As illustrate the test results (in appendix) Table 3, the probability associated to the non causality test between the GDP-TT variable (GDP for Transport and Telecommunication) and the PT (port traffic) variable is bigger than 0.05 which means to accepting the null hypothesis of non-causality. The probability of non-causality test in the reverse direction is also bigger than 0.05 and gives the same conclusions. As fact, it is difficult to establish a significant relationship between the port traffic and the telecommunication sector. But it is possible with the transport sector, simply if we realize in one hand the important personnel and human resources of firms operating in the port. We take also into account in the other hand the numerous temporary and permanents workers accessing to their businesses through the traffic of second hand vehicles and the unloading services of trucks and buses. Therefore, the trend of port traffic has an incidence on the transports and telecommunication since they constitute a small but considerable share of the money supply. On this account they could constitute a significant relevance of determining the explanatory factors of the economic growth.
The probability associated to the non-causality test between the GDP-S variable (GDP for other Services) and the port traffic is bigger than 0.05, the null hypothesis is more probable and can conclude by rejecting the causality between the GDP-S and Port traffic. But the reverse direction of the non causality test gives different results in which the probability associated to this test is smaller than 0.05. Then we accept the hypothesis that there is an existing causality between the port traffic and the other services sector. In other word, the trend of the other services sector could not be an explanatory factor of port traffic but rather the port traffic is an explanatory factor of the other services sector. (Refer to Table 4).
The probability associated to the non causality test between the GDP-T variable (GDP for trade) and port traffic is bigger than 0.05. We retain the null hypothesis and reject the causality between the Trade GDP and the port traffic. The non causality test operated in the reverse direction provides us opposite results with the probability being smaller than 0.05. That means we accept the fact that there is existing causality between the port traffic and the Trade GDP. Therefore, the trend of trade has an incidence less significant on the trend of port traffic. And in the reverse direction the port traffic is an explanatory factor of trade. (Refer to Table 4).
The probability associated to the non causality test between the GDP-BI variable (GDP of Banks and Insurance) and the port traffic is bigger than 0.05 which means that the null hypothesis is more probable and can conclude by rejecting the causality between the other services and the port traffic. In the reverse direction, the application of the non causality test gives opposite results in which the probability associated is bigger than 0.05 but by considering a marginal error of 10%. Then the null hypothesis of non-causality is rejected. We can conclude by accepting the existing causality between the port traffic and the banks and insurances.
Table 2 in appendix by illustrating the coefficients between the different variables in function of the port traffic, summarizes the first hypothesis testing results.
The values and scores of the coefficients indicate that there are strong correlations between the port activities and the activities of the other sectors of the economy which naturally contribute to the economic growth. Therefore the hypothesis 1 (H1) test has been verified.
The second hypothesis (H2) introduces the Granger causality test and allows us not only to establish a causal relationship between two phenomenon but also to figure out the meaning of this relationship. As we have examined and identified in the estimation above, we can argue that in the long run purpose, causal relationships between the port activity and the activity of the other sectors of the economy are possible. Then our hypothesis (H2) is verified.
5. Conclusions
In summary, we have analyzed the correlation and causality study between port traffic and economic sectors by identifying that they are interrelated. We have studied the variables used to measure the causality relationship between the port activity and other economic sectors. Different observations were made between the comparative trend of the port traffic and other sectors of the economy.
The Granger causality testing enable us to not only establish a causal relationship between two phenomena but also to determine the sense or meaning of this relationship. Therefore, based on our study, we can argue that it is possible to consider the causal relationships between the port activity and the activities of the other sectors of the economy. However, based on the results by running causality test in which all the hypotheses are tested, all the six variables selected such as LF_I, LGDPTT, LGDPS, LRGDP, LGDPT, LGDPBI are not the explanatory variables which mean that they could not be explanations of the port traffic, but rather in the opposite direction, the port traffic is an explanatory factor of them. As such, the port activity and its traffic growth could be converted into liquidity which can improve the fiscal income and accelerate the economic growth. And investment in port can be considered as a capital formation [15] for economic development.
REFERENCES
- M. Gossio, “Competitiveness of the Port of Abidjan: 25 Million Tonne of Cargo by the End of the Year,” Interview of Port of Authority at Africa, 24 October 2010
- P. S. E. Nomel, “Shipping and Invasion of Second-Hand Vehicles in West African Ports: Analysing the Factors and Market Effects at the Port of Abidjan,” American Journal of Industrial and Business Management, Vol. 3 No. 2, 2013, pp. 209-221. doi:10.4236/ajibm.2013.32026
- D. A. Aschauer, “Is Public Expenditure Productive?” Journal of Monetary Economics, Vol. 23, No. 2, 1989, pp. 177-200. doi:10.1016/0304-3932(89)90047-0
- E. M. Gramlich, “Infrastructure Investment: A Review Essay,” Journal of Economic Literature, Vol. 32, No. 3, 1994, pp. 1176-1196.
- T. H. Oum and J. Park, “Multinational Firms’s Location Preference for Regional Distribution Centers: Focus on the Northeast Asian Region,” Transportation Research Part E, Vol. 40, No. 2, 2004, pp. 101-121. doi:10.1016/S1366-5545(03)00036-X
- K. P. Steven and L. J. Eric, “Evaluating the Relationship between Transportation Infrastructure and Economic Activity: Evidence from Washington State,” Journal of the Transportation Research Forum, Vol. 47, No. 2, 2008, pp. 21-39.
- N. R. Smith and D. Guemes-Castorena, “A Correlation Study of Logistics Capabilities of the States of Mexico,” 2006, pp. 1-5. http://homepages.mty.itesm.mx/guem.pdf
- M. Stopford, “Maritime Economics, Countries: A Comparative Analysis,” Geographic Review, Vol. 53, Routeledge, London and New York, 1997, pp. 503-529.
- Wikipedia, “Port,” 2012. http://en.wikipedia.org/wiki/
- P. W. Langen and M. Nijdam, “Port Economics, Policy and Management,” Erasmus University, Rotterdam, 2006, pp. 6-89.
- S. Johansen, “Statistical Analysis of Cointegration Vectors,” Journal of Economic Dynamics and Control, Vol. 12, No. 2-3, 1988, pp. 231-254. doi:10.1016/0165-1889(88)90041-3
- C. Granger, “Investigating Causal Relations by Econometric Models and Cross-Spectral Methods,” Econometrica, Vol. 37, No. 3, 1969, pp. 424-438. doi:10.2307/1912791
- S. Johansen and K. Juselius, “Maximum Likelihood Estimation and Inference on Cointegration-with Applications to the Demand for Money,” Oxford Bulletin of Economics and Statistics, Vol. 52, No. 2, 1990, pp. 169-210. doi:10.1111/j.1468-0084.1990.mp52002003.x
- R. Engle and C. Granger, “Co-Integration and Error Correction: Representation, Estimation and Testing,” Econometrica, Vol. 55, No. 2, 1987, pp. 251-276. doi:10.2307/1913236
- T. Kawakami and M. Doi, “Port Capital Formation and Economic Development in Japan: A Vector Autoregression Approach,” Papers in Regional Science, Vol. 83, No. 4, 2004, pp. 723-732. doi:10.1111/j.1435-5597.2004.tb01935.x
Appendix
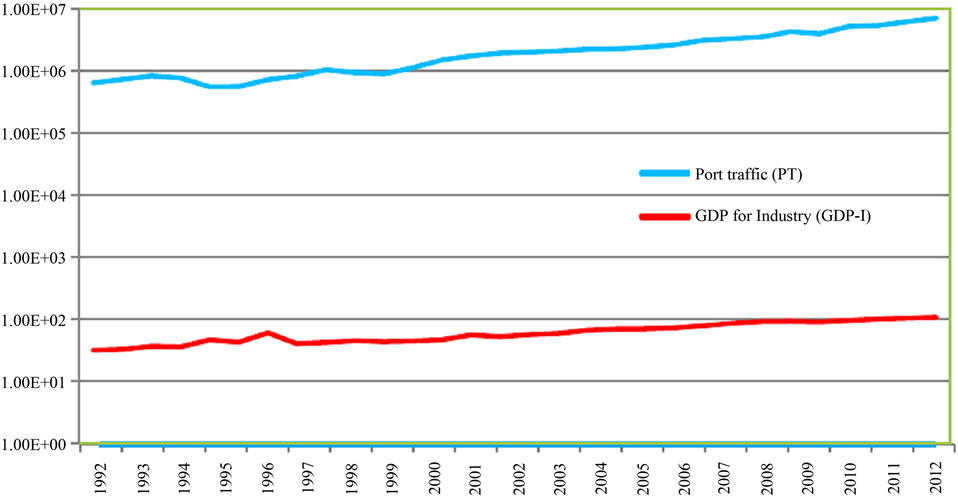
Figure 2. Comparative trend between industrial production and port traffics (in tonnage).
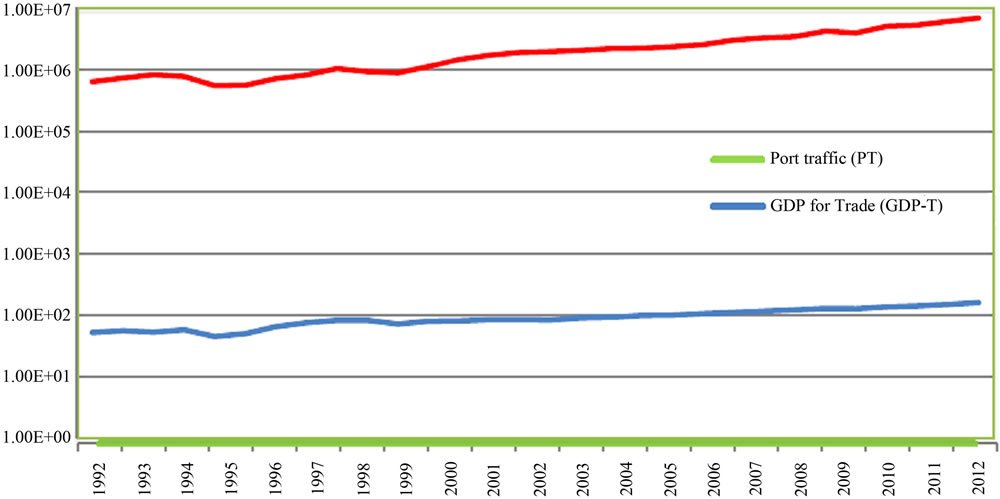
Figure 3. Comparative trend between the trade GDP and port traffics (in tonnage).
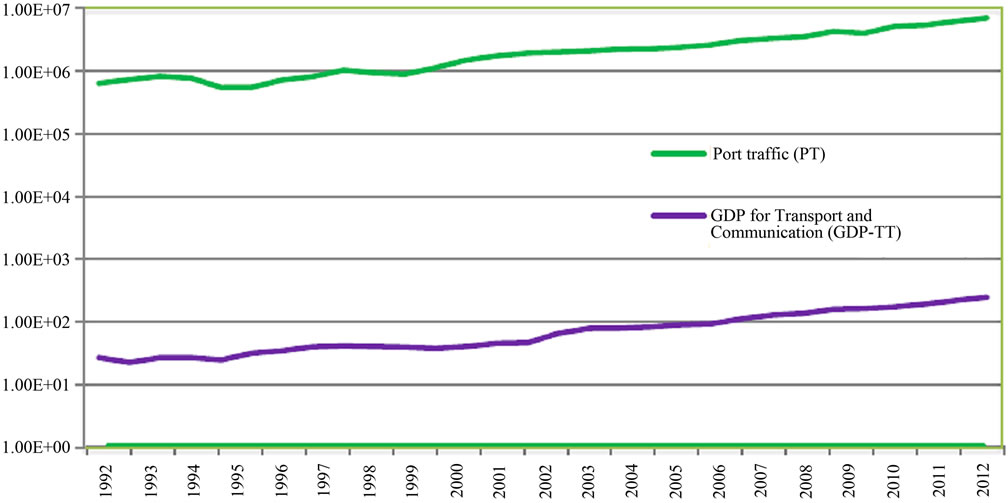
Figure 4. Comparative trend between transport and communication production and port traffics (in tonnage).
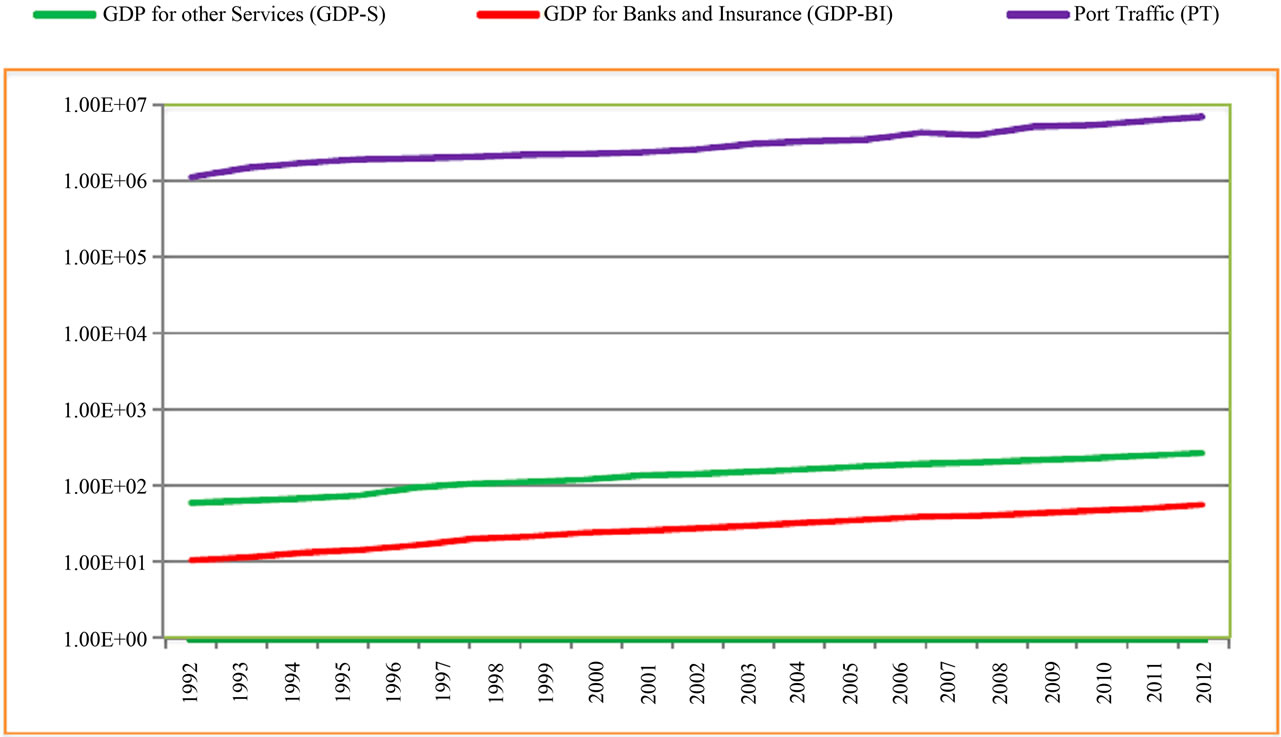
Figure 5. Comparative trend between other sectors, trade and port traffic (in tonnage).

Table 2. Linear coefficient between variables and the port traffic.
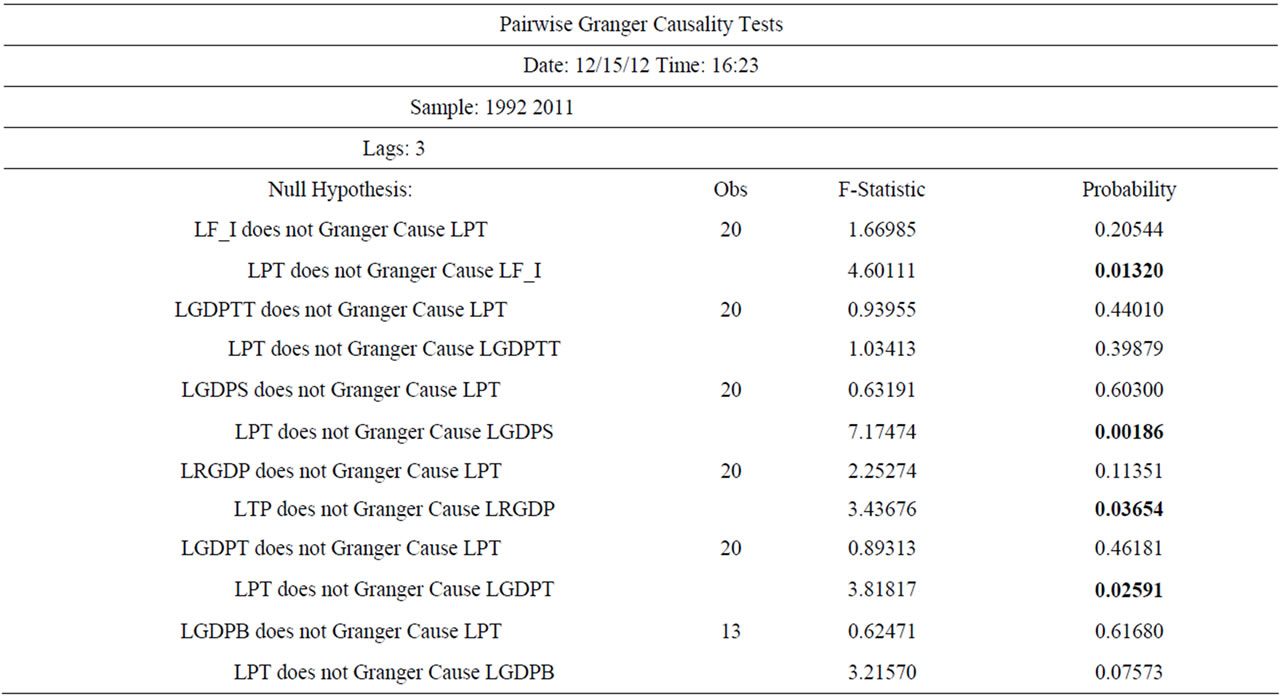
Table 3. Results of Granger causality tests.
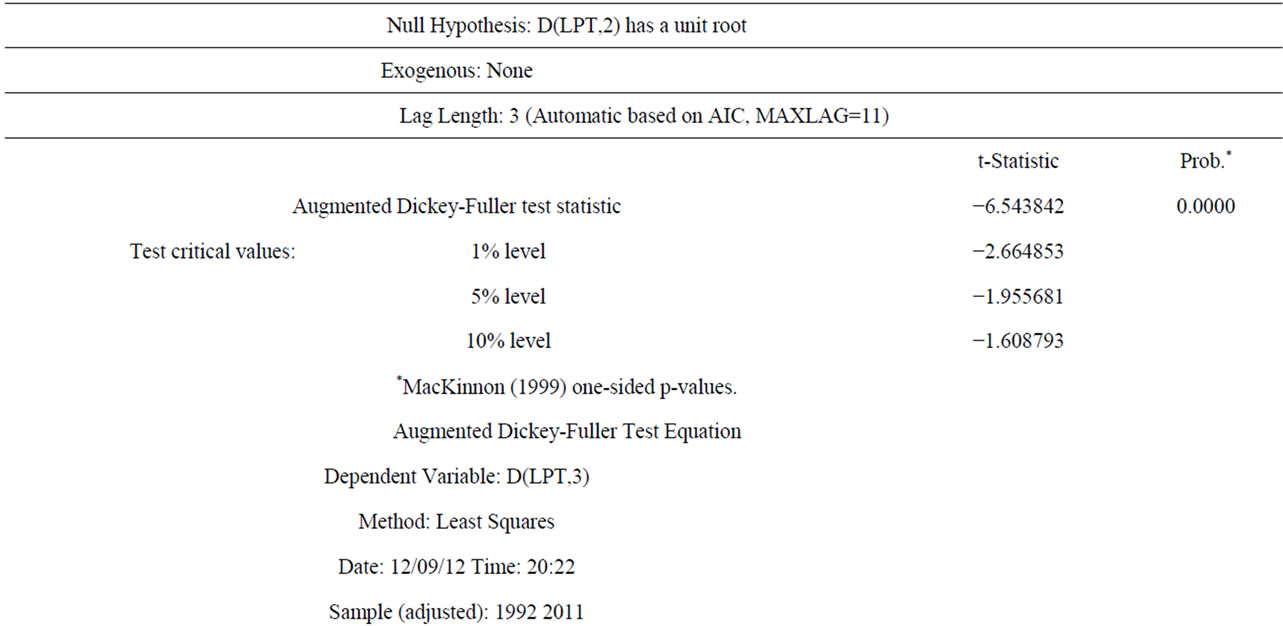
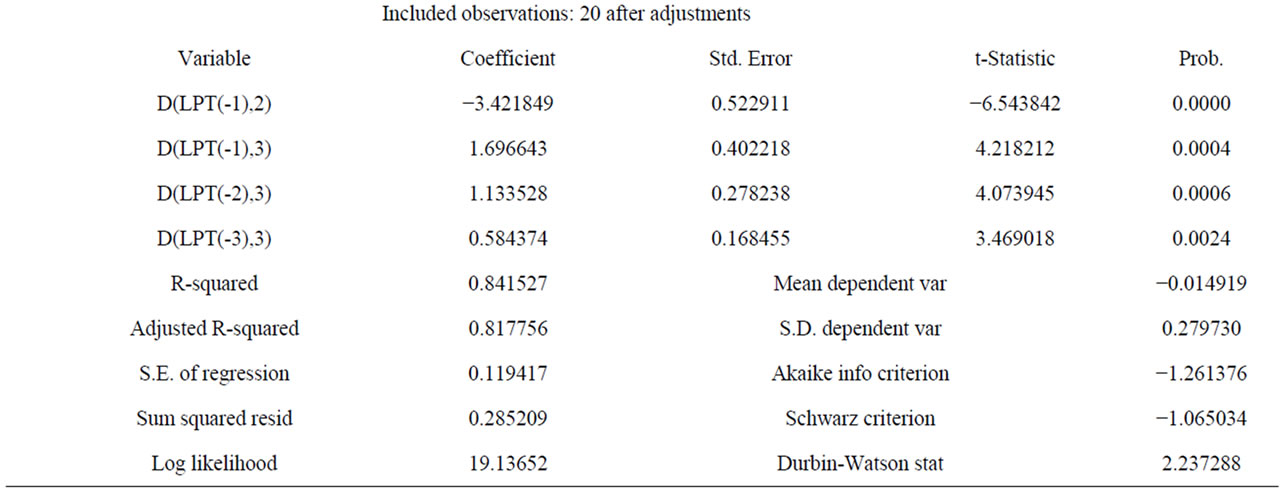
Table 4. Port Traffic (PT).