Journal of Applied Mathematics and Physics
Vol.2 No.7(2014), Article ID:46850,10 pages
DOI:10.4236/jamp.2014.27066
Modifications on the Strand’s Sampling Method Applied to Stands of Pinus elliottii Engelm
Sylvio Péllico Netto1*, Doádi Antônio Brena2, Ângelo Augusto Ebling1, Aurélio Lourenço Rodrigues1
1Department of Forest Science, University Federal of Paraná, Curitiba, Brazil
2Brazilian Forest Service, Brasilia, Brazil
Email: *sylviopelliconetto@gmail.com
Copyright © 2014 by authors and Scientific Research Publishing Inc.
This work is licensed under the Creative Commons Attribution International License (CC BY).
http://creativecommons.org/licenses/by/4.0/


Received 26 February 2014; revised 20 March 2014; accepted 27 March 2014
ABSTRACT
This work was carried out with the objective of proposing some changes in the Strand’s sampling method, in which the trees are selected in sampling units with probability proportional to its diameter for the calculation of the stand density and basal area, and proportional to its height for the calculation of volume per hectare. Data used to evaluate the efficiency of the sampling of Strand in clusters were collected in stands of Pinus elliottii Engelm, located in a National Forest, Rio Grande do Sul State, Brazil. In the course of this research work it was proposed to convert the sampling unit into a cluster, structurally more efficient to obtain consistent estimates of volume and of dominant heights, using volumetric equivalence, which results in a form factor equal to one for the final calculation of volume per hectare and an indirect method to obtain the average height of Lorey. The objectives of this study were achieved, because with this methodology it is not necessary to measure heights of trees in the sampling unit, except a dominant height by cluster to evaluate sites. The development of independent estimators for basal area and volume gave rise to the proposition of an estimator for average height of Lorey, but without measuring any tree height in the sampling. The proposed methodology is an attractive solution to reduce costs in forest inventories, with the ability to have greater accuracy and scope for information at the level of compartments, without increasing the cost of sampling in comparison to that performed with units of fixed area. The use of smaller permanent sampling units with higher intensity in the compartments before the final cut will substantially increase the precision of the estimators in these management units, which will enable them to eliminate the pre-cut inventory in forest enterprises.
Keywords:Cluster Sampling, PPS Sampling, Forest Inventory

1. Introduction
Strand introduces a sampling method to the forestry literature, in which trees are
selected from the left side of a line of length (L), and their inclusions are made
with proportionality to their diameters (di) to obtain the estimator
of basal area
![]() and proportional to its heights (hi),
for obtaining the estimator of volume per hectare (V/ha) [1] . Later, Péllico Netto and Brena developed
the estimators for the calculation of density (N/ha), whose selection of individuals
is done with probability proportional to diameter when plants are taller than 1.30
m or height for any size [2] .
and proportional to its heights (hi),
for obtaining the estimator of volume per hectare (V/ha) [1] . Later, Péllico Netto and Brena developed
the estimators for the calculation of density (N/ha), whose selection of individuals
is done with probability proportional to diameter when plants are taller than 1.30
m or height for any size [2] .
To facilitate the calculations of the estimators, Strand has proposed that the sampling line (L) would be taken with length equal to 5π, i.e. 15.71 m [1] . Additionally, he proposed that the sampling for the volume estimation should be performed with an angle of inclination b = 63˚26'06'', in such a way to include in the sampling those trees of the left side with distances taken perpendicular to the sample line, equal or smaller than the half of their respective heights, i.e. the visualization pass exactly to their tops or hit them.
The Strand’s method, although brings innovations and advantages for sampling in forest plantations, and remains some points that do not meet plenty what you get normally in units of fixed area, i.e. inconsistent evaluation of dominant trees, needs to have the mean form factor for obtaining the volume per hectare and disadvantage in using them as permanent plots in continuous inventories, due to changes of participative individuals in successive samplings.
The theoretical content of this method is presented in Péllico Netto and Brena [3] , whose gist of the Strand’s estimators is synthesized in table 1.
As can be seen, the volume is directly obtained per hectare, without the participation of the height of the trees in its calculation. This condition has been the most attractive for the application of this methodology, which makes it quicker, and allows for the same cost, to obtain a higher sampling intensity in the forest area to be sampled.
The work was designed to achieve the following objectives: 1) Make the sample unit a cluster to generate consistent estimates in plantations with no regular spacing; 2) Allow obtaining consistent height of dominant trees at each successive approach, since the cluster units enable an increase in the number of trees per sampling unit, while ensuring in its scope at least the detection of a dominant tree; 3) Develop a consistent estimator in an indirect way for the average height of Lorey within the stand, utilizing only the measurement of diameters; 4) Convert the sampling unit structurally more efficient to obtain its estimator of volume, using volumetric equivalence, which could result in a form factor equal to one for the final calculation of volume per hectare.
To meet objectives c and d it will be presented the theoretical development for each theme separately.

Table 1. Estimators of the Strand’s sampling method.
2. Methodology
The survey of dendrometric information used to evaluate the efficiency of the Strand’s method with clusters, was conducted in stands of Pinus elliottii Engelm., located in the National Forest of Sao Francisco de Paula (Flona), mesoregion northeast of the State of Rio Grande do Sul, Brazil, between the coordinates 29˚24' and 29˚27' South latitude and 50˚22' and 50˚25' West longitude. The area of the Flona covers 1606 ha, where the plantations with the genus Pinus sp. occupy approximately 229 ha (14%).
In accordance with the global classification of climatic types developed by Köppen, the climate of the region is of type Cfb, mesothermal and super humid, with mild summer and cold winter [4] . The formation of frost is frequent, with snowfall in the colder months [5] . The precipitation is one of the highest in the State of Rio Grande do Sul, with 2252 mm, distributed evenly throughout the year [6] .
The local topography is strongly corrugated, which configures an average altitude of 900 meters above sea level. The soils that characterize the region are classified as Haplumbrept, Argiudoll, Udorthent, [7] derived from basic and acidic effusive rocks of the Serra Geral Formation [8] .
To assess the estimates generated by the methodology of Strand, the results obtained regarding the estimates of basal area and volume were compared with the estimates generated by the method of fixed area. For this reason, 10 central sampling points were taken as a basis by Strand’s method and installed clusters in format of a Maltese Cross, in which four subunits were taken in north-south and east-west directions. Each subunit corresponds to an area of 10 m × 15.7 m (157 m2), then each cluster corresponds to the sampled area of 628 m².
2.1. Sampling in Lines with Clusters
Whereas a planted forest, in which the sampling shall be performed by locating not more than just a line of length (L) in the middle of the planting rows, but a cluster with four subunits, each one taken with a distance l of a central point X0, such that l = 25 m and that the sub-units can be distributed: two following the directions of planting lines and two crossing them at 90˚ right angles, so as to obtain more consistent information in stands with rectangular spacing, as is shown in Figure 1.
As is shown, this unit occupies approximately an area of 2642 m2, or little more than 1/4 hectare for the case of fixed area plots and the side L of the fixed area is used for the Strand’s sampling unit.
The cluster’s subunits have remained with the same size proposed by Strand, i.e.,
L = 15.71 m and the sampling were always performed of the left side of the subunits.
In these circumstances, it is proposed to identify with a triple indexing, i.e.
Xijk, such that
 clusters,
 subunits of the clusters and
 trees per subunit.
Note that this new proposition requires special considerations for the sample unit, i.e. the estimator of basal area will be performed per subunit and the result per sampling unit will be obtained by the arithmetic mean of these values, once such results will be directly obtained per hectare. In these circumstances, the estimators can remain generically as were developed by Strand, but they should be adapted for the entire cluster unit and the estimator by subunit would be obtained as it is presented in equation (1), held the line length with 5π, i.e. L = 15.71 m:
 (1)
(1)
The estimator of basal area per cluster will be obtained as is presented in (2)
 (2)
(2)
The estimator of basal area average for all clusters will be obtained as is presented in (3)
 (3)
(3)
The estimator of volume will be performed in the same manner and obtained by subunit as is presented in equation (4):
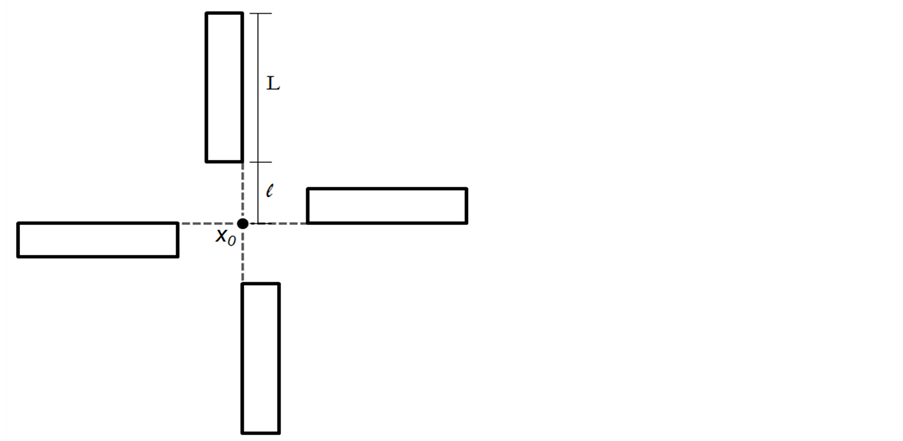
Figure 1. Cluster unit used in plantations, whose sampling is performed simultaneously with fixed area plot and with Strand’s method.
 (4)
(4)
or of volume by cluster will be obtained as is presented in (5):
 (5)
(5)
The estimator of average volume for all clusters will be obtained as is presented in (6):
 (6)
(6)
The volume per sampling unit was calculated for the two sampling methods. In sampling by fixed area individual volumes for P. elliottii were calculated by means of an equation selected between volumetric models of double entry, having the logarithmic function of Schumacher Hall (7) been selected by Elesbão [9] , from the statistical scores, as the best fit for the species. The same author considered, still, that the models of Spurr, Schumacher Hall, Spurr logarithmic, BWI—Germany (Forest Research Institute Baden-Wuerttemberg) showed good adjustments, with coefficients of determination greater than 0.80 and lower values relative to the standard error of the estimate. When performing the Strand’s method, it was used a Bitterlich Mirror Relaskop for determination of basal area, followed by the application of a form factor (with reference to 1.3 m) [10] .
 (7)
(7)
where: V = volume (m3); d = diameter at breast height (cm); h = total height (m); b0, b1, b2 = coefficients of model and ln = neperian logarithm.
2.2. Height of Dominants Trees in the Stand (hdom)
With the structure of the sample unit as a cluster with four subunits, it becomes possible to consider it suitable to detect the occurrence of dominant trees, as the standard requirement proposed by Assmann [11] .
If in each subunit of the cluster you can have from 6 to 8 trees in the first inventory, with spacing 3 m between rows and 2 m between plants, it counts with at least 28 trees per cluster, i.e., we can have at least a dominant tree in each unit, while at a spacing of 3 m × 2 m, of 1666 trees per hectare at least 1 in each 16.66 of them is dominant. Thus, the selection of a dominant tree is perfectly assured in this sample structure.
2.3. Average Height of the Stand

Strand in his work had not presented the solution to obtain the average height of the sample unit, since the method does not presuppose to measure individual heights [1] . The sampling is conducted with selection proportional to the height of the trees, using the scientific formulation proposed by Lorey.
With two approaches used in the same unit you can avail this condition to reach a consistent estimator of average height of Lorey.
Consider the estimator of volume obtained by Strand, presented in (4), i.e., after the inclusion of cluster unit, however with indexing of the diameters for this first estimation method, i.e., as is shown in (8):
 (8)
(8)
Consider, in addition that, if the estimator is developed for the basal area in (1), we are also able to obtain the volume of trees per hectare, qualified in the sampling methodology indexed as 2, as is shown in (9).
 (9)
(9)
where
 is the average height of Lorey Assuming that both estimators are consistent and
provide results so similar, such that if you can accept them as equals, i.e.
is the average height of Lorey Assuming that both estimators are consistent and
provide results so similar, such that if you can accept them as equals, i.e. , then equating the estimators (8) and (9) you get:
 (10)
(10)
and the average height of Lorey can be obtained easily as follows
 (11)
(11)
2.4. Improvement in the Use of Form Factor for Calculating Volume
This method applied for the first time in Brazil by Figueiredo [12] estimates the volume based on the methodology of Hohenadl [13] , cited by Prodan [14] , which divides the bole in n parts of equal relative sizes as a function of the total height of the trees. However, according to Prodan [14] , the smaller is the length of sections closest to the exact will be the estimated value of the volume. In this way, it was decided in this study divide the bole in ten sections of relative length, using the methodology of Hohenadl, as shown in Figure 2.
With the aim of determining the relations between natural and artificial form factor,
Ko introduced the following concept about the mean quadratic diameter
 [15] :
Consider the form factor calculated by Hohenadl:

or:
 (12)
(12)
In that the sum of the square of the diameters of the series, divided by the number
of these, provides the mean quadratic diameter , i.e.:
 (13)
(13)
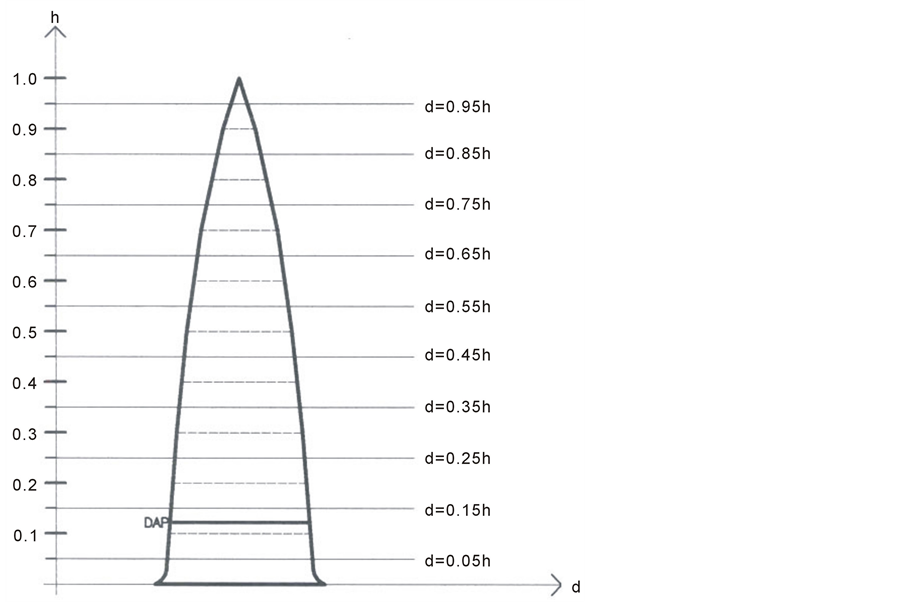
Figure 2. Structure of measurement of the diameters by Hohenadl’s method.
The Hohenadl’s form factor is then obtained as follows:
 (14)
(14)
This concept of form factor has been widespread as is presented in expression (15), which uses a referential diameter used to obtain any desired form factor, assuming that the ten diameters along the bole are taken in relative way:
 (15)
(15)
In that: dx = reference diameter and d0.i = measured diameters in the relative sections.
Taking the mean quadratic diameter as referential diameter, you can obtain the unitary form factor [14] .
 (16)
(16)
The form of the tree, in this case, is equivalent to the cylinder, whose diameter is coincident with the square root of the mean quadratic diameter. In this way, the volume is obtained as follows:
 (17)
(17)
Given the difficulty to find out the location of dq in the boles and
also to measure it, we tried to establish a relationship between the mean quadratic
diameter with the dbh, which is a variable of easier access and measurement, using
regression equations, as proposed by Ko (1968), i.e.
 using parables.
 (18)
(18)
 (19)
(19)
where: a, b and c are the coefficients of the parabolic models.
Replacing the result obtained in (18) or (19) into (17) we can obtain the volume of trees, as suggested by Ko [15] . In work done by Péllico Netto, the best results for the species Araucaria angustifolia were achieved with the equation (19) [16] .
The adjustments were performed using the procedure of linear regression applying the least square method and the parameters were statistically evaluated by t-test at the level of 95% of probability. To check the reliability of these adjusted models, the statistics: standard error (syx%) and adjusted coefficient of determination (R2) were also obtained.
In these circumstances, the volume will be estimated by subunit directly per ha (20), as shown in Equation (8):
 (20)
(20)
The estimator of volume by cluster will be obtained as is presented in (21).
 (21)
(21)
The estimator of average volume for all clusters will be obtained as is presented in (22)
 (22)
(22)
Equating , as shown in (19) and replacing the results
of the function in (23), (24) and (25), the volumetric estimator for each subunit
can be obtained directly as a function of dbh, i.e.:
, as shown in (19) and replacing the results
of the function in (23), (24) and (25), the volumetric estimator for each subunit
can be obtained directly as a function of dbh, i.e.:
 (23)
(23)
The estimator of volume by cluster will be obtained as is presented in (24)
 (24)
(24)
The estimator of average volume for all clusters will be obtained as is presented in (25).
 (25)
(25)
Under the proposed conditions, the estimators will only be obtained if the equation, as shown in (19), is developed previously for the area to be sampled where it will be applied this methodology.
3. Discussion of the Results
By means of sampling performed to a structure of 10 clusters installed in stands of P. elliottii, using firstly the fixed area plots, basal area and volume of wood were obtained after the application of the volume equation. Subsequently, using line sampling as it was proposed by Strand, basal area and volume were calculated. The form factor used was equal to 0.4997, determined by Drescher et al. [17] for the species in question, using the average values of diameter and height (21.4 cm and 16.8 m, respectively).
3.1. Calculation of Volume
To obtain volume, it was measured initially the ten bole diameters in each of the trees sampled and calculated their quadratic diameters and these were used to develop the linear regression as a function of dbh, as suggested in (19).
The adjustment resulted in coefficient of determination equal to 0.99 and standard error of the estimate of 5.67%, from the indicated function in (26), and the residuals are presented in Figure 3.
 (26)
(26)
The volumetric calculations for trees, by subunits and by cluster were performed as indicated in (22), (23), (24) and (25).
The results for both approaches are presented in table 2.
It can be observed that both methodologies showed similar results. The estimated mean volume using the methodology of fixed area was 3.4% higher than that calculated by the method of Strand. Referring to the average basal area, both methodologies showed very close values, being the result obtained by the methodology with fixed area 0.06% lower than that obtained using the methodology of Strand (36.143 m2∙ha−1 and 36.166 m2∙ha−1 respectively) (Table 2).
By comparative analysis considering a t-test for independent samples, no statistical differences were found between the means of 10 clusters, referring to basal area (tcalc= 0.00046 < t18;0.025 = 2.44) and volume (tcalc= 0.02453 < t18;0.025 = 2.44).
Consequently, through the analysis of the results, it is concluded that the pps sampling as proposed by Strand, adapted to the system of clusters proved to be efficient, generating results very close to those obtained with the sample by fixed area, thus consolidating the next steps of this study.
3.2. Indirect Determination of the Height of Lorey
Considering each cluster, equations (8) and (9) were assumed to be equivalent to determine the volume. Therefore, by substituting the estimators of volume, the values for the height of Lorey were determined indirectly, using equation (11), considering only the values of diameter and quadratic mean diameter. The values calculated by the indirect method were compared with those obtained in fixed area sampling, as indicated in Table3
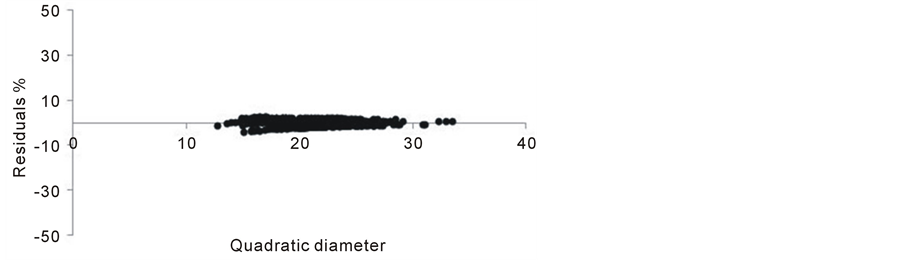
Figure 3. Residuals dispersion for the quadratic diameter.
Table 2. Sample estimators obtained for the two methodologies.
Table 3. Lorey’s average heights evaluated in the clusters.
Both estimates were very similar, with equal means for clusters using the two methodologies. The proximity between the heights was also verified statistically and no differences between the means were detected for the two methods (tcalc = 0.04 < t18;0.025 = 2.44). Therefore, the calculation of indirect height of Lorey from diameters showed to be feasible and efficient, whose estimates were consistent. The process of indirect calculation allows for greater efficiency in the sampling process, making unnecessary the direct measurement of heights.
The methodology proposed is among the most attractive solutions to reduce the cost of inventories in planted forests, with the ability to have greater accuracy and greater scope for information at the level of compartments, without increasing the cost of sampling performed with units of fixed area.
The use of smaller permanent sampling units with higher intensity in the compartments before the final cut will substantially increase the precision of the estimators in these management units, which will enable to eliminate the pre-cut inventory in forest enterprises.
References
- Strand, L. (1958) Sampling for Volume along a Line. Meddelelser Fra Det Norske Skogforsoksvesen, 51, 327-331.
- Péllico Netto, S. and Brena, D.A. (1996) Obtencao da densidade de povoamentos no método de amostragem de Strand. Cerne, 2, 81-90.
- Péllico Netto, S. and Brena, D.A. (1997) Inventário Florestal. The Authors, Curitiba.
- Moreno, J.A. (1961) Clima do Rio Grande do Sul. Secretaria da Agricultura, Porto Alegre.
- Fernandes, A.V. and Backes, A. (1998) Produtividade primária em floresta com Araucaria Angustifolia no Rio Grande do Sul. Iheringia Série Botanica, 51, 63-78.
- Nimer, E. (1990) Clima. In: IBGE—Instituto Brasileiro de Geografia e Estatística, Ed., Geografia do Brasil: Regiao Sul, IBGE, Rio de Janeiro, 151-187.
- USDA-Soil Survey Staff (1999) Soil Taxonomy—A Basic System of Soil Classification for Making and Interpreting Soil Survey. 2 Edition, USDA, Washington.
- Kaul, P.F.T. (1990) Geologia. In: IBGE—Instituto Brasileiro de Geografia e Estatística, Ed., Regiao Sul, IBGE, Rio de Janeiro, 29-54.
- Elesbao, L.E.G. (2011) Performance do Pinus elliottii Engelm. e Pinus taeda L. em áreas arenizadas e degradadas no Oeste do Rio Grande do Sul. Dissertation, Universidade Federal de Santa Maria, Santa Maria.
- Bitterlich, W. (1952) Die Winkelzahlprobe. Ein optisches Mebverfahren zur raschen Aufnahme besonders gearteter Probeflachen für die Bestimmung der Kreisflachen pro Hektar an stehenden Waldbestanden. Forstwissenschaftliches Centralblatt, 71, 215-225. http://dx.doi.org/10.1007/BF01821439
- Assmann, E. (1970) The Principles of Forest Yield Study. Pergamon Press, New York.
- Figueiredo, D.J. (1982) A utilizacao do diametro quadrático médio (dq2) em estimativas volumétricas de Eucalyptus grandis Hill Ex-Maiden, na Regiao Central do Paraná. Thesis, Universidade Federal do Paraná, Curitiba.
- Hohenadl, W. (1923) Der Aufbau der Baumschafte. Forstwissenschaftliches Centralblatt, 46, 460-470.
- Prodan, M. (1965) Holzmesslehre. Sauerlander’s Verlag, Frankfurt.
- Ko, Y.Z. (1968) Beziehungen zwischen formquotienten und formzahl. Dissertation, Naturwissenchaftlich-Mathematische Fakultat der Albert-Ludwigs Universitat zu Freiburg, Freiburg.
- Péllico Netto, S. (1986) Desenvolvimento de uma nova funcao volumétrica. Acta Forestalia Brasiliensis, 1, 9-17.
- Drescher, R., Schneider, P.R., Finger, C.A.G. and Queiroz, F.L.C. (2001) Fator de forma artificial de Pinus elliottii Engelm para a regiao da Serra o Sudeste do estado do Rio Grande do Sul. Ciência Rural, 31, 37-42. http://dx.doi.org/10.1590/S0103-84782001000100006
NOTES

*Corresponding author.