Open Journal of Forestry
Vol.07 No.02(2017), Article ID:75687,15 pages
10.4236/ojf.2017.72017
Impact of a Low Severity Fire on Soil Organic Carbon and Nitrogen Characteristics in Japanese Cedar Soil, Yamagata Prefecture, Japan
Felix Seidel1,2, M. Larry Lopez C1*, Georg Guggenberger2, Yoshihiro Nobori1
1Faculty of Agriculture, Yamagata University, Yamagata, Japan
2Institute of Soil Science, Leibniz Universität Hannover, Hannover, Germany

Copyright © 2017 by authors and Scientific Research Publishing Inc.
This work is licensed under the Creative Commons Attribution International License (CC BY 4.0).
http://creativecommons.org/licenses/by/4.0/


Received: January 13, 2017; Accepted: April 24, 2017; Published: April 27, 2017
ABSTRACT
Slash and burn practices are widely used around the globe with different degrees of success which are mostly related to the impact of fire on soil properties. In Japan slash and burn practises, known as Yakihata, have a long history and are still used in Yamagata Prefecture today. The purpose of this study was to determine the impact of a low severity controlled fire underneath Japanese cedar (Cryptomeria japonica) on brown forest soil (Cambisol). Japanese Cedar is the dominant species among plantations in Japan. We measured organic carbon and nitrogen content as well as changes in carbon (δ13C) and nitrogen (δ15N) stable isotope composition in a steep west facing slope under heavy precipitation (~2600 mm/a) and heavy snowfall (~3 to 4 m/a). The accumulation of Ctotal and Ntotal at the bottom of the slopes was remarkably higher at the slash and burned site than in the control forest site. After slash and burn δ15N isotopes in the slope in general became significantly lighter than in the control forest while the δ13C did not show any significant difference between the two sites except at the bottom of the slopes where δ13C was heavier in the forest. The results show that Ctotal and Ntotal values as well as the isotopes ratios of C and N change with decreasing elevation in the forest as well as in the burned site being consistent with leaching and erosion. The changes in soil nitrogen and carbon isotopes at the bottom of the slope appear to be related to the transport of material with different isotopic composition from the upper slope. The effect of the low severity fire (as part of the slash and burn practice) on soil organic carbon and nitrogen movement was enhanced by the steepness of the slopes and the high precipitation of Shonai region.
Keywords:
High Precipitation, Japanese Cedar Forest Soil, Low Severity Fire, Stable Isotopes, Steep Slopes

1. Introduction
Japan consists of 73% rugged and mountainous areas which are not suitable for settlement or agriculture and therefore covered by forest ( Sasse, 1998;Pohl, 1986). Steep slopes with more than 15˚ inclination form 48% of the country’s land mass and slopes with an inclination of more than 8˚, 71% (Pohl, 1986). Thus, mountain forests always played an important role in the Japanese civilization, providing the people with food, fuel, building materials, fertilizer and fodder for husbandry in the less steep areas. Nowadays there are more than 10 million hectares (30% of the total land area) of plantations in Japan, with 44% Cryptomeria japonica, 24% Chamaecyparis obtusa and Pinus species as well as Larix kaempferi, Abiessachalinensis and Piceajezoensis covering 30%.
The Japanese Yakihata is a small scale controlled fire of low severity and intensity that takes place in cedar plantations in a mountainous environment. After the burning root vegetable crops are planted and after their harvest in fall of the same year a new generation of tree seedlings gets planted. Especially in the Japan Sea side of Yamagata Prefecture, which is characterized by heavy snowfall, Yakihata is common and still a wide spread method among local farmers. There are many studies concerning the effect of forest fire on soil chemical composition all over the world ( Krasnoshchekov, 1994 ; Kleinmann et al., 1995; Prieto- Fernández et al., 2004; Rumpel et al., 2006), but these fires are of high intensity, large scale and not well controlled in flat areas. In contrast, the low intensity fire used in our study area has been poorly investigated.
Fire in steep slopes under heavy precipitation leads to a change not only in available nitrogen but also in carbon cycling and thus humans are directly controlling the carbon and nitrogen balance of these plantations ( Tamm, 1991 ; Vitousek & Howarth, 1991 ; Näsholm et al., 1998 ; Högberg et al., 1996 ; Perakis & Hedin, 2002 ; Magnani et al., 2007 ; Dagvadorj et al., 2009 ).
It can alter the amounts and distribution of available nitrogen as well as δ15N ratio due to the change of the soil surface layers’ chemical composition and/or the removal of the soil surface layers because of erosion ( Hobbie & Ouimette, 2009)
The slash and burn practises in high precipitation and heavy snowfall areas of typ-ical Japan Sea mountain forests offer an opportunity to study the impact of low intensity fires on available nitrogen and δ15N of soils where Japanese cedar seed-lings (Cryptomeria japonica) will be replanted and thus, it is essential to know the nitrogen availability of the soils for a suitable growth of the new seedlings.
The aims of this study are to test the following hypotheses:
1) Available nitrogen (  and
and  ) increases as a result of a low severity fire along the slope but with higher concentrations at the bottom of the slope.
2) Due to high precipitation and heavy snowfall soil organic carbon and nitrogen, as well as carbon (δ13C) and nitrogen (δ15N) stable isotope composition is not evenly distributed in the slope. This spatial difference is enhanced by a low severity fire.
2. Methods
2.1. Study Site
The study site is located in north eastern Japan, Yamagata Prefecture, in the northernmost area of the Asahi Mountains, which are part of the Echigo Mountain Range (N38˚32.362' E139˚51.701') with an average annual precipitation of 2558 mm falling mainly in winter as snow (Figure 1). It is characterised by steep slopes with an average steepness of 68% making this area prone to erosion if the forest and vegetation cover in the slopes gets slashed and burned ( DeBano, 2000).
The fire in our research site was conducted on September 9th 2014. The remnants of the clear cutting (e.g. branches, twigs etc.) were placed on the to be burned area and the fire was started with the burning of dried branches. It was a ground fire of a logged area which is less severe than a wild fire because the intensity and duration is much lower and shorter. Further, the soil is relatively moist because of typically heavy rainfalls in the month before the conducted controlled burning. This moisture promotes a low severity fire and the soil temperatures do not exceed 95˚C until all water is vaporized; the temperature then does usually not exceed 200˚C - 300˚C within the first 5 cm of mineral soil. Further, nearly no heating occurs below 20 - 30 cm soil depth ( Certini, 2005).
2.2. Sample Collection and Treatment
The sampling sites are situated next to each other being separated by 15 m. The slopes are 75 m long and in the top parts 30 m wide. More to the bottom of the slopes, after 40 m downhill, they narrow to a width of 20 m due to the natural shape of the slopes. The total difference in elevation is 42 m (68%) from top to bottom in both sites. They were divided into plots of 10 m by 10 m, only the plots at the very bottom of the slope are 5 m by 10 m (Figure 2). The forest site (Control site, C-site) has more trees and a higher tree density than the burned site (B-site) had before fire. Further the trees are more evenly distributed along the slope than in the B-site (Figure 3). The B-site is split into the upper B-site and the lower accumulation area (Acc-area) which can be found at the bottom 5 m of the B-site.

Figure 1. Climate data of the meteorological station in the study site.

Figure 2. Schematic of the sampling in the forest site (C-site) on the left and the burned site (B-site) on the right.

Figure 3. Schematic of tree distribution in the forest site (C-site) on the left and the burned site (B-site) on the right.
A total of four soil pits (150 cm × 100 cm × max. depth) was dug in the middle line of the top 40 m for each site. Further, 32 small pits (30 cm × 30 cm × 30 cm) were dug for an increment sampling to gain more detailed information on both research sites. The amount of samples taken from soil pits in the C-site is 37 while in the B-site it is 32 of which belong 6 to the Acc-area. The number differs due to differences in horizon sequence. 96 increment samples were taken in the C-site, and 96 in the B-site of which 21 belong to the Acc-area.
Soil samples were taken in October 2014 in a steep west facing slope of a Cryptomeria japonica dominated plantation as well as on a freshly burned slope (three months before the sampling) on quartz rough surface rock under brown forest soil. Due to restrictions replication in other sites was not possible, so we used pseudo replication in this study.
Each soil pit was dug up to until solid rock was reached or the ground was too hard to dig without heavy machinery. The profile layers were identified and characterised by colour, grain size and the substrate to classify the soil features. (IUSS Working Group WRB, 2014) (Photo 1 and Photo 2).
For the analysis in the laboratory samples were taken from the identified horizons.
Further, to gain more detailed information on the spatial distribution of measured parameters increment samples were taken from three different depths (0 - 1 cm, 1 - 7 cm, 7 - 15 cm).
All samples were stored in plastic bags directly after sampling on October 21st 2014. After transportation from the field to the laboratory the samples were stored frozen until further preparation for analysis. Only the samples for nitrate and ammonium measurement were freshly taken from the field and directly sieved (<2 mm) and prepared for analysis.
The soil samples were unfrozen, air dried and sieved (<2 mm). For the total
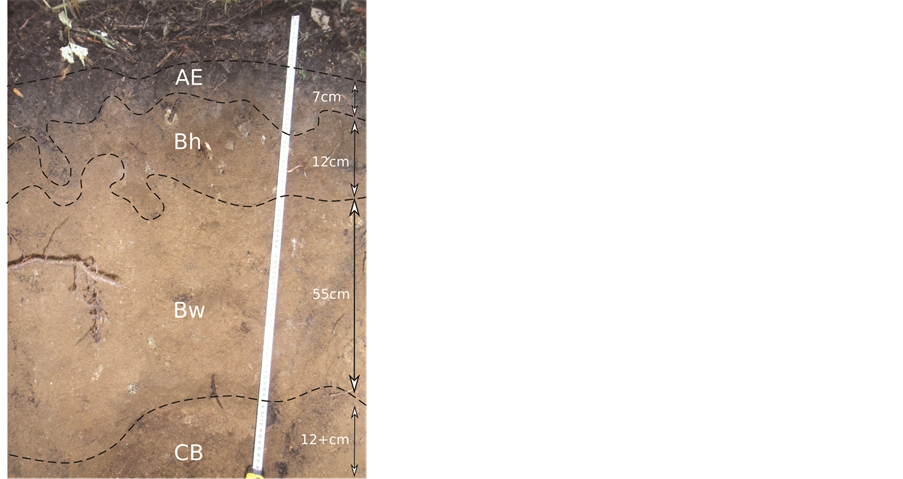
Photo 1. Soil profile of the forest where the horizons can be clearly distinguished.
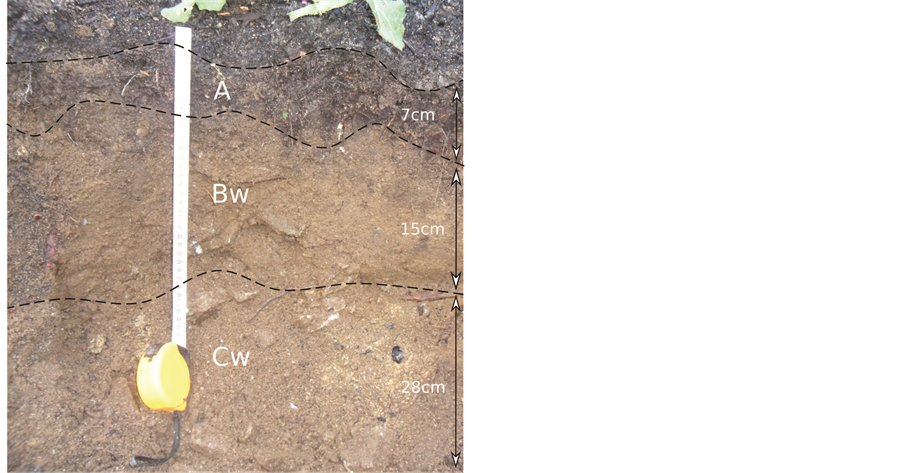
Photo 2. Soil profile of the burned site where the horizons can be clearly distinguished.
carbon and total nitrogen as well as the isotope measurement the samples were unfrozen then air-dried, sieved (<2 mm), ground and dried in a furnace at 105˚C.
2.3. Analysing Methods
2.3.1. Soil Texture
Soil texture was measured with the pipette gravitational sedimentation method as described in the BCR Information report (1980).
In order to receive soil texture classes, 10 g fine material (<2 mm) was treated with a 30% solution of H2O2 in order to remove organic material from the sample. The remaining material was dispersed with Na4P2O7 and shaken for at least 3 h in order to destroy soil aggregates. Silt and clay fractions were determined according to Geeand Bauder (1986) with the distribution of 63 to 20 μm, 20 to 6.3 μm, 6.3 to 2 μm and <2 μm fractions. The pipette method was followed by wet sieving to isolate sand fractions of 2000 to 630 μm, 630 to 200 μm and 200 to 63 μm. Afterwards, the samples were dried at 105˚C.
The bulk density was measured with a core cutter containing 50 cm3 of soil sample. These cores were weighed, then dried at 105˚C in a furnace and weighed again.
2.3.2. Cation Exchange Capacity
1 g of soil was weighed in and 30 ml of a thiourea and silver solution was added. After 1 hour of shaking the samples were centrifuged for 10 minutes at 1200 g. The cation exchange capacity (CEC) was then measured with the AAS Analyst (Perkin Elmer, USA). The Standard was made by Merck (Germany).
2.3.3. Total Carbon and Total Nitrogen
All samples were weighed with the A120s (Sartorius analytic, Japan) and 400 mg of each specimen was weighed out and put into ceramic shuttles as well as a shuttle containing 100 mg of the standard (Chameleon Reagent DL-Aspartic acid HOOCCH2CH(NH2)COOH).
For the determination of total carbon (Ctotal) and total nitrogen (Ntotal) a SUMIGRAPH NC-220F automatic high sensitive NC analyzer SCAS was used. The samples and standards were burnt at 870˚C.
2.3.4. Isotope Analysis
The samples were weighed with the ME5 high accuracy balance (Sartorius analytic, Japan). The specimens were weighed out between 3.9 and 4.1 mg and folded into tin shuttles. For the determination of δ13C ratios and δ15N ratios the Thermo Scientific Flash 2000 Organic Elemental Analyzer, DELTA V ADVAN- TAGE Isotope ratio MS (Japan) was used. For calibration 1 mg of histidine was used. The samples and standards were completely burnt at 1800˚C.
2.3.5. Extractable Ammonium and Nitrate
10 g of each fresh sample were weighed (ASP402F balance, AS PRO, Japan) out and 50 ml of 1 M KCl were added. After one day the samples were filtered and shaken for 30 minutes with the Shaker SA 300 (Yamato, Japan). They were filtered (filter paper No. 6, 125 mm, ADVANTEC, Japan) and stored in a cold dark place for up to four weeks.
The method used for determining ammonium content is taken from Anderson & Ingram (1989). 10 g of wet sieved (<2 mm) soil were treated with 50 ml of 1 M KCl and shaken for 30 minutes. These samples were treated with two different solutions described in Anderson & Ingram (1989) during analysis whereas the method for nitrate content was taken from Hayashi et al. (1997). 10 g of wet sieved (<2 mm) soil were treated with 50 ml of 1 M KCl and shaken for 30 minutes and treated with hydrazine.
The measurement of ammonium and nitrate content was conducted with the U-2900 Spectrophotometer with an attached AS-1010 Auto sampler (Hitachi, Japan).
2.3.6. Statistical Analysis
An ANOVA with following Scheffé and Bonferroni & Holm multiple comparison calculation was carried out to determine the statistical significance of differences in total carbon, total nitrogen, extractable ammonium and nitrate, as well as δ13C ratios and δ15N ratiosat the significance levels of 0.5 and 0.1 for the C-site, the B-site and the Acc-area.
3. Results
3.1. Soil
All dug soil pits are haplic Cambisols according to by the IUSS Working Group WRB (2014) independent of their location. The C-site soil pits are characterized by a horizon sequence of an eluviated top soil layer (AE), followed by a subsoil horizon enriched in humic substances (Bh) and a weathered horizon (Bw). Finally, a transition horizon to the parent material (CB) connects. The soils at the B-site is lacking the signs of leaching and the soil pits feature a sequence of an A, Bw and a weathered parent materialhorizon (Cw) (Table 1). Generally, the soils are sandy with an average pot. pH of 4.1. The Acc.-area’s pH is more basic than the C-site (Table 1).
3.2. Total Carbon and Total Nitrogen
Total carbon and total nitrogen decreased as soil depth increased (Table 2). In general, the C and N contents were 1.1 times higher in the soils of the C-site than in the soils of the B-site (p > 0.05). Further, the values of the soils of the Acc-area were 1.4 times for Ctotal (p < 0.05) and 1.7 times for Ntotal (p < 0.05) higher than in the C-site’s soils. Among the elevation gradient contents of Ctotal and Ntotal in the B-site’s soils tended to increase from top to bottom (p > 0.5) (top of the slope 24 [mg/g], bottom of the slope 37.6 [mg/g]) (Table 3).

Table 1. Soil properties.
*C1 is found on the top of the slope, C4 at the bottom. The burned site is divided into the upper area in the slope, referred to as burned site (B1 to B4) and the lower area at the bottom of the slope referred to as accumulation area (B5).
Table 2. Soil analysis of the soil pit sampling per horizon.
*The Accumulation area is located at the bottom of the burned site.
Table 3. Soil analysis of the soil pit sampling along the elevation gradient.
*1C1 is found on the top of the slope, C4 at the bottom. The burned site is divided into the upper area in the slope, referred to as burned site (B1 to B4) and the lower area at the bottom of the slope referred to as accumulation area (B5); *2The Accumulation area is located at the bottom of the burned site
3.3. Soil Inorganic Nitrogen
The ammonium content of the increment pits in the C-site was 1.2 times higher than in the B-site’s increment pits and in both, it tended to increase insignificantly (p > 0.05) with decreasing elevation (C-site 1.3 times higher than at the top, B-site 1.2 times, respectively). The nitrate content of the samples of the C-site tended to be higher than the B-site’s samples In the C-site’s soils, along the elevation gradient, the amounts were more evenly distributed than in the B-site’s soils. There was a decreasing trend from top to bottom (Table 3).
3.4. δ13C and δ15N Isotope Ratio
The δ13C ratio of the research sites’ soils all behaved the same; as soil depth increased the isotopes became heavier within the first 30 cm. Further, the soil δ13C in the C-site’s soils tended to be slightly heavier (−26.5‰ ± 1.1‰) than the B-site’s soils (−26.7‰ ± 0.7‰) and the Acc-area’s soils (−26.8‰ ± 1.6‰) (p > 0.05).
Within the first 30 cm as soil depth increased the δ15N isotopes became hea- vier (Table 3). The δ15N ratio of the research sites’ soils differed significantly (p < 0.01) from each other; the values of the C-site’s samples (0.6‰ ± 0.4‰) were generally heavier than in the B-site’s samples (−0.3‰ ± 0.6‰). The Acc-area’s samples had similar values as the C-site’s samples (0.5‰ ± 0.4‰). For both sites the increment sampling showed that the heavier isotopes were found at the bottom of the slope.
4. Discussion
4.1. Total Carbon and Total Nitrogen
The data shows a different distribution of the measured parameters along the slope after fire. The climate of this region is influenced by heavy rainfalls in summer and heavy snowfall in winter. In the C-site the vegetation cover seems to protect the soil and nutrients from heavy erosion, whereas the slash and burning of the slope removes this cover (Lopez et al., 2012) and thus seems to strongly increase erosion (DeBano, 2000). Combined with the steepness and length of the slope, as well as the sandy texture of the soil, the removal of the vegetation cover in the B-site due to slash and burn seems to highly promote eluviation and eventually erosion not least because of a higher vulnerability to splash erosion (Renard et al., 1997; Do Socorro da Silva, 1997, DeBano, 2000). Further, the influence of the snow might enhance leaching of cations and reduction of pH level during the snowmelt period (Guicharnaud & Paton, 2005).
The values of total carbon and total nitrogen are in agreement with the values found in previous studies for similar research sites in Japan and Norway (Post et al., 1982; Morisada et al., 2003; Callesen et al., 2013; Ugawa et al., 2012). These parameters decreased from top to bottom within the soil mainly because of plant input. Litter fall and its decomposition at the soils surface, as well as processes happening in the rooting zone (e.g. root respiration) are the main source of CO2,  and
and  and it is important to know the characteristics of the driving factors, which are soil temperature, moisture and rainfall. These factors influence the litter remaining mass and affect surface soil dissolved organic carbon and dissolved nitrogen (Shi et al., 2014; Zhou et al., 2014).
In general, the B-site soils had lower contents of total carbon and total nitrogen than the soils in the C-site, which seems to be a typical sign of forest fires because of the burning of the carbon enriched top soil layer (Certini et al., 2011). Further, it may be linked to leaching and erosion (Renard et al., 1997; Do Socorro da Silva, 1997; Certini, 2005) which may explain why the contents of both, total carbon and total nitrogen are elevated in the accumulation area of the burned site.
4.2. Soil Inorganic Nitrogen
High precipitation as well as severe landforms such as steep slopes promote leaching of the highly mobile nitrate (  ) (Hobbie & Ouimette, 2009). In our study site
  concentration was in general low in both sites but burning apparently enhanced leaching in the soil as indicated by the lower
  concentration in the B-site’s soils. The ammonium (
  ) distribution, shows similar patterns. Even low severity fires can promote surface runoff by enhancing the hydrophobicity due to a water-repellent top layer parallel to the surface that decreases soil permeability. The moving ashes on the slope can clog soil pores and thus seal the soil surface leading to a decrease in water holding capacity and eventually increasing runoff and soil erosion (Renard et al., 1997; Do Socorro da Silva, 1997; DeBano, 2000; Certini, 2005).
4.3. Soil Carbon and Nitrogen Isotope Ratio
The δ13C isotope ratio changes with soil depth and elevation; the surface layer is enriched in 12C, the deeper layers are enriched in 13C. The reasons for differences within the soil layers are humification processes. Through biochemical and abiotic processes, the carbon of organic residues is transformed and converted to humic substances at the soil surface changing in turn the δ13C ratio (Quideau et al., 2000; Kramer et al., 2003; Du et al., 2014). Additionally, in the C-site heavier isotopes were found at the bottom of the slope (top of the slope: −26.5‰ ± 1.1‰, bottom of the slope −25‰ ± 0.5‰), whereas at the B-site δ13C became evenly distributed along the slope as shown by the increment sampling which is evidence of depleted carbon material becoming part of the accumulation area.
The result of the δ13C soil pit measurement in the C-site showed that the δ13C first becomes heavier from the AE to the Bh horizon before decreasing with depth. Since the AE horizon is thinner at the bottom of the slope in the C-site a higher number of increment samples taken from the 13C enriched Bh horizon at the bottom of the slope resulting a higher δ13C within the first 15 cm of soil.
In the B-site the distribution of soil δ13Calong the slope was even because of the origin of the samples; the A horizon is thicker at the bottom of the B-site probably caused by erosion leading to a higher number of samples taken from this 12C enriched horizon (Dzurec et al., 1985; Melillo et al., 1989; Garten et al., 2000; Boström et al., 2007; Du et al., 2014). Further, the fire burned the litter layer and left ashes behind with a heavier isotope ratio (Gonzáles-Pérez, 2004; González-Vila et al., 2001) contributing to a difference in δ13C which are then redistributed by rain within the slope.
The δ15N changes with increasing soil depth; the 15N depleted soil layers are at the top, the 15N enriched at the bottom. This is in accordance to the literature and there are several mechanisms contributing to these patterns, some of which are litter inputs, fresh belowground inputs and microbial activity (Nadelhoffer & Fry, 1988; Högberg, 1997; Hobbie & Ouimette, 2009). The soil δ15N in the B-site however, was significantly (p < 0.01) lighter than in the C-site, because of changes in the soil surface chemical composition which has also been observed by Hobbie & Ouimette (2009). Mainly three factors are controlling the 15N distribution in soil profiles; the N transfer by mycorrhizal fungi leading to 15N depleted plant litter at the soil surface, while enriching the subsoil in 15N due to their habitat at the roots of the host plants. Secondly, 15N enriched compounds take longer time to get decomposed while 15N depleted compounds get preferably turned over. Lastly, in non-N limited forest ecosystems like our research site, the N loss during nitrification might account for large 15N enrichments with soil depth. Further, along the elevation gradient at the B-site the inorganic nitrogen seems to move down slope depleting the soil of 15N at the top while the Acc-area gets enriched in 15N. The top is constantly losing inorganic nitrogen, while the bottom enriches, which is evidence of depleted nitrogen material becoming part of the accumulation area and thus, promoting nitrogen availability and aheavier δ15N ratio in the accumulation area in comparison to the upslope situation.
5. Conclusion
In summary, the steep slopes in combination with high precipitation in summer and in winter, prompts surface runoff. After the low severity fire, surface runoff seemed to be strongly enhanced as indicated by changes in distribution and concentration of nutrients along the slope. δ15N and δ13C values were in agreement with the spatial changes of soil nitrogen and carbon along the slopes after a low severity fire. A significant increase of available nitrogen because of a low severity fire was not observed. Instead, we found a different distribution of the available nitrogen. The growth of cedar seedlings will be probably influenced by the spatial nutrient distribution caused by the low severity fire with seedlings at the bottom benefitting more than those at the top.
Acknowledgements
This work was supported by funds of the “Leibniz PROMOS” program from Leibniz University, Hannover. I am grateful to Oliver Donnerhack and Ulrike Pieper from Leibniz University Hannover for measuring texture and conducting the CEC analysis as well as Leopold Sauheitl for giving me valuable advice. Furthermore, I want to thank the staff of the University forest of Yamagata University for keeping the site accessible in both summer and winter. Thanks also to Alex Brandtand André Sebastian Schmidtand all the students from the watershed conservation laboratory in the Faculty of Agriculture of Yamagata University.
References
- 1. Anderson, J., & Ingram, I. (1989). Colorimetric Determination of Ammonium. Tropical Soil Biology and Fertility. Wallingford: ISSS, CAB International. [Paper reference null]
- 2. BCR Information (1980). Certification Report on Reference Materials of Defined Particle Size. EUR 6825 EN. [Paper reference 12]
- 3. Boström, B., Comstedt, D., & Ekblad, A. (2007). Isotope Fractionation and 13C Enrichment in Soil Profiles during the Decomposition of Soil Organic Matter. Oecologia, 153, 89-98.
https://doi.org/10.1007/s00442-007-0700-8 [Paper reference null] - 4. Callesen, I., Nilsson, L. O., Schmidt, I. K., Vesterdal, L., Ambus, P., Christiansen, J. R., Högberg, P., & Gundersen, P. (2013). The Natural Abundance of 15N in Litter and Soil Profiles under Six Temperate Tree Species: N Cycling Depends on Tree Species Traits and Site Fertility. Plant and Soil, 368, 375-392. [Paper reference null]
- 5. Certini, G. (2005). Effects of Fire on Properties of Forest Soils: A Review. Oecologia, 143, 1-10.
https://doi.org/10.1007/s00442-004-1788-8 [Paper reference 6] - 6. Certini, G., Nocentini, C., Knicker, H., Arfaioli, P., & Rumpel, C. (2011). Wildfire Effects on Soil Organic Matter Quantity and Quality in Two Fire-Prone Mediterranean Pine Forests. Geoderma, 167-168, 148-155. [Paper reference null]
- 7. Dagvadorj, D., Natsagdorj, L., Dorjpurev, J., Namkhainyam, B. et al. (2009). Mongolia Assessment Report on Climate Change 2009. Mongolia: Ministry of Environment, Nature and Tourism. [Paper reference 1]
- 8. DeBano, L. F. (2000). The Role of Fire and Soil Heating on Water Repellency in Wildland Environments: A Review. Journal of Hydrology, 231-232, 195-206. [Paper reference 1]
- 9. Do Socorro da Silva, M., Nilton Curi, L., Granate De Sá e Melo Marques, J. J., & Sobrinho, F. E. (1997). Evaluation of Characteristics of Cambisols Derived from Limestone in Low Tablelands in North-Eastern Brazil: Implications for Management. Published and presented in 15th World Congress of Soil Science, Acapulco, México, July 1994. [Paper reference null]
- 10. Du, B., Liu, C., Kang, H., Zhu, P., Yin, S. et al. (2014). Climatic Control on Plant and Soil δ13C along an Altitudinal Transect of Lushan Mountain in Subtropical China: Characteristics and Interpretation of Soil Carbon Dynamics. PLoS ONE, 9, e86440.
https://doi.org/10.1371/journal.pone.0086440 [Paper reference 2] - 11. Dzurec, R. S., Boutton, T. W., Caldwell, M. M., & Smith, B. N. (1985). Carbon Isotope Ratios of Soil Organic Matter and Their Use in Assessing Community Composition Changes in Curlew Valley, Utah. Oecologia, 66, 17-24.
https://doi.org/10.1007/BF00378547 [Paper reference null] - 12. Garten, C. T., Cooper, L. W., Post III, W. M., & Hanson, P. J. (2000). Climate Controls on Forest Soil C Isotope Ratios in the Southern Appalachian Mountains. Ecology, 81, 1108-1119. https://doi.org/10.1890/0012-9658(2000)081[1108:CCOFSC]2.0.CO;2 [Paper reference null]
- 13. Gonzáles-Pérez, J. A., Gonzaléz-Vila, F. J., Almendros, G., & Knicker, H. (2004). The Effect of Fire on Soil Organic Matter—A Review. Environment International, 30, 855-870. [Paper reference null]
- 14. González-Vila, F. J., Tinoco, P., Almendros, G., & Martín, F. (2001). Pyrolysis-GC-MS Analysis of the Formation and Degradation Stages of Charred Residues from Lignocellulosic Biomass. Journal of Agricultural and Food Chemistry, 49, 1128-1131.
https://doi.org/10.1021/jf0006325 [Paper reference 1] - 15. Guicharnaud, R., & Paton, G. (2005). An Evaluation of Acid Deposition on Cation Leaching and Weathering Rates of an Andosol and a Cambisol. Journal of Geochemical Exploration, 88, 279-283. [Paper reference 1]
- 16. Hayashi, A., Sakamoto, K., & Yoshida, T. (1997). A Rapid Method for Determination of Nitrate in Soil by Hydrazine Reduction Procedure. Japan: Nippon Dojō Hiryōgaku Zasshi, 68, 322-326. (In Japanese with English summary) [Paper reference 6]
- 17. Hobbie, E., & Ouimette, A. P. (2009). Controls of Nitrogen Isotope Patterns in Soil Profiles. Biogeochemistry, 95, 355-371.
https://doi.org/10.1007/s10533-009-9328-6 [Paper reference 15] - 18. Högberg, P. (1997). 15N Natural Abundance in Soil Plant Systems. New Phytologist, 137, 179-203.
https://doi.org/10.1046/j.1469-8137.1997.00808.x [Paper reference null] - 19. Högberg, P., Hogbom, L., Schinkel, H. et al. (1996). 15N Abundance of Surface Soils, Roots and Mycorrhizas in Profiles of European Forest Soils. Oecologia, 108, 207-214.
https://doi.org/10.1007/BF00334643 [Paper reference 1] - 20. IUSS Working Group WRB (2014). World Reference Base for Soil Resources 2014. International Soil Classification System for Naming Soils and Creating Legends for Soil Maps. World Soil Resources Reports No 106, Rome: FAO. [Paper reference null]
- 21. Kleinmann, P. J. A., Pimentel, D., & Bryant, R. B. (1995). The Ecological sustainability of Slash-and-Burn Agriculture. Agriculture, Ecosystems & Environment, 52, 235-249. [Paper reference 1]
- 22. Kramer, M. G., Sollins, P., Sletten, R. S., & Swart, P. K. (2003). N Isotope Fractionation and Measures of Organic Matter Alteration during Decomposition. Ecology, 84, 2021-2025.
https://doi.org/10.1890/02-3097 [Paper reference null] - 23. Krasnoshchekov, Yu. N. (1994). Impact of Fires on Mountainous Sod-Taiga Soils under Larch Forest in Mongolia. ПОЧВОBEДEHИE, No. 9, 102-109. (In Russian with English summary) [Paper reference 1]
- 24. Lopez, C. M. L., Hatano, R., Guggenberger, G., Ohta, T., Gerasimov, E., & Fedorov A. N. (2012). Forest Fires Effects on Carbon Stocks and Soil Chemistry in Central Yakutia, Eastern Siberia. Eurasian Journal of Forest Research, 15, 9-17. [Paper reference null]
- 25. Magnani, F., Mencuccini, M., Borghetti, M., Berbigier, P., Berninger, F., Delzon, S., Grelle, A., Hari, P., Jarvis, P. G., Kolari, P., Kowalski, A. S., Lankreijer, H., Law, B. E., Lindroth, A., Loustau, D., Manca, G., Moncrieff, J. B., Rayment, M., Tedeschi, V., Valentini, R., & Grace, J. (2007). The Human Footprint in the Carbon Cycle of Temperate and Boreal Forests. Nature, 447, 849-851.
https://doi.org/10.1038/nature05847 [Paper reference 1] - 26. Melillo, J. M., Aber, J. D., Linkins, A. E., Ricca, A., Fry, B. et al. (1989). Carbon and Nitrogen Dynamics along the Decay Continuum: Plant Litter to Soil Organic Matter. Plant and Soil, 115, 189-198.
https://doi.org/10.1007/BF02202587 [Paper reference null] - 27. Morisada, K., Ono, K., & Kanomata, H. (2003). Organic Carbon Stock in Forest Soils in Japan. Geoderma, 119, 21-32. [Paper reference null]
- 28. Nadelhoffer, K. F., & Fry, B. (1988). Controls on Natural 15N and 13C Abundances in Forest Soil Organic Matter. Soil Science Society of America Journal, 52, 1633-1640.
https://doi.org/10.2136/sssaj1988.03615995005200060024x [Paper reference null] - 29. Näsholm, T., Ekblad, A., Nordin, A., Giesler, R., Högberg, M., & Högberg, P. (1998). Boreal Forest Plants Take up Organic Nitrogen. Nature, 392, 914-916.
https://doi.org/10.1038/31921 [Paper reference 1] - 30. Perakis, S. S., & Hedin, L. O. (2002). Nitrogen Loss from Unpolluted South American Forests Manly via Dissolved Organic Compounds. Nature, 415, 416-419.
https://doi.org/10.1038/415416a [Paper reference 1] - 31. Pohl, M. (1986). Japan—Geographie-Geshichte-Kultur-Religion-Staat-Gesellschaft-Bildungswesen-Politik-Wirtschaft. Stuttgart-Wien: Institut für Auslandsbeziehungen, Thienemanns Verlag. (In German) [Paper reference 2]
- 32. Post, W. M., Emanuel, W. R., Zinke, P. J., & Stangenberger, A. G. (1982). Soil Carbon Pools and World Life Zones. Nature, 298, 156-159.
https://doi.org/10.1038/298156a0 [Paper reference null] - 33. Prieto-Fernández, á., Carballas, M., & Carballas, T. (2004). Inorganic and Organic N Pools in Soils after Burned or Heated: Immediate Alterations and Evolution after Forest Wildfires. Geoderma, 121, 291-306. [Paper reference 1]
- 34. Quideau, S. A., Anderson, M. A., Graham, R. C., Chadwick, O. A., & Trumbore, S. E. (2000). Soil Organic Matter Processes: Characterization by 13C NMR and 14C Measurements. Forest Ecology and Management, 138, 19-27. [Paper reference null]
- 35. Renard, K. G., Foster, G. R., Weesies, G. A., McCool, D. K., & Yoder, D. C. (1997). Predicting Soil Erosion by Water: A Guide to Conservation Planning with the Revised Universal Soil Loss Equation (RUSLE). Washington DC: U.S. Government Printing Office. [Paper reference null]
- 36. Rumpel, C., Alexis, M., Chabbi, A., Chaplot, V., Rasse, D. P., Valentin, C., & Mariotti, A. (2006). Black Carbon Contribution to Soil Organic Matter Composition in Tropical Sloping under Slash and Burn Agriculture. Geoderma, 130, 35-46. [Paper reference 1]
- 37. Sasse, J. (1998). The Forests of Japan. Japan: Japan Forest Technical Association. [Paper reference 1]
- 38. Shi, J., Ohte, N., Tokuchi, N., Imamura, N., Nagayama, M., Oda, T., & Suzuki, M. (2014). Nitrate Isotopic Composition Reveals Nitrogen Deposition and Transformation Dynamics along the Canopy-Soil Continuum of a Suburban Forest in Japan. Rapid Communications in Mass Spectrometry, 28, 2539-2549.
https://doi.org/10.1002/rcm.7050 [Paper reference null] - 39. Tamm, C. O. (1991). Nitrogen in Terrestrial Ecosystems (p. 115). Berlin: Springer Verlag.
https://doi.org/10.1007/978-3-642-75168-4 [Paper reference 1] - 40. Ugawa, S., Takahashi, M., Morisada, K., Takeuchi, M., Matsuura, Y., Yoshinaga, S., Araki, M., Tanaka, N., Ikeda, S., Miura, S., Ishizuka, S., Kobayashi, M., Inagaki, M., Imaya, A., Nanko, A., Hashimoto, S., Aizawa, S., Hirai, K., Okamoto, T., Mizoguchi, T., Torii, A., Sakai, H., Ohnuki, Y., & Kaneko, S. (2012). Carbon Stocks of Dead Wood, Litter, and Soil in the Forest Sector of Japan: General Description of the National Forest Soil Carbon Inventory. Bulletin of FFPRI, 11, 207-221. (In Japanese) [Paper reference null]
- 41. Vitousek, P. M., & Howarth, R. W. (1991). Nitrogen Limitation on Land and in Sea. How Can It Occur? Biogeochemistry, 13, 87-115.
https://doi.org/10.1007/BF00002772 [Paper reference 1] - 42. Zhou, W.-J., Sha, L.-Q., Schaefer, D. A., Zhang, Y.-P., Song, Q.-H., Tan, Z.-H., Deng, Y., Deng, X.-B., & Guan, H.-L. (2014). Direct Effects of Litter Decomposition on Soil Dissolved Organic Carbon and Nitrogen in a Tropical Rainforest. Soil Biology & Biochemistry, 81, 255-258. [Paper reference 1]