Advances in Materials Physics and Chemistry
Vol. 2 No. 3 (2012) , Article ID: 23241 , 7 pages DOI:10.4236/ampc.2012.23028
Structural and Electrical Conductivity Studies in Nickel-Zinc Ferrite
1Department of Physics, Malla Reddy College of Engineering & Technology, Secunderabad, India
2Department of Physics, Jawaharlal Nehru Technological University Hyderabad, College of Engineering, Nachupally, India
3Department of Physics, Osmania University, Hyderabad, India
Email: *ramu521@gmail.com
Received July 5, 2012; revised August 9, 2012; accepted August 17, 2012
Keywords: Nickel-Zinc Ferrite; Lattice Parameter; X-Ray Density; Bulk Density; Porosity; Electrical Conductivity
ABSTRACT
The magnetic particles of nickel-zinc ferrite with chemical composition Ni1−xZnxFe2O4 were synthesized successfully by citrate precursor auto-combustion method using high purity nitrates and citric acid as chelating agent. The prepared powder of nickel-zinc ferrites was sintered at 1000˚C for 1 hr to obtain good crystalline phase and was used for further study. The X-ray diffraction technique was employed to confirm the single phase formation of nickel ferrite. The X-ray diffraction pattern shows the Bragg’s peak which belongs to cubic spinel structure. The values of lattice constant, X-ray density, bulk density, and porosity were calculated. The temperature dependence of the electrical conductivity plot shows the kink, which can be attributed to ferromagnetic-paramagnetic transition. The activation energy obtained from resistivity plots in paramagnetic region is found to be more than that in ferrimagnetic region. The conduction mechanism in nickel-zinc ferrite particles has been discussed on the basis of hopping of electrons.
1. Introduction
Ni-Zn ferrite is of greater commercial application in the electromagnetic interfaces known as EMI, which is used in hard disk drives, in laptops and other electronic products. Generally, the electrical resistivity of ferrites decreases with the increase of temperature, which shows that ferrites have semiconductor behavior. Ferrites have very high resistivity which is one of the considerations for microwave applications The electrical properties of ferrites are sensitive to preparation method, sintering temperature, sintering time, rate of heating and rate of cooling [1,2]. The study of electrical resistivity produces valuable information on behavior of free and localized electric charge carried in the sample. In Ni-Zn ferrite, at high temperature Zn2+ volatilization results the formation of Fe2+ ions, thereby increasing electron hopping and reducing resistivity [3,4].
In a ferrite we can observe transition from ferro magnetic to para magnetic state as temperature is increasing. The activation energy has been found smaller in ferro magnetic region than para magnetic region [5-7]. The discussion on electrical properties of ferrites is generally explained by carrier hopping model or band structure. Although there are few reports on different properties of Ni-Zn ferrite a systematic investigation about electrical properties is lacking, so there is a need for investigation of electrical properties on Ni-Zn ferrite to understand general properties. Hence in this communication we are reporting electrical properties of Ni-Zn ferrite synthesized by citrate precursor method.
2. Experimental
A series of Ni-Zn ferrite with composition Ni1−xZnxFe2O4 where x = 0.0, 0.2, 0.4, 0.6, 0.8, 0.9 & 1.0 are prepared by citrate precursor method. The advantages of this method over the conventional methods like double sintering, solid state reaction etc. are
1) Capacity to yield a homogenous mixture of the constituent ions.
2) As no ball milling is required, there is a little scope of contamination of materials.
3) In case of conventional methods, there is a possibility of introducing iron impurities during milling this leads in-homogeneity in sample, which affects the magnetic property.
4) This is a simple method which offers a significant saving in time and energy consumption.
5) This is green method, which can yield large product.
The starting materials were nickel nitrate, zinc nitrate, iron nitrate, citric acid and ammonia all of analytical grade. The solution of nickel nitrate (Ni (NO3)2·6H2O, ferric nitrate (Fe(NO3)3·9H2O) and zinc nitrate (Zn(NO3)2·6H2O) in their stoichiometry were dissolved in a de ionized water. Citric acid was then added to the prepared aqueous solution to chelate Ni2+, Zn2+ and Fe3+ in the solution. The molar ratio of citric acid to total moles of nitrate ions was adjusted at 1:3. The mixed solution was neutralized to pH 7 by adding ammonia (NH3) solution. The neutralized solution was evaporated to dry ness by heating at 100˚C on a hot plate with continuous stirring, until it becomes viscous and finally formed a very viscous gel. Increasing the temperature up to 200˚C lead to ignition of gel. The dried gel burnt completely in a self propagating combustion manner to form a loose powder [8,9].
Finally the burnt powder was calcined in air at temperature of 1000˚C for one hour to obtain spinel phase. Afterwards the powder was pressed into pellets of thickness 3 mm and a diameter of 10 mm with press by applying a pressure of 2 tons/in2. The final sintering was done at 1000˚C in air for 12 hours afterwards the pellets were coated with silver paint for better electrical contact. The structural characterizations of all samples were carried out by X-ray diffraction (XRD) and conforms the well defined single phase spinel structure. XRD data were taken at room temperature using CuKα radiation. The dc resistivity (r) of the samples was measured by two-probe or four probe method. Two probe method is used to measure high resistivity of the materials with small errors. Four probe method is more accurate and is used to measure the low resistivity. The primary consideration in using these methods is that of obtaining a minimum amount of contact resistance between the electrodes and the samples. Due to high resistivity of ferrite samples, two probe methods is useful in ferrites, the measurements was taken in the range of temperature between 300 K to 873 K in step of 10 K.
3. Results & Discussions
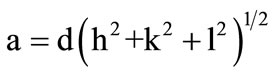
The X-ray diffraction patters of the samples are shown in Figure 1. All the zinc substituted nickel ferrites of the various compositions show the crystalline cubic spinel structure. The sharp peaks showed all-crystalline nature of single phase ferrite. The lattice parameter of individual composition was calculated by using the formula
 (1) [10]
where, a = lattice constant, d = inter planar distance and (h, k, l) are the Miller indices.
The calculated lattice constant “a” is seen to increase from 8.33 Å to 8.52 Å with increase in zinc content as reported in Table 1. The variation of lattice parameter with zinc composition is shown in Figure 2. The lattice parameter is found vary linearly with increasing zinc concentration, there by indicating that the Ni-Zn ferrite system obeys Vegard’s law [11]. A similar behavior of lattice constant with dopant concentration was observed by several investigators in various ferrite systems [12-14]. The variation in lattice constant with zinc content can be explained on the basis of the ionic radii of Zn2+ (0.82 Å) ions is higher than that of Ni2+ (0.78 Å) [15].
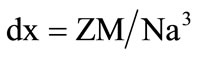
X-ray density (dx) was determined using the following Equation (2)
 (2)
(2)
where Z is the number of molecules per unit cell (Z = 8), “M” is the molecular weight and “N” is the Avogadro’s number.
The bulk density of the specimens has been determined accurately by the hydrostatic method and the percentage of porosity was calculated. The value of the bulk density and the percentage porosity was calculated. The values of the bulk density, X-ray density and the percentage of porosity for Ni-Zn ferrites are given in Table 2. The variation of bulk density with composition is shown in the Figure 3, it can be seen from the table that the bulk density increases and the porosity decreases progressively with addition of zinc to nickel ferrite, zinc ferrite having the least porosity. This conforms the observation that the addition of zinc to nickel ferrite results
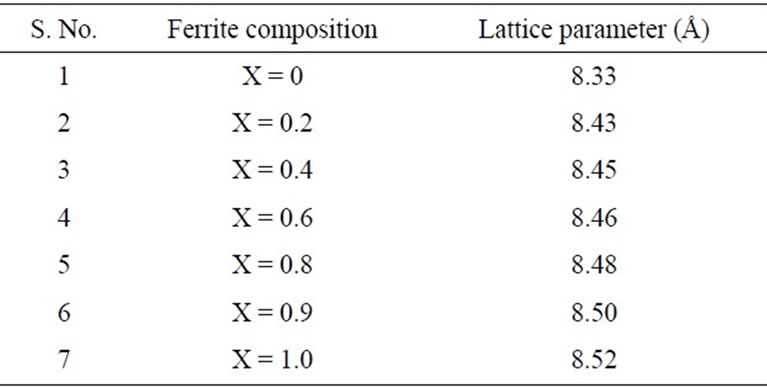
Table 1. lattice parameter data for mixed Ni-Zn ferrite.
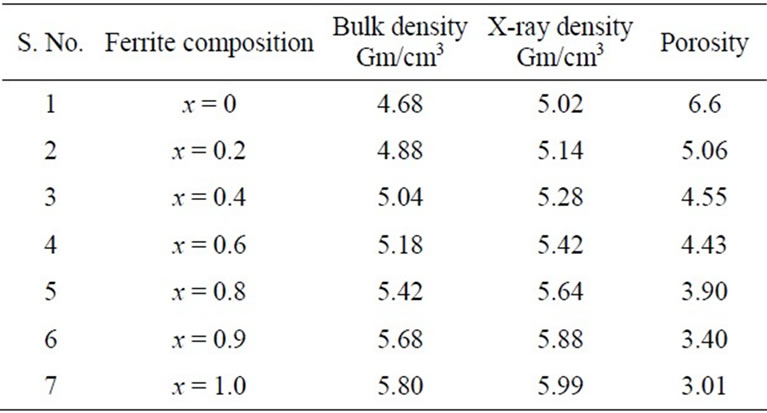
Table 2. Bulk density-ray density and porosity data for mixed Ni-Zn ferrites.
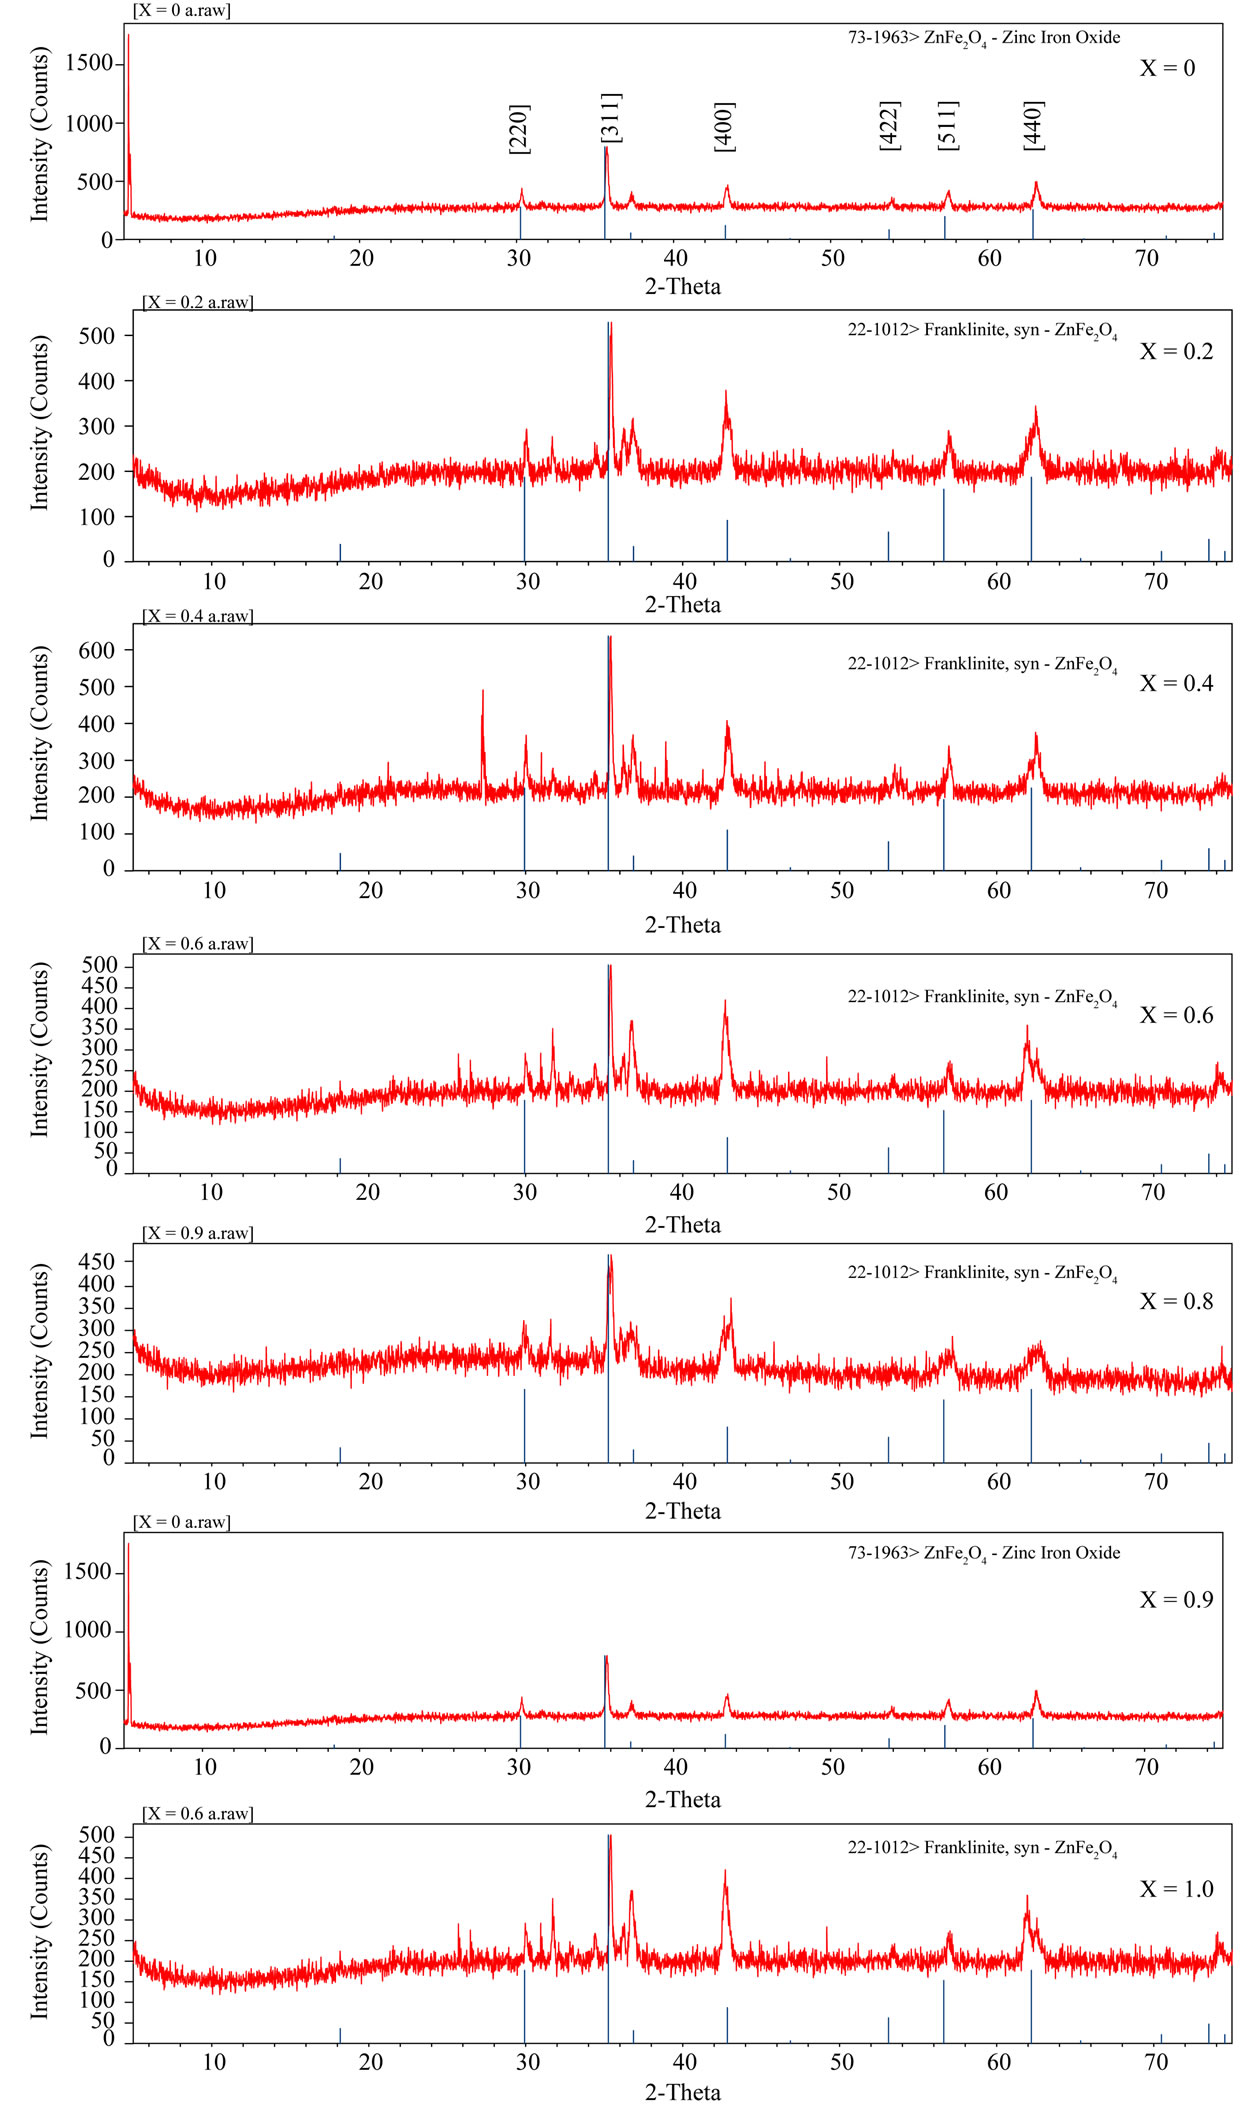
Figure 1. X-ray diffraction studies of mixed Ni-Zn ferrites.
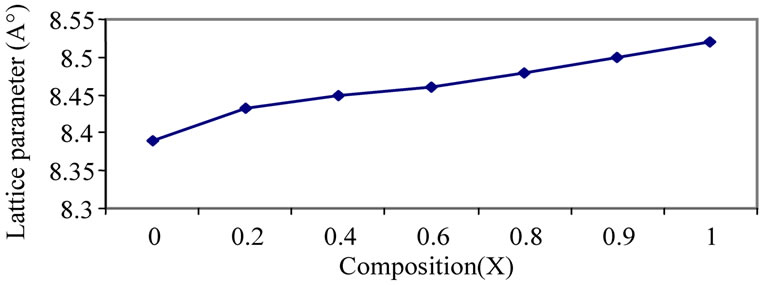
Figure 2. Variation of lattice parameter with compostion.
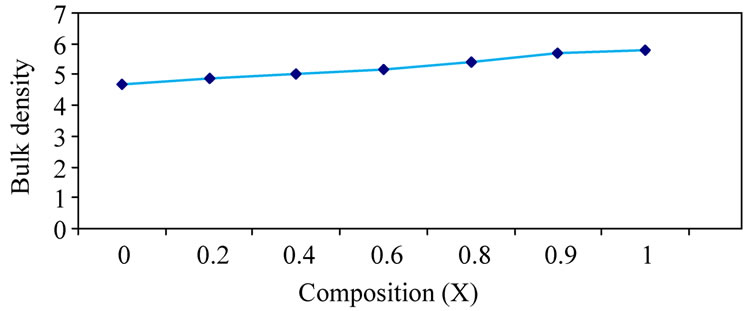
Figure 3. Variation of bulk density with composition.
in densification of the material [16].
3.1. DC Electrical Resistivity
DC electrical resistivity is one of the useful characterization techniques to understand conductivity mechanism. The DC resistivity of the samples is estimated by two probe method. A constant voltage was applied across the series combination of sample holder containing sample and a standard resistance whose value was always less than the sample resistance.
The voltage developed across the standard resistance was measured with help of Keithely nano voltmeter from which the current in the circuit could be readily known. By knowing the value of current and voltage across the sample, resistivity of the sample could be calculated by using the relation
ρ = RA/l Ω·cm (3)
where R: Resistance of the sample;
A: Surface area of the sample = πr2;
R: Radius of the sample;
l: Thickness of the sample.
DC electrical resistivity of the samples was found to be decreased from 1.650 × 10⁶ Ω·cm to 0.12 × 10⁶ Ω·cm with increasing Zn2+ from x = 0.0 to x = 1.0 as mention in the Table 3. The decrease in resistivity may due to presence of Fe2+ ions as zinc is added, which produced during sintering [17]. Another reason for decrease in ρ on increasing zinc composition is due to that Zn2+ ions prefer the occupation of tetrahedral sites (A) and Ni ions prefers the occupation of octahedral sites (B). While Fe ions partially occupies A and B sites. On increasing Zn2+ concentration at A sites, Ni ions concentration at B sites will decrease. This leads to migration of some Fe ions from A site to B site to balance the reduction in Ni ions concentration at B sites. As a result the number of ferric and ferrous ions at B sites which are responsible for electrical conductivity in ferrites increases consequently resistivity decreases by increasing Zn2+ ion concentration. [18,19]. This same trend of resistivity have been reported [20].
The temperature dependence of DC electrical conductivity measured in the temperature range 300 K - 873 K is shown in the Figure 4. Follows Arrhenius plot. This graph shows that by increasing temperature conductivity decreases hence resistivity increases. This conforms that the ferrite under investigation has semi conductor behavior.
The variation of resistivity with composition is shown in the Figure 5.
3.2. Curie Temperature (Tc)
The graphs drawn in the Figure 4, shows slope at particular temperature indicating that sample changing from ferri magnetism to para magnetism, this temperature is known as Curie temperature. The Curie temperature of the samples are mentioned in the Table 3. From the table it is clear that Curie temperature decreases from 602 K to 520 K as Zn2+ composition increasing from x = 0.0 to 1.0. These values are good agreement with Curie temperature determined by Loria method.
The variation of Curie temperature with composition is
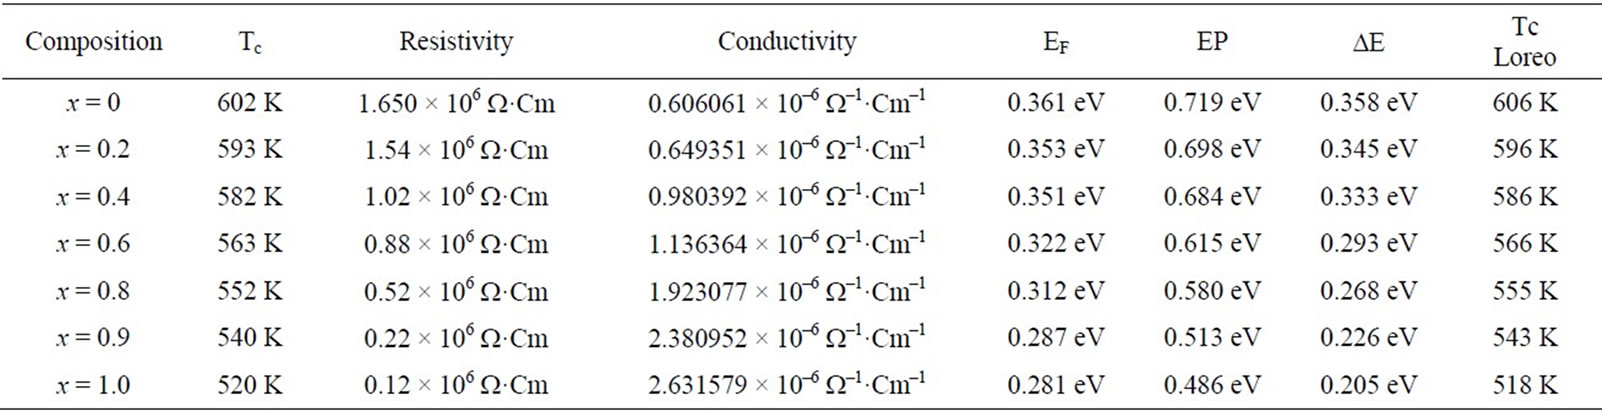
Table 3. Curie temperature, resistivity, conductivity and activationenergies of Ni-Zn ferrites.
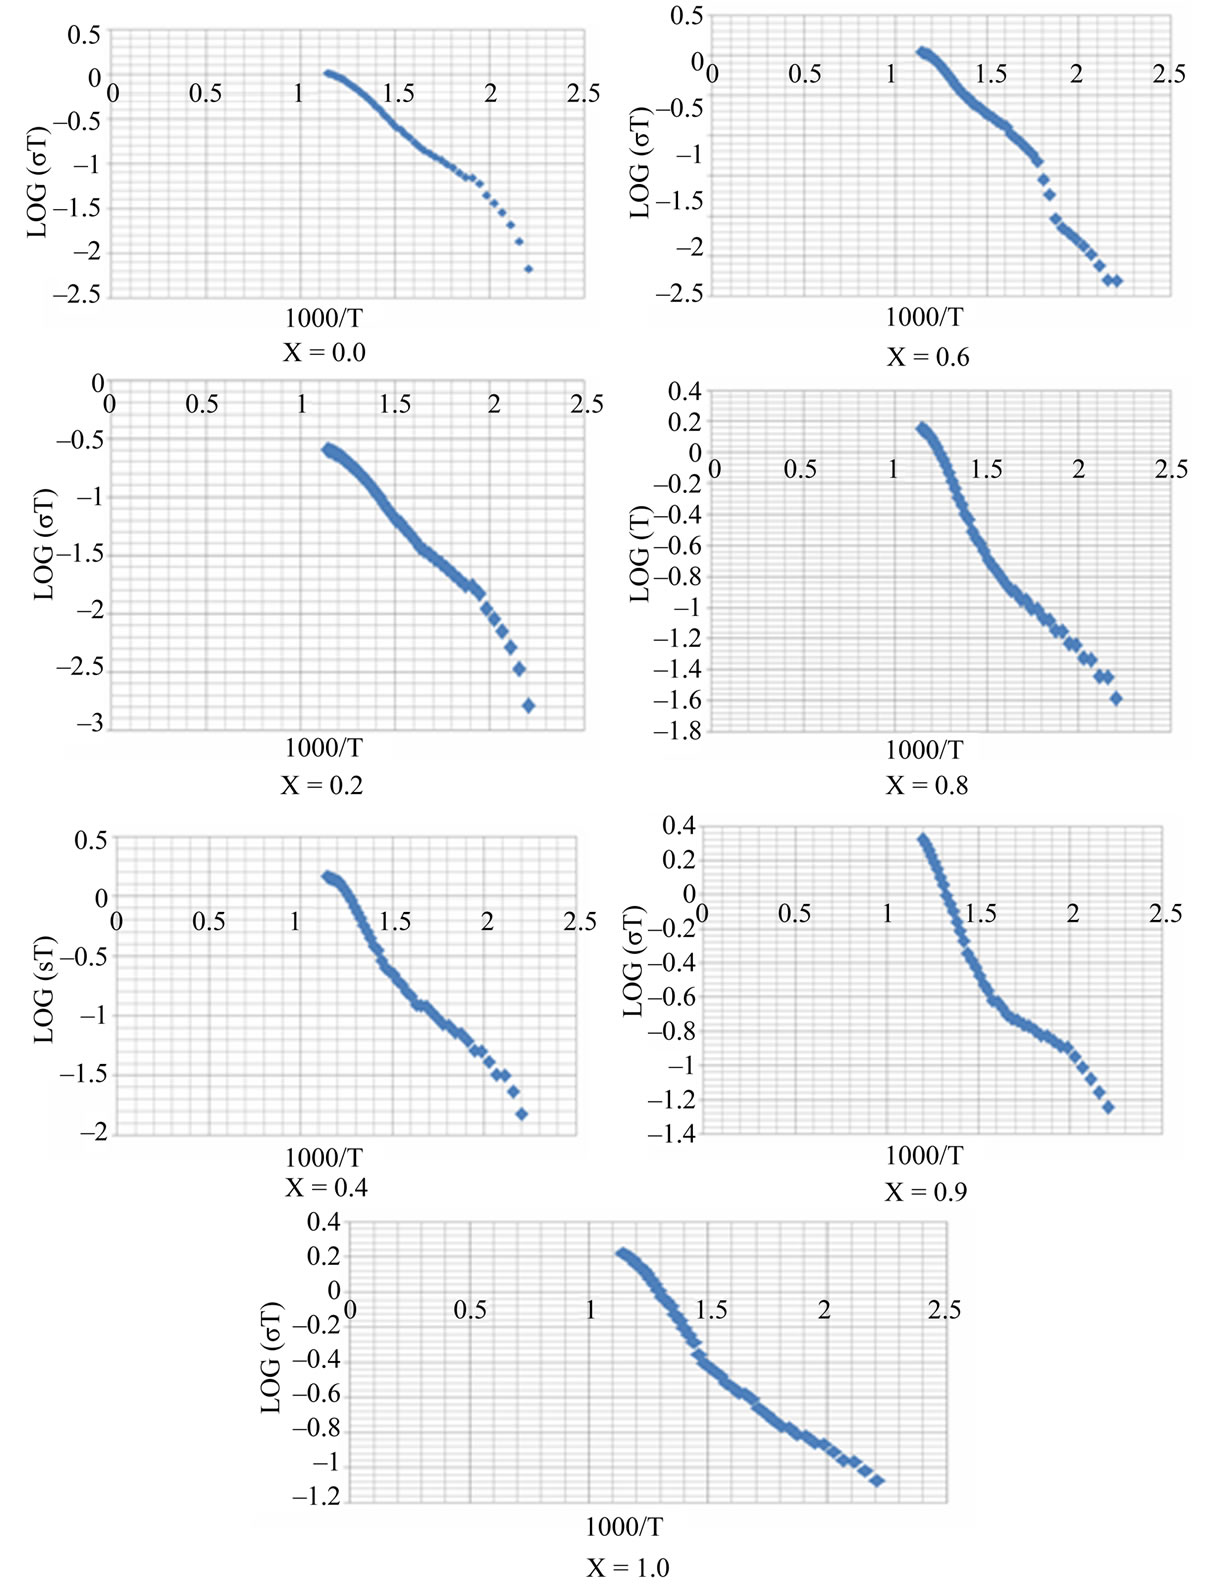
Figure 4. Variation of log(σT) with 1000/T.
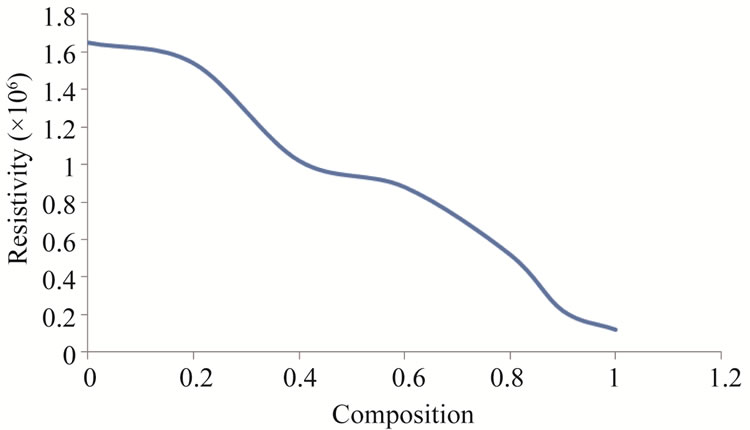
Figure 5. Variation of resistivity with composition.
shown in the Figure 6.
3.3. Activation Energy
Activation energy of the samples measured in the above mentioned temperature was determined by the slope of the linear plots drawn between log(σT) and 1000/T and tabulated in the Table 3 along with the other parameters. The value of activation energy decreases from 0.358 eV to 0.205 eV as Zn2+ composition increases from x = 0.0 to 1.0. The variation of activation energy with composition is shown in the Figure 7.
The decrease in activation energy may be due creation
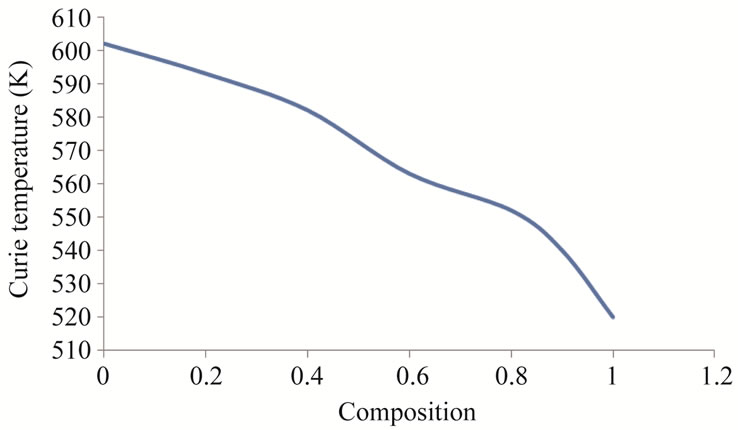
Figure 6. Variation Curie temperature with composition.
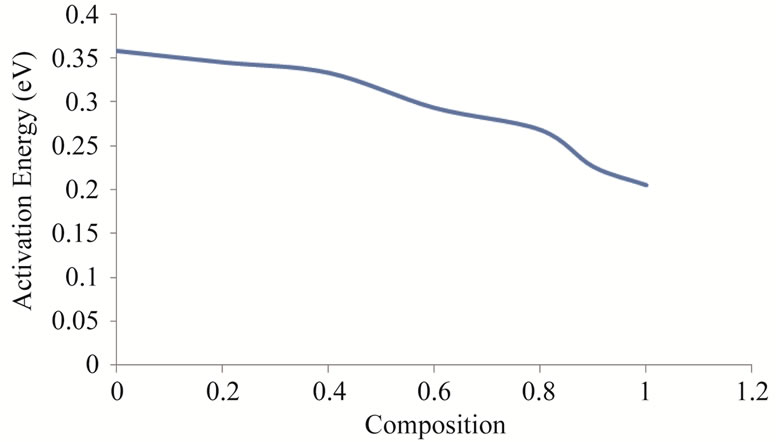
Figure 7. Variation of activation energy with composition.
of smaller number of oxygen vacancies [21]. It may be also due to decrease in resistivity with increase in Zn2+ concentration because activation energy behaves in the same as that of DC electrical resistivity [22]
4. Conclusion
A series of Ni-Zn ferrite with composition Ni1−xZnxFe2O4 where x = 0.0, 0.2, 0.4, 0.6, 0.8, 0.9 & 1.0 are prepared by citrate precursor method. From the X-rd results the samples are pure and crystalline. The lattice parameter increase gradually as Zn2+ composition increases from x = 0.0 to 1.0. Bulk density increases and the porosity decreases progressively with addition of zinc to nickel ferrite, zinc ferrite having the least porosity. DC resistivity decreases gradually from zinc to nickel ferrite. Whereas conductivity increases. Curie temperature of the samples is measured from slope of DC resistivity graphs. It is also observed that Curie temperature, activation energy also decreases from x = 0.0 to 1.0.
5. Acknowledgements
The authors are grateful Prof. P. Kistaiah, Head, Department of Physics, Osmania University, Hyderabad for his encouragement in research work. One of the authors K. Rama Krishna is grateful to V. S. K. Reddy, Principal, Malla Reddy College Of Engineering & Technology, Hyderabad. And the author K. Vijaya Kumar is grateful to Dr. Koorapati Eshwara Prasad, Principal Jntuh College of Engineering, Nachupally, Karim Nagar (Dist).
REFERENCES
- V. R. Kulkarani, M. M. Todhar and A. S. Vaingankar, “Electrical Resistivity & Cation Distribution in CuxCd1 Minus Fe2O4 System,” Indian Journal of Pure and Applied Physics, Vol. 24, 1986, p. 294.
- N. Rezlesus and E. Rezlesus, “Dielectric Properties of Copper Containing Ferrites,” Physica Status Solidi, Vol. 23, No. 2, 1974, pp. 575-582. doi:10.1002/pssa.2210230229
- A. M. Abdeen, “Dielectric Behavior in Ni-Zn Ferrite,” Journal of Magnetism and Magnetic Materials, Vol. 192, No. 1, 1999, pp. 121-129.
- G. R. Mohan, D. Ravinder, et al., “Dielectric Properties of Polycrystalline Mixed Nickel-Zinc Ferrites,” Materials Letters, Vol. 40, 1999, pp. 39-45.
- A. E. Suckov, Fizika Metallov i Metallovedenie, Vol. 7, 1959, p. 317.
- A. A. Ghani and N. Z. Mirijasov, Soviet Physics: Solid State, Vol. 13, 1972, p. 2627.
- M. N. Reslescu, C. R. Hebd, Sean Academic Sciences, Vol. 263, 1969, p. 136.
- L. J. Berchmans, R. K. Selvan and C. O. Augustin, “Evaluation of Mg2+-Substituted NiFe2O4 as a Green Anode Material,” Materials Letters, Vol. 58, No. 12-13, 2004, pp. 1928-1933. doi:10.1016/j.matlet.2003.12.008
- Z. Yue, J. Zhou, L. Li, X. Wang and Z. Gui, “Effect of Copper on the Electromagnetic Properties of Mg-Zn-Cu Ferrites Prepared by Sol-Gel Auto-Combustion Method,” Materials Science and Engineering: B, Vol. 86, No. 1, 2001, pp. 64-69. doi:10.1016/S0921-5107(01)00660-2
- M. J. Iqbal and M. R. Siddiquah, “Structural, Electrical and Magnetic Properties of Zr-Mg Cobalt Ferrite,” Journal of Magnetism and Magnetic Materials, Vol. 320, No. 6, 2008, p.845-850.
- L. Vegard, “The Constitution of Mixed Crystals and the Space Occupied by Atoms Physics,” Zeitschrift für Physik, Vol. l5, No. 17, 1921, pp. 17-26.
- Y.-P. Fu and S.-H. Wu, “Electrical and Magnetic Properties of Magnesium-Substituted Lithium Ferrite the Ceramic,” Ceramics International, Vol. 36, 2010, pp. 1311- 1317.
- R. G. Kharake, R. S. Devan and B. K. Chougalu “Structural and Electrical Properties of Cd-Substituted Li-Ni Ferrites,” Journal of Alloys and Compounds, Vol. 463, No. 1-2, 2008, pp. 67-72.
- B. R. Karache, B. V. Khasbardar and A. S. Vanigankar, “X-Ray, SEM and Magnetic Properties of Mg-Cd Ferrites,” Journal of Magnetism and Magnetic Materials, Vol. 168, No. 3, 1997, pp. 292-298. doi:10.1016/S0304-8853(96)00705-6
- R. D. Shanoss and C. T. Prewitt, “Revised Values of Effective Ionic Radii,” Acta Crystallographica, Vol. 1326, No. 7, 1970, pp. 1046-1048.
- P. Kishan, D. R. Sagar and P. Swarup, “Electrical Conduction and Dielectric Behaviour in Zinc-Substituted Lithium Ferrites,” Journal of Less Common Metals, Vol. 108, No. 2, 1985, pp. 345-351.
- M. U. Islam, T. Abbas, S. B. Niazi, Z. Ahmed, S. Sabeen and M. A. Chaudhry, “Electrical Behavior of Fine Particle, Co-Precipitation Prepared Ni-Zn Ferrites,” Solid State Communications, Vol. 130, No. 5, 2004, pp. 353-356.
- G. Joshi A. Khot and S. Sawant. “Revised Values of Effective Ionic Radii,” Solid State Communications, Vol. 65, No. , 1998, pp. 1593-.
- M. E. Shabashy, “DC Electrical Properties of Zn-Ni Ferrites,” Journal of Magnetism and Magnetic Materials, Vol. 172, No. 1-2, 1997, pp. 188-192. doi:10.1016/S0304-8853(97)00014-0
- U. Ghazanfar, S. A. Siddiqui and G. Abbas, “Study of Room Temperature dc Resistivity in Comparison with Activation Energy and Drift Mobility of NiZn Ferrite,” Materials Science and Engineering: B, Vol. 118, No. 1-3, 2005, pp. 132-134. doi:10.1016/j.mseb.2004.12.086
- M. U. Islam, I. Ahmed, T. Abbas, M. A. Chaudhry and R. Nazmeen, Proceedings of 6th International Symposium on Advanced Materials, Islamabad, 19-23 September 1999, pp. 155-158.
- M. El-Shabashy, “DC Electrical Properties of Zn-Ni Ferrites,” Journal of Magnetism and Magnetic Materials, Vol. 172, No. 1-2, 1997, pp. 188-192.
NOTES
*Corresponding author.