Theoretical Economics Letters
Vol.4 No.1(2014), Article ID:42960,5 pages DOI:10.4236/tel.2014.41012
An Empirical Analysis of the Productivity Shock Correlations between US and Rest of the World—Trends, Factors and the Role of Recessions
Department of Economics, Vassar College, Poughkeepsie, USA
Email: erislamaj@vassar.edu
Received November 30, 2013; revised December 30, 2013; accepted January 6, 2014
ABSTRACT
This study uses quarterly data for a group of advanced and emerging market economies to study the role of TFP correlations between the US and the Rest of the World. Following Bosworth and Collins [1], Solow residuals are constructed to proxy for TFP shocks. Then, bilateral correlations with the US are calculated. Recent theoretical studies have emphasized the importance of TFP shock correlations for portfolio choice. The data suggests that the correlations are indeed very volatile and drop sharply during recessions. Arellano-Bond [2] regressions suggest that US Recessions are associated with a drop in cross-country productivity correlations in the medium and long term intervals.
Keywords:Productivity; TFP; Solow Residual; Recessions
1. Introduction
This paper describes and analyzes the co-variation of TFP (Total Factor Productivity) residuals between US and a group of advanced and emerging market economies as measured by the Solow residuals. This research is motivated by influential work in macroeconomics that views productivity shocks as an important source of economic fluctuations (Backus, Kydland and Kehoe [3]). Heathcote and Perri [4] show that, in addition to shocks, co-movement of productivity processes across countries is a determinant of portfolio choice and business cycle co-movement. Other influential studies have emphasized the role of global and country-specific productivity shocks for current account (Glick and Rogoff [5], Iscan [6]). In response, a growing number of studies have employed dynamic factor models to analyze global and regional linkages across countries that affect the co-movement of business cycles (see Hirata and Kose [7] for an extensive review and application of this methodology). This study uses quarterly data to construct TFP correlations between US and a number of industrial economies and emerging markets and can be seen as complementary to that literature1.
The results show that TFP co-movements between US and other countries exhibit quite a lot of variability in the short and medium term suggesting that they are indeed an important consideration for business cycle analysis. During normal times, TFP co-movement with advanced economies is not very different from the one with emerging markets. Productivity correlations drop sharply for both groups of countries during recessions. This may explain the lower co-movement in emerging markets during the 90’s, a period marked by sovereign debt and currency crises. Regression analysis shows that recessions in the US are associated with lower co-movement of TFP residuals for the countries on the sample.
The rest of the paper is organized as follow. Section II describes the data and explains how productivity correlations were constructed. Section II proposes a framework for empirical analysis and Section IV discusses the results. In the end, we summarize the findings of the paper and propose a few avenues for future research.
2. Data
The data used in this study comes mainly from IFS statistics and in the case of employment also implemented with data from ILO2 and covers the period 1983q1- 2010q4. Solow residuals are used as a proxy for TFP shocks. To construct the Solow residuals we follow Bosworth and Collins [1] who estimate the productivity shock from a Cobb-Douglas production as below:
 (1)
(1)
where,
 (2)
(2)
denotes human capital and  stands for years of schooling. The data for education comes from Barro and Lee3 and 7% represents the returns to education used widely in the literature4. Labor is denoted by
  and the data comes from IFS and ILO. Capital stock follows:
 (3)
(3)
where  denotes investment and
  depreciation. Capital stock is constructed using Nehru and Dhareshwar [10], a World Bank study that calculates the capital stock for a group of countries. We extend the series until 2010q4 and use quarterly investment data from IFS to calculate the quarterly capital stock5. Depreciation is assumed constant at 5 percent and the labor and capital shares are assumed 0.65 and 0.35 respectively6. Table 1 reports the mean and standard deviations of TFP residuals in our sample. The data show great similarity on averages between emerging markets and advanced economies. On the other hand, it can be seen that constructed TFP residuals are more volatile for emerging markets. Table 2 compares decade averages of crosscountry productivity correlations with the US for all countries in the sample and also across groups of countries (EM vs AM). The sample changes from decade to decade because of limited data availability in the earlier years so we report the number of countries available in the sample for each decade. The data show that in the 90’s, a period marked by crises in the emerging markets group, the productivity correlations between US and advanced economies was much larger than the one for emerging markets. Both groups seem to be similarly correlated with the US during the last decade.
Table 3 reports non-overlapping 5 year averages of the TFP co-movement between US and the two groups of countries. Standard errors are reported in square brackets and “**” denote statistical difference at 5 percent between the two groups. The data shows that the correlation with the advanced group has been pretty much stable over time, and has experienced a sharp drop in the last period, which corresponds with the Great Recession of 2008. There is also a slight drop right after the recession of 1991 and after the recession of 2001. The TFP comovement with the group of emerging markets has been more volatile with a sharp drop in the second half of the 90’s as well as during the Great Recession. This table also shows that the correlation of productivities of the US and emerging markets and advanced economies has been very similar, except for periods of high turmoil.
Figures 1-5 depict the evolution of 3, 5 and 10 year

Table 1 . TFP statistics.
Note: EM—emerging markets, AM—advanced markets.
Table 2. Productivity shock correlations with US—decade averages.
Note: number of countries in the sample in parenthesis and standard deviations in square brackets.
Table 3. Productivity shock correlations with US—5 year correlations.
Note: numbers in square brackets report standard deviations. **Denotes 5 percent statistical difference among the two groups.
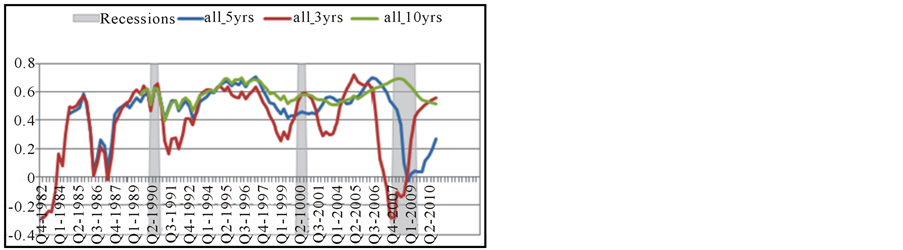
Figure 1. Productivity shock correlations with US—all. a: Rolling windows at 3, 5 and 10 year frequencies for all countries in the sample. The shaded areas denote recessions in the US.
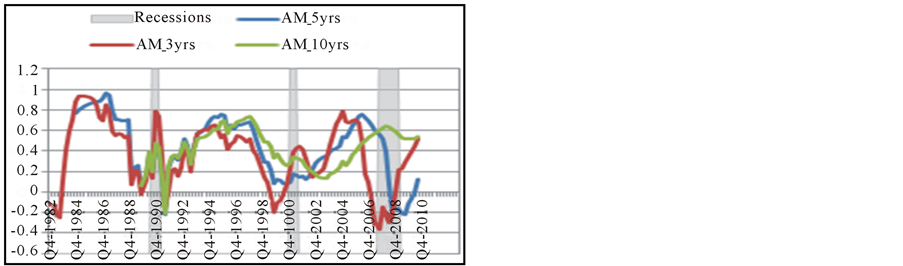
Figure 2. Productivity shock correlations with US—EM. a: Rolling windows at 3, 5 and 10 year frequencies for Emerging Markets (EM). The shaded areas denote recessions in the US.
moving averages across time for TFP co-movements between US and the groups of emerging markets and developing economies.
Shaded areas show US recessions. First, we notice a lot of volatility in these correlations. The volatility is more noticeable for 3 and 5 year moving averages and less so for 10 year ones. Still, even for the 10 year period we can see that the correlation decreased from 0.7 in mid 90’s to almost 0.5 right after the recession of 2001 and
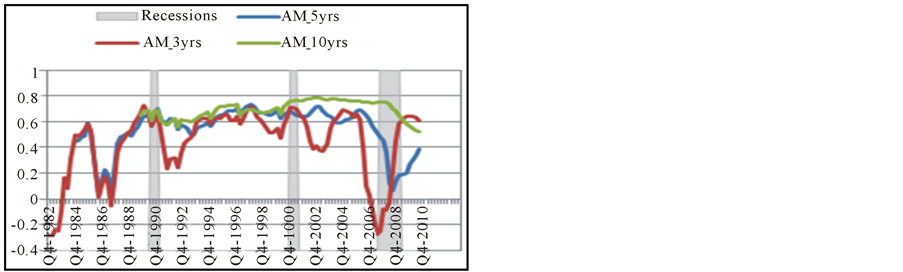
Figure 3. Productivity shock correlations with US—AM. a: Rolling windows at 3, 5 and 10 year frequencies for Advanced Markets (AM). The shaded areas denote recessions in the US.
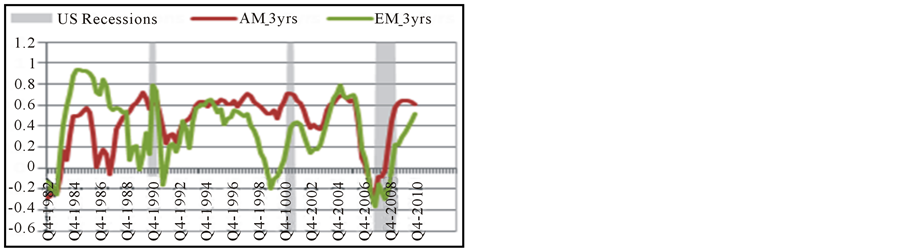
Figure 4. Productivity Shock Correlations with US, 3-year. a. Rolling windows at 3 year frequency for EM and AM. The shaded areas denote recessions in the US.
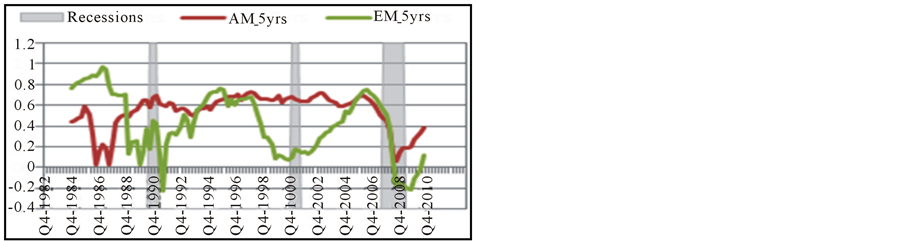
Figure 5. Productivity shock correlations with US, 5-year. a: Rolling windows at 5 year frequency for EM and AM. The shaded areas denote recessions in the US.
then moving up again to above 0.7 during the latest boom, before falling again to 0.5 after the Great Recession (Figure 1). Figures 2 and 3 show the evolution of these correlations at different frequencies for the groups of emerging markets and advanced economies. The sharp drop associated with the latest recession for both groups and the drop in these correlations around other recessions in the US call for further investigation in establishing a link between recessions and cross country productivity correlations. Figures 4 and 5 compare the two groups and confirm the findings above, that except for the period of the 90’s TFP co-movement between the US and the rest of the World has been similar across different groups of emerging and advanced economies. The next session uses regression analysis to try to establish a link between US recessions and productivity shock correlations.
3. Framework and Results
This section uses regression analysis to find what may predict TFP co-movement across countries. To the best of our knowledge, this is a first treatment of the issue using regression analysis. To control for endogeneity and reverse causality we employ lagged values of the dependent variables, output, terms of trade and recessions. More specifically, we estimate the following framework:
 (4)
(4)
where  denotes TFP correlation between US and country
  at time
 .
.  is a dummy variable that takes the value 1 if US is in a recession as defined by NBER and 0 otherwise.
  denotes a set of controls that include GDP growth, terms of trade (TOT) and net bilateral flows with the US7. All independent variables include several lags. Table 4 reports the results for the variables and one lag (two lags for recessions), but the results do not change with the inclusion of more lags. In addition, given that the main concern is to introduce relevant control variables into the regression so that the estimated impact of a recession on TFP co-movement is not biased due to the omission of variables, two lags of TFP correlations have been included. The panel is unbalanced and includes all the countries.
To address endogeneity due to the presence of the lagged dependent variable among regressors and to reverse causality from correlations of productivity to the occurrence of recessions, the equation above has been
Table 4 . Regression analysis.
estimated using the Arellano-Bond estimator, which is in essence a two-step GMM-system estimator. The two-step GMM-system estimates (with Windmeijer standard errors [12]) are computed using lags as instruments. Given the constructions of the dependent variable, valid instruments would be lags that are not likely to be correlated with the error term and other controls. In the case of 3 year moving averages for example, valid instruments are lags of more than 3 years (12 quarters)8. The significance of the results is robust to different choices of instruments and predetermined variables.
Table 4 presents the results of the regression analysis. We run the regression above for 3, 5 and 10 year moving average TFP correlations. The results show that recessions are indeed negatively associated with productivity correlations for the 5 and 10 year moving averages. With the 3 year moving averages the coefficient in front of the recession variable is not significantly different from zero at 90 percent confidence interval, but it still exhibits a negative sign. Higher terms of trade and higher GDP are associated with higher TFP co-movement in the 5 year and 10 year intervals. The results are robust to inclusion of other controls and experimenting with different lags.
4. Conclusions
This study estimates bilateral TFP correlations between US and a group of emerging and advanced economies. Solow residuals are used as proxies for TFP shocks and correlations are constructed for different time periods and as 3, 5 and 10 year moving averages. Evidence suggests that the group of emerging markets and advanced economies are not very different, except in times of turmoil. Indeed, time series evidence suggests that correlations for both groups have fallen sharply when US was experiencing a recession. More formal regression analysis suggests that US recessions are associated with lower productivity correlations with the rest of the world.
The literature so far has considered TFP shocks and TFP correlations as exogenous to business cycle analysis. This study is an attempt not only to quantify these correlations, but also to understand its determinants. So far, the analysis has focused in the US and specifically how US recessions affect the TFP correlations with the rest of the world. In the future, it would be interesting to also include other countries’ specific events that may shed more light on what affects and drives these correlations. Very preliminary evidence suggests that financial turmoil in emerging markets in the 90’s may be associated with lower productivity correlations across countries.
Acknowledgements
I thank Trung Bui for help with the data.
REFERENCES
- B. Bosworth and S. Collins, “The Empirics of Growth: An Update,” Brookings Papers on Economic Activity, Vol. 22, No. 1, 2003, pp. 45-66. http://dx.doi.org/10.1353/eca.2004.0002
- M. Arellano and S. Bond, “Some Tests of Specification for Panel Data: Monte Carlo Evidence and an Application to Employment Equations,” Review of Economic Studies, Vol. 58, No. 2, 1991, pp. 277-297. http://dx.doi.org/10.2307/2297968
- D. Backus, K. Patrick and K. Finn, “International Business Cycles: Theory and Evidence,” In: T. Cooley, Frontiers of Business Cycle Research, Princeton University Press, Princeton, 1995, pp. 331-356.
- J. Heathcote and F. Perri, “Financial Globalization and Real Regionalization,” Journal of Economic Theory, Vol. 119, No. 1, 2004, pp. 207-243.
- R. Glick and K. Rogoff, “Global versus Country-Specific Productivity Shocks and the Current Account,” Journal of Monetary Economics, Vol. 35, No. 1, 1995, pp. 159-192. http://dx.doi.org/10.1016/0304-3932(94)01181-9
- T. B. Iscan, “The Terms of Trade, Productivity Growth, and the Current Account,” Journal of Monetary Economics, Vol. 45, No. 3, 2000, pp. 587-611. http://dx.doi.org/10.1016/S0304-3932(00)00008-8
- H. Hideaki, M. Kose and C. Otrok, “Regionalization vs. Globalization,” IMF Working Papers 13.19, International Monetary Fund, 2013.
- R. Kollmann, “The Correlation of Productivity Growth across Regions and Industries in the United States,” Economic Letters, Vol. 47, No. 3-4, 1995, pp. 437-443. http://dx.doi.org/10.1016/0165-1765(94)00562-G
- M. A Kose, E. S. Prasad and M. E. Terrones, “Does Openness to International Financial Flows Raise Productivity Growth?” Journal of International Money and Finance, Vol. 28, No. 4, 2009, pp. 554-580. http://dx.doi.org/10.1016/j.jimonfin.2009.01.005
- V. Nehru and D. Ashok, “A New Database on Physical Capital Stock: Sources, Methodology and Results,” Revista de Análisis Económico, Vol. 8, No. 1, 1993, pp. 37- 59.
- D. Gollin, “Getting Income Shares Right,” Journal of Political Economy, Vol. 110, No. 2, 2002, pp. 458-474. http://dx.doi.org/10.1086/338747
- F. Windmeijer, “A Finite Sample Correction for the Variance of Linear Efficient Two-Step GMM Estimators,” Journal of Econometrics, Vol. 126, No. 1, 2005, pp. 25- 51. http://dx.doi.org/10.1016/j.jeconom.2004.02.005
NOTES
1Kollman uses a similar methodology to calculate annual sectoral productivity correlations within regions in the US and compare it with cross-country sectoral productivity co-movement.
2Countries included in the study are Argentina, Australia, Austria, Belgium, Brazil, Canada, Chile, China Mainland, Colombia, Costa Rica, Denmark, Ecuador, Finland, France, Germany, Greece, Indonesia, Ireland, Israel, Italy, Japan, Korea, Malaysia, Mexico, Netherlands, New Zealand, Norway, Peru, Philippines, Portugal, Singapore, Spain, South Africa, Sweden, Switzerland, Taiwan, Thailand, Turkey, UK, US, Uruguay, Venezuela. The choice of countries was dictated by data availability and the sample of developing countries is quite limited in the earlier years. For a list of EM and AM see Kose, Prasad and Terrones .
3Barro and Lee data is not available at quarterly frequency, but we interpolate the data since the country’s schooling years is unlikely to change from quarter to quarter.
4See Bosworth and Collins for a discussion of the growth regressions literature.
5IFS reported data for real output and investment need to be adjusted to a common base year before being used together with the available capital stock data. IFS reported CPI index was used to bring the data to a common base year.
6Labor and capital shares are shown to have remained constant in the literature. Gollin argues that, once corrected for self-employment income, capital income shares are in fact remarkably similar across countries and stable over time within countries. Cross-country data on depreciation rates is not available for our sample of countries and we follow Bosworth and Collins in assuming a 5 percent depreciation rate for all countries.

7Other variables like employment, investment, TFP differences. Different types of flows like stocks, bonds and FDI do not change the results. The results are available upon request.
8This paper uses the xtdpd command to preserve flexibility with the Arellano-Bond estimator.