Optics and Photonics Journal
Vol.3 No.2(2013), Article ID:32871,6 pages DOI:10.4236/opj.2013.32034
Assessment of the Elasticity of Erythrocytes in Different Physiological Fluids by Laser Traps
1Department of Physics and Astronomy, Middle Tennessee State University, Murfreesboro, USA
2Department of Biology, Middle Tennessee State University, Murfreesboro, USA
Email: derenso@mtsu.edu
Copyright © 2013 Taylor Barnes et al. This is an open access article distributed under the Creative Commons Attribution License, which permits unrestricted use, distribution, and reproduction in any medium, provided the original work is properly cited.
Received March 7, 2013; revised April 10, 2013; accepted April 18, 2013
Keywords: Laser Trapping; Optical Tweezers; Human Erythrocytes; Mechanical Deformation
ABSTRACT
In the study of the mechanical properties of the erythrocytes (red blood cells-RBCs) the blood sample is commonly diluted in fluids that do not compromise the integrity of the cells. Fetal bovine serum (FBS), newborn bovine serum (NBBS), and phosphate buffer (PBS) solution with a concentration that can provide the right osmotic pressure are fluids commonly used to dilute the blood samples in such studies. Here we have presented the effect of these fluids on the elastic properties of the RBCs that we studied using laser traps. Two laser traps are directly used to trap and deform the cell by exerting a force distributed on the entire cell. The relative changes in size of the cell are studied as a function of the applied force to investigate any effects on the mechanical deformability of RBCs when the cells are suspended in these fluids. The results have shown that the elasticity of the RBCs in the NBBS is not statistically different from the elasticity of the cells in the PBS solution; however the results for the elasticity of the cells in FBS are found to be significantly higher.
1. Introduction
Erythrocytes, commonly to referred as the red blood cells (RBCs), are made of hemoglobin molecules that consist of β-globin and α-globin protein subunits that carry ironcontaining molecules called heme groups. The heme groups bind with oxygen molecules in the lung and deliver the oxygen to different parts of the body as the RBCs squeezes through blood capillaries. In order to perform this biological function properly, the RBCs must undergo reversible elastic deformations during microcirculations. However, some genetic hemoglobin disorders such as sickle cell anemia (SCA) drastically change their shape and elastic deformability in the microcirculation [1]. The elastic deformability of the RBCs has been widely studied using different devices, one of which is a Laser tweezer (LT) [2]. LT is a novel optical device capable of conveniently trapping and manipulating living [3-5] or non-living [6] dielectric particles whose dimensions range from tens of nanometers to tens of microns. Elastic deformability studies of the RBCs by LTs have been used to measure the integrity of RBCs after refrigeration [7] and the efficacy for RBCs extracted from a normal individual and transfused in patient with SCA [8].
LTs have also been used to conduct similar efficacy studies in SCA patients treated by FDA approved oral medication drug, hydroxyurea [9]. In all these studies and others, the RBCs are often diluted and suspended in foreign physiological fluids needed for manipulating the cell by direct [10] or indirect [11-14] trapping. Fetal Bovine Serum (FBS), Newborn Bovine Serum (NBBS), or Phosphate Buffered Saline (PBS) solution are the fluids used for this purpose as these fluids are considered to be physiological and mimic the native environment for the RBCs. Here we present our assessment using LTs in the degree of the physiological nature of these fluids on the elasticity of the RBCs by direct trapping. The study considers two important issues: first, it explores how the elastic properties of RBCs are affected by their physiological environment; and second, it examines the result of direct stretching. To this end, we first discuss the experimental design and procedures for using dual infrared laser traps to directly measure the elastic deformations of RBCs in Section 2. The results of the measurement in PBS solution, FBS, and NBBS are presented and discussed in Section 3. In Section 4, we conclude by summarizing the outcome of our study.
2. Experimental Methods
2.1. Experimental Design and Trap Calibration
In the experimental design shown in Figure 1, we used a linearly polarized infrared laser (LS) (8 watts at 1064 nm) whose power was controlled by a λ/2-wave plate and polarizer (PL) combination. A beam expander (BE) was used to fill the diameter of the objective lens (OL). A polarizing beam splitter (BS1) partitions the light into two perpendicularly polarized beams which we call direct (D) and reflected (R) beams. The D beam was first rotated by a second λ/2-wave plate and was split by a second polarizing beam splitter (BS2) into two perpendicularly polarized beams (D1 and D2) to form the two traps. The positions of the traps were controlled by the two steering mirrors (SM1 and SM2). SM2 was mounted on a piezo-electric translation mount controlled by a computer (PC). A third beam splitter (BS3) was used to recombine the two beams. The output was then coupled into the microscope via a dichroic mirror (DM at 1064 nm). The two lenses (L1 and L2) were used to form the traps in the focal plane of the microscope. The microscope was used to provide highly magnified images through a digital camera (CCD) which has a variable frame grabbing rate and interfaced to a PC. We used escape-force technique to calibrate the trap formed by D2 [15,16] for the purpose of estimating the magnitude of the force. In this technique, the force exerted by the trap at a given power is equal in magnitude to the critical viscous drag force required to fully dislodge a trapped bead translating in the transverse direction with a constant speed. A 4.7 μm silica sphere (Bangs Laboratories, Fisher, IN) trapped by D2 can be translated in the focal plane by the piezo-electric driven mirror SM2. The piezo-electric mount has different operation modes which correspond to different translation speeds. Trap translation speed (the viscous drag speed) was determined by measuring the displacement of the trapped silica sphere from the images taken by the CCD camera at computercontrolled time intervals. Each of the speed settings becomes the critical drag speed (vc) when the power of the trap formed by D2 reduces to a minimum critical value (Pc) below which the viscous force becomes greater than the trapping force and the silica sphere falls out of the trap. The measurement of vc as a function of Pc was taken in PBS and also in FBS. Using the viscosity (η) of FBS (η = 1.89 cp) and PBS solution (η = 1.00 cP), we calculated the maximum trapping force (same as the drag force at the point of escape) on the silica sphere of radius (r = 2.35 μm) as a function of Pc using the relation F = 6πrηvc [15,16]. The result is graphed and a linear equation that relates the maximum force of the trap to the power of the D2 beam measured past OL was found to be F = (2.974 pN/mW)P − 3.934 pN. We use this equation to estimate the force on the cell when D2 is set at a given power.
2.2. Sample Preparation
A human blood sample was obtained from a healthy volunteer. The finger of the volunteer was pricked with a blood glucose measuring device (Fisher Scientific, Pittsburgh, PA), and one small drop of blood (~30 μL) was diluted in 1.5 mL of either the PBS solution, FBS, or NBBS (Atlanta Biologicals, Inc., Atlanta, GA). The PBS solution was prepared by mixing 8.0 g of NaCl, 0.2 g of KCl, 1.15 g of Na2HPO4, 0.2 g of KH2PO4, (all reagents
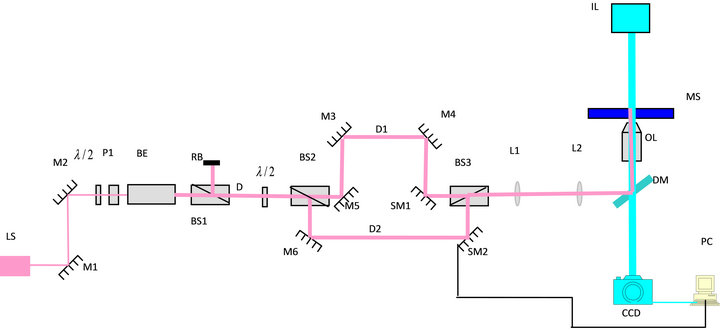
Figure 1. Experimental design.
from Sigma Chemical Co., St. Louis, MO) and 1.0 L of deionized water. The serum allows for an analysis of erythrocyte mechanical deformability in a more natural cellular environment. The biophysical properties of vertebrate RBCs have been compared previously [17] and bovine and human serums have comparable properties of viscosity [18,19] as well as osmotic pressure.
2.3. Force and Deformation Measurement
After preparing the blood sample in the fluids, a drop of the sample was deposited on a well-slide and placed on the microscope stage. A single RBC was trapped by the calibrated trap (D2). The first trap (D1), which was not calibrated, was set to overlap with the second trap by the manually controlled steering mirror SM1. Once the two traps overlap the relative power of the two traps is adjusted until D1 forms a slightly stronger trap than the D2 trap. This occurs when slowly separating the two traps consistently causes the cell to break free from the D2 trap while remaining in the D1 trap. Although neither trap was significantly stronger than the other, this setting ensures that the maximum cell deformation was limited by the power of the calibrated trap (D2). The calibrated trap was first set to a minimum power capable of exerting a force strong enough to trap as well as cause measurable deformation to the cell (~2 mW past OL) when it was translated.
The cell was deformed by slowly translating the calibrated trap on the transverse direction. The cell continued to stretch while it was being held by the D2 trap as long as the force to restore the cell to its normal state was less than the maximum force of the trap. When this force exceeds the maximum force of the D2 trap the RBC escapes and relaxes gradually to its normal state in the D1 trap. We repeated this procedure several times by increasing the power of D1 and D2, accordingly, until we reach to a limit that won’t compromise the integrity of the cell. While the D2 trap was translating very slowly and the RBC was being continually stretched and deformed, the CCD images were collected. By identifying the final image of the cell before escaping the D2 trap, we measured the diameters of the cell in the directions parallel (longitudinal) and normal to the translation direction (transverse). We then determined the relative displacements in the longitudinal and transverse directions by comparing this image with the image which was taken before the second trap begins to stretch the cell. The measurement of length was initially made by determining a known object length, such as the diameter of the silica spheres, in pixels on a CCD image. The length in microns was then calculated by using a conversion factor that was derived from the ratio of the diameter of the silica spheres in pixels to their diameter in microns.
The force is estimated by valuating F = (2.974 pN/mW)P − 3.934 pN using the measured power past the objective lens. This measurement was repeated for many different cells at several power settings in the FBS, NBBS, and PBS. Measurements of five cells per each power setting were made in each cellular environment.
3. Results and Discussion
The deformation measurements were carried out along longitudinal and transverse direction. The image of a RBC cell taken by the CCD camera when the cell is subject to four different conditions is shown in Figure 2. Figure 2(a) is the image of the cell on the focal plane when the cell is free. The second image in Figure 2(b) is when the cell is being held by a single trap. Comparison of the two figures show that the RBC flipped such that its platelet surface became parallel to the beam axis [20,21]. When the RBC platelet lies in the transversal direction of the trap, the integrated electric field within the volume of the RBC is maximized, and hence, the net electrical potential energy is minimized. Figures 2(c) and (d) are images of the RBC when it is stretched by forces of two different magnitudes. Figure 2(c) is the image taken when the power of the D1 trap is set to 9.9 mW past OL (~25.5 pN) and Figure 3(d) is when the power is set to 8.1 mW past OL (~20.1 pN).
From the images in Figures 2(c) and (d), we observe a shape transformation of the cell caused by the stretching force which is different from previous studies based on indirect manipulation of the cell using force probing silica beads attached at two opposite edges of the cell [10, 14]. In these studies the donut-shaped RBC is transformed into a shape that resembles an oval shape. There are two reasons for the differences. The first is, due to the flipping of the cell inside the trap what we see in the images shown in Figures 2(b) and (d) are not the platelet surface; instead we see the side view. The second is that the two optical traps exert transverse gradient forces which are distributed in the entire cell unlike in the case of indirect stretching by force probes in which the cell experiences concentrated forces along the line joining the
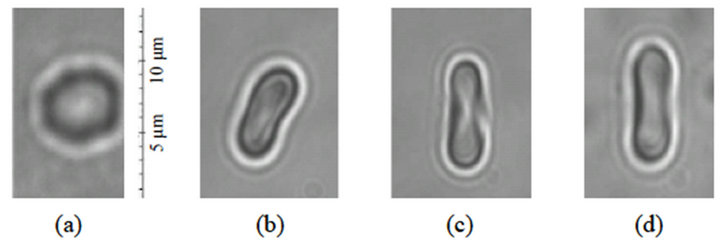
Figure 2. Image of a RBC when it is (a) not trapped (b) trapped but not stretched (c) stretched by the two traps in PBS and just before it escapes DB2 for a power of 9.9 mW (25.5 pN) (d) stretched by the two traps in a newborn bovine serum and just before it escapes DB2 for a power of 8.1 mW (20.1 pN).
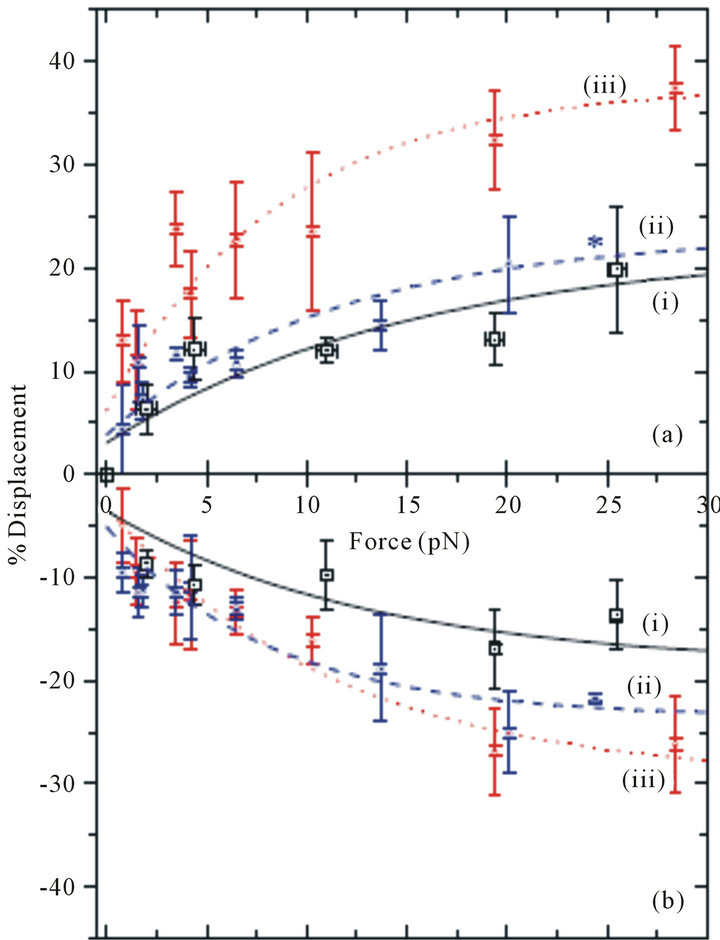
Figure 3. The percentage change in the diameter of a RBC in PBS (solid line (i)), newborn bovine serum (dashed line (ii)), and fetal bovine serum (dotted line (iii)) as a function of the stretching force. (a) Longitudinal diameter; (b) Transverse diameter. Each data point represents the average for several separate measurements and the error bars represent the standard deviation of the measurements.
force probes at the two edges of the cell. The measurements of the transverse and longitudinal displacements are made for the same power (stretching force). At 25 pN nearly 17.5% increase in the diameter of the cell in the longitudinal direction is observed in PBS solution. Previous studies based on indirect measurement of the longitudinal deformations of RBCs through attached beads at this magnitude of force have been found to be ~18% [10] and ~20% [14]. In the transverse direction, these studies reported ~18% reduction in the transverse diameter whereas our result is a ~15% reduction. In bovine serums, the measurement for the percentage displacement of the longitudinal and transverse diameters is shown by the dashed line (ii) in NBBS and by the dotted line (iii) in FBS in Figure 3. In the NBBS both the longitudinal percent deformations are similar in magnitude to the deformations in the PBS. While the deformations are slightly greater in the NBBS, nearly all of the data points for the NBBS are within one standard deviation of the curve for the PBS solution, and vice a versa. For the FBS, we observe qualitatively similar behavior, but the magnitude of the deformations is larger. For example, at a ~25 pN stretching force, the deformation in the longitudinal diameter is (~35%) and the deformation in the transverse diameter is (~26%).
The higher deformation of the RBCs in the FBS mostly likely results from the more physiological nature of FBS. In comparison to NBBS or PBS solution, the absence of foreign antibodies and the existence of the right osmotic pressure replicate the biochemical environment that mimics the native environment for the RBCs. This enables the RBCs to undergo higher elastic deformations needed to properly carry out its biological functions. However, it is also important to look closely at the effect of refractive indices difference between the RBC and these fluids in the magnitude of the trapping force. We use a rough spherical model for the RBCs to qualitatively investigate the effects. In this model the maximum trapping force on an RBC, can be determined from Fi = Qi(niP/c), where Qi is the scaling constant that depends on the size of the cell and the refractive index difference between the cell and the medium, ni is the refractive index of the surrounding medium, P is the power of the laser incident on the cell, and c is the speed of light in a vacuum [22]. For a trap formed by the 100X objective lens with numerical aperture, 1.5, the RBCs (we studied here) with measured average diameter of d = 6.23 +/− 0.56 μm [8] and refractive index n0 = 1.4 [23] suspended in FBS (n1 = 1.3566) [24] and in PBS solution (n1 = 1.3300), the scaling factors can be shown to be approximately the same Q1  Q2, respectively [22]. This is mainly because of the negligible difference in the effective refractive indices, neff = n0/ni, of the cell in the two media, neff = 1.03 in FBS and neff = 1.02 in PBS solution. Moreover, even though we studied different cells (five different cells for each power) in the two media, we have kept the sizes of the cells nearly the same. Therefore, for the same power the ratio of the maximum trap force on an RBC suspended in FBS (F1) to that of in PBS solution (F2) becomes F1/F2 = 1.02. This result shows that effect on the deformation of the cells due to differences in the natural refractive indices is negligibly small.
In addition to the interestingly large deformability of cells in FBS, we also observe nonlinear deformation behavior for the RBCs. Previous measurements, based on two beads attached to the periphery of the cell [10,14] show linear behavior of the deformation as a function of the stretching force. Analysis of our experimental data does not show linear behavior (Figure 3) when the cell is subjected to a distributed force produced by the laser trap directly.
4. Conclusion
By directly using 1064 nm infrared laser dual traps, without attachment of force probes, we have studied environmental effects on the elastic deformability of human RBCs. We have measured the longitudinal and transverse deformations of the cells in a PBS solution, FBS, and NBBS. The results when the cells are suspended in PBS and NBBS showed statistically the same result. However, in FBS the cells tend to be more elastic than when they are in a PBS solution or NBBS. These differences may be attributed to differences in protein, lipid, and growth factor levels in FBS.
5. Acknowledgements
Daniel Erenso and Anthony Farone acknowledge support from FRCAC, and Taylor Barnes and Adam Shulman acknowledge support from URECA at Middle Tennessee State University.
REFERENCES
- C. Madigan and P. Malik, “Pathophysiology and Therapy for Haemoglobinopathies; Part I: Sickle Cell Disease,” Expert Reviews in Molecular Medicine, Vol. 8, No. 9, 2006, pp. 1-23. doi:10.1017/S1462399406010659
- A. Ashkin, “Applications of Laser Radiation Pressure,” Science, Vol. 210, No. 4474, 1980, pp. 1081-1088. doi:10.1126/science.210.4474.1081
- A. Ashkin, J. M. Dziedzic and T. Yamane, “Optical Trapping and Manipulation of Single Cells Using Infrared Laser beams,” Nature, Vol. 330, No. 6150, 1987, pp. 769- 771. doi:10.1038/330769a0
- F. Bordeleau, J. Bessard, N. Marceau and Y. Sheng, “Measuring Integrated Cellular Mechanical Stress Response at Focal Adhesions by Optical Tweezers,” Journal of Biomedical Optics, Vol. 16, No. 9, 2011, Article ID: 095005. doi:10.1117/1.3626864
- S. Rancourt-Grenier, M. Wei, J. Bai, A. Chiou, P. Bareil, P. Duval and Y. Sheng, “Dynamic Deformation of Red Blood Cell in Dual-trap Optical Tweezers,” Optics Express, Vol. 18, No. 10, 2010, pp. 10462-10472. doi:10.1364/OE.18.010462
- D. Erenso, A. Shulman, J. Curtis and S. Elrod, “Formation of Synthetic Structures with Micron Size Silica Beads Using Optical Tweezer,” Journal of Modern Optics, Vol. 54, No. 10, 2007, pp. 1529-1536. doi:10.1080/09500340601183664
- M. M. Brandão, S. T. O. Saad, C. L. Cezar, A. Fontes, F. F. Costa and M. L. Barjas-Castro, “Elastic Properties of Stored Red Blood Cells from Sickle Trait Donor Units,” Vox Sanguinis, Vol. 85, No. 3, 2003, pp. 213-215. doi:10.1046/j.1423-0410.2003.00344.x
- A. Pellizzaro, G. Welker, D. Scott, R. Solomon, J. Cooper, A. Farone, M. Farone, R. S. Mushi, M. del Pilar Aguinaga and D. Erenso, “Direct Laser Trapping for Measuring the Behavior of Transfused Erythrocytes in a Sickle Cell Anemia Patient,” Biomedical Optics Express, Vol. 3, No. 9, 2012, pp. 2190-2199. doi:10.1364/BOE.3.002190
- M. M. Brandao, A. Fontes, M. L. Barjas-Castro, L. C. Barbosa, F. F. Costa, C. L. Cesar and S. T. Saad. “Optical Tweezers for Measuring Red Blood Cell Elasticity: Application to the Study of Drug Response in Sickle Cell Disease,” European Journal of Haematology, Vol. 70, No. 4, 2003, pp. 207-211. doi:10.1034/j.1600-0609.2003.00027.x
- S. Henon, G. Lenormand, A. Richert and F. Gallet, “A New Determination of the Shear Modulus of the Human Erythrocyte Membrane Using Optical Tweezers,” Biophysical Journal, Vol. 76, No. 2, 1999, pp. 1145-1151. doi:10.1016/S0006-3495(99)77279-6
- J. Sleep, D. Wilson, R. Simmons and W. Gratzer, “Elasticity of the Red Cell Membrane and Its Relation to Hemolytic Disorders,” Biophysical Journal, Vol. 88, No. 6, 1999, pp. 3085-3095. doi:10.1016/S0006-3495(99)77139-0
- G. Lenormand, S. Henon, A. Richert, J. Simeon and F. Gallet, “Direct Measurement of the Area Expansion and Shear Moduli of the Human Red Blood Cell Membrane Skeleton,” Biophysical Journal, Vol. 81, No. 1, 2001, pp. 43-56. doi:10.1016/S0006-3495(01)75678-0
- J. A. Dharmadhikari, S. Roy, A. Dharmadhikari, K. S. Sharma and M. Mathur, “Torque-Generating Malaria-Infected Red Blood Cells in an Optical Trap,” Optics Express, Vol. 12, No. 6, 2004, pp. 1179-1184. doi:10.1364/OPEX.12.001179
- C. T. Lim, M. Dao, S. Suresh, C. H. Sow and K. T. Chew. “Large Deformation of Living Cells Using Laser Traps,” Acta Materialia, Vol. 52, No. 7, 2004, pp. 1837-1845. doi:10.1016/j.actamat.2004.05.016
- K. Svoboda and S. M. Block. “Biological Applications of Optical Forces,” Annual Review of Biophysics and Biomolecular Structure, Vol. 23, 1994, pp. 247-285. doi:10.1146/annurev.bb.23.060194.001335
- S. Ermilov and B. Anvari, “Dynamic Measurements of Transverse Optical Trapping Force in Biological Applications,” Annals of Biomedical Engineering, Vol. 32, 2004, pp. 1016-1026.
- J. B. Collip, “Osmotic Pressure of Serum and Erythrocytes in Various Vertebrate Types as Determined by the Cryoscopic Method,” Journal of Biological Chemistry, Vol. 42, 1920, pp. 221-226.
- J. Q. Yao, M. P. Laurent, T. S. Johnson, C. R. Blanchard and R. D. Crowninshield, “The Influences of Lubricant and Material on the Polymer/CoCr Sliding Friction,” Wear, Vol. 255, No. 1-6, 2003, pp. 780-784. doi:10.1016/S0043-1648(03)00180-7
- T. J. Hemingway, E. A. Savitsky and D. F. Kupas, “Hyperviscosity Syndrome,” eMedicine, 2012. http://emedicine.medscape.com/article/780258-overview
- W. G. Lee, H. Bang, J. Park, S. Chung, K. Cho, C. Chung, D.-C. Han and J. K. Chang, “Combined MicrochannelType Erythrocyte Deformability Test with Optical Tweezers,” Proceedings of the SPIE, Imaging, Manipulation, and Analysis of Biomolecules, Cells, and Tissues IV, Vol. 6088, 2006, Article ID: 608813. doi:10.1117/12.647537
- G. Liao, P. B. Bareil, Y. Sheng and A. Chiou, “One-Dimensional Jumping Optical Tweezers for Optical Stretching of Bi-Concave Human Red Blood Cells,” Optics Express, Vol. 16, No. 3, 2008, pp. 1996-2004. doi:10.1364/OE.16.001996
- A. Ashkin, “Forces of a Single-Beam Gradient Laser Trap on a Dielectric Sphere in the Ray Optics Regime,” Biophysical Journal, Vol. 61, No. 2, 1992, pp. 569-582. doi:10.1016/S0006-3495(92)81860-X
- F. P. Bolin, L. E. Preuss, R. C. Taylor and R. J. Ference, “Refractive Index of Some Mammalian Tissues Using a Fiber Optical Cladding Method,” Applied Optics, Vol. 28, No. 12, 1989, pp. 2297-2303. doi:10.1364/AO.28.002297
- J. J. Gu, Y. F. Yu, E. P. Li, S. H. Ng, P. H. Yap, X. Q. Zhou, T. H. Cheng and A. Q. Liu, “Real-Time Measurement of Cellular Refractive Index and Thickness Using Cell Culture Chip,” The Proceedings of TAS 12th International Conference on Miniaturized Systems for Chemistry and Life Sciences, San Diego, 12-16 October 2008, pp. 1873-1875.