Paper Menu >>
Journal Menu >>
 Journal of Geographic Information System, 2010, 2, 23-31 doi:10.4236/jgis.2010.21006 Published Online January 2010 (http://www.scirp.org/journal/jgis) Copyright © 2010 SciRes JGIS Geospatial Analysis of Geotechnical Data Applied to Urban Infrastructure Planning Rodolfo Moreda MENDES1, Reinaldo LORANDI2 1Geological Institute, Secretariat of Environment, Avenida Miguel Stefano n 3900, São Paulo, Brazil 2Civil Engineering Department, Federal University of São Carlos, Rodovia Washington Luis, Km 235, Sã o Carlos, Brazil Email: rodolfo.mendes@igeologico.sp.gov.br, lorandi@ufscar.br Abstract: The urbanization process inside the State of São Paulo (Brazil) facilitated, in approximately five decades, the migration of thousands of peasants to the urban areas of great industrial centers inducing and requesting, at the same time and very often, an amplification of the systems of local urban infrastructure not appropriate for the natural potential of the physical territory. In this content, the city of São José do Rio Preto (State of São Paulo) with little more than 350.000 inhabitants, currently faces serious problems related to the urban planning originating from the unusual occupation and without previous study of suitability. Therefore, the present paper intends to guide and indicate the areas whose potential of urban development leads to an occupation suitable for the construction of shallow foundations in residential buildings of single floor, using an interpretative chart produced by the software GIS-SPRING-4.0 developed by Instituto Nacional de Pes- quisas Espaciais/INPE (Brazil), and based in the methodology of geotechnical mapping developed by the de- partment of geotechnical engineering of EESC/USP (Brazil). The chart for shallow foundation shows that a large portion of the studied area presents serious relationship problems with layers of highly collapsible soils. Keywords: GIS, geotechnical mapping, urban planning, urban infrastructure, shallow foundations 1. Introduction Industrialisation in underdeveloped countries is an im- portant part of participation in the urbanization process. We can consider industry as one of the great causal fac- tors of urbanization, and, for this reason, industrialized areas are also the most urbanized. As several examina- tions have shown, the interior of the State of São Paulo (Brazil) has presented the most significant rates of popu- lation growth in the entire state in the last decade (Negri and Pacheco, 1993; Caiado and Vasconcelos, 1994; Campolina Dinis and Santos, 1995). The migration process to the interior of the State of São Paulo is related to the intervals of proximity to the metropolitan area of the city of São Paulo, according to Birkholz et al. (1983). In the interval of proximities, the important urban centers of Ribeirão Preto, Presidente Prudente, Bauru and São José do Rio Preto are included. The city of São José do Rio Preto (State of São Paulo) is located at an important railway and roadway east-west axis of the State of São Paulo, which offers conditions for its growth, and is set fundamentally in the tertiary sector. However, the constitution of new industrial and agriculture-industrial spaces in the interior of São Paulo was not capable of avoiding the collapse of the basic urban public infrastructure in the development process. This view shows the current situation of the city of São José do Rio Preto, composed mainly of an irregular pat- tern of single floor residential constructions, which have foundations and urban infrastructure in places that lack previous suitability studies. These often do not satisfy the natural relationship potentials of the urban physical ter- ritory/ocupation. Therefore, in this paper a space analysis of the main attributes of the physical territory of the urban center area of São José do Rio Preto was prepared, with the intention of obtaining, using the database produced by Mendes (2001), interpretative charts for shallow founda- tions and underground constructions that can evaluate and indicate areas where potentials of urban physical territory are adapted in an efficient way. The objective was to minimise or repair the current problems of ir- regular urban occupation. These interpretative charts can guide local investigations, allowing us, in certain cir- cumstances, to decrease costs, time and the number of situations to be studied and investigated. 2. Area of Study The studied area (Figure 1) is located in the Western 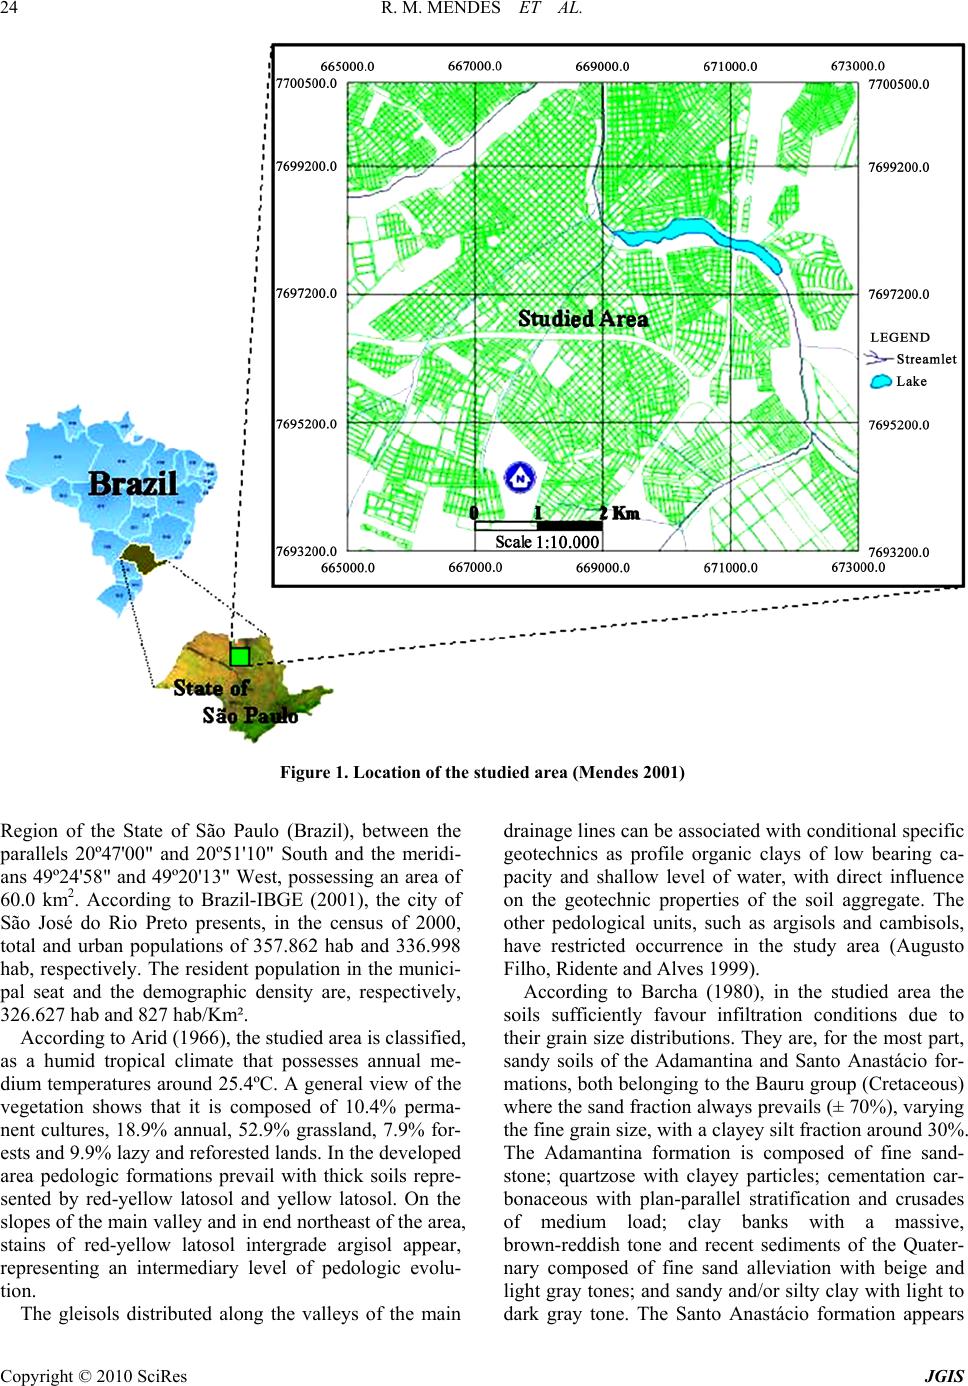 R. M. MENDES ET AL. Copyright © 2010 SciRes JGIS 24 Figure 1. Location of the studied area (Mendes 2001) Region of the State of São Paulo (Brazil), between the parallels 20º47'00" and 20º51'10" South and the meridi- ans 49º24'58" and 49º20'13" West, possessing an area of 60.0 km2. According to Brazil-IBGE (2001), the city of São José do Rio Preto presents, in the census of 2000, total and urban populations of 357.862 hab and 336.998 hab, respectively. The resident population in the munici- pal seat and the demographic density are, respectively, 326.627 hab and 827 hab/Km². According to Arid (1966), the studied area is classified, as a humid tropical climate that possesses annual me- dium temperatures around 25.4ºC. A general view of the vegetation shows that it is composed of 10.4% perma- nent cultures, 18.9% annual, 52.9% grassland, 7.9% for- ests and 9.9% lazy and reforested lands. In the developed area pedologic formations prevail with thick soils repre- sented by red-yellow latosol and yellow latosol. On the slopes of the main valley and in end northeast of the area, stains of red-yellow latosol intergrade argisol appear, representing an intermediary level of pedologic evolu- tion. The gleisols distributed along the valleys of the main drainage lines can be associated with conditional specific geotechnics as profile organic clays of low bearing ca- pacity and shallow level of water, with direct influence on the geotechnic properties of the soil aggregate. The other pedological units, such as argisols and cambisols, have restricted occurrence in the study area (Augusto Filho, Ridente and Alves 1999). According to Barcha (1980), in the studied area the soils sufficiently favour infiltration conditions due to their grain size distributions. They are, for the most part, sandy soils of the Adamantina and Santo Anastácio for- mations, both belonging to the Bauru group (Cretaceous) where the sand fraction always prevails (± 70%), varying the fine grain size, with a clayey silt fraction around 30%. The Adamantina formation is composed of fine sand- stone; quartzose with clayey particles; cementation car- bonaceous with plan-parallel stratification and crusades of medium load; clay banks with a massive, brown-reddish tone and recent sediments of the Quater- nary composed of fine sand alleviation with beige and light gray tones; and sandy and/or silty clay with light to dark gray tone. The Santo Anastácio formation appears  R. M. MENDES ET AL. Copyright © 2010 SciRes JGIS 25 in areas that accompany the quotas with more drops in the river and streamlet valleys, represented by brown- reddish and violet tones of sandstone with fine to me- dium grain size, generally regulated to bad grain size distribution and rounded particle size covered by limo- nitic film. On the surface of the studied area only the Adamantina formation appears at the depth of the Santo Anastácio formation. The Adamantina formation is more expressive, with a thickness varying from 58 meters up to 140 meters. The rocky blooming is relatively rare, occurring mainly in the drainage lines. According to the geomorphological division of the State of São Paulo (São Paulo - FFLCH/USP-IPT- FAPESP, 1997), the studied area is located in the mor- phostructural unit of the Parana sedimentary basin that embraces a morphosculptural unit, denominated “west- ern tableland from São Paulo”, and presents the fol- lowing characteristics: the unit occupies almost 50% of the total area of the State of São Paulo, and the relief of this morphosculpture is, in general, slightly waved with a prevalence of wide and low hills with leveled tops. Other characteristics are medium dimensions between drainage lines of 1.750 to 3.750 meters and a medium slope be- tween 2 and 10%. The topography of the studied area is smooth, and the relief is waved and relatively uniform, with wide and low hills (Barcha, 1980). The level dif- ferences presented by the greater amounts of discharge and the lower altitude, which varies from 350 to 550 meters, are small. 3. Methodology and Materials A geospatial analysis of the main geotechnical attributes of the urban physical territory of the city of São José do Rio Preto was performed based on the methodology of geotechnical mapping developed by the geotechnical engineering department of EESC/USP (Brazil) and using a Geographical Information System (GIS-SPRING) de- veloped by Instituto Nacional de Pesquisas Espaciais/ INPE (Brazil). For the interpretative chart, pre-existing information was used, represented by the SPT – Standard Penetrating Test (1500 boreholes, approximately, in 241 building sites), in addition to collections in the field of disturbed and undisturbed samples for laboratory analysis, which allowed us to determine the geotechnical properties of the unconsolidate materials, such as grain-size distribu- tion, Atterberg limits, permeability, expansibility, com- pressibility and collapsibility. This study also relied on the production of several intermediary cartographic doc- uments. Firstly, the boreholes that represented the profile of the land based on the largest investigated depth or largest va- riability of the layers of the soil aggregate were selected, facilitating the assembly of a geographical database con- taining all of the information from the borehole profiles. Later on, a study of the existence or non-existence of correlation was performed with the data originating from pre-existent boreholes, such as texture, the bearing ca- pacity of the layers for NSPT and groundwater levels, with the geotechnical properties determined in laboratory. We later made a comparative analysis of the boreholes that presented properties similar to the soil aggregate, attrib- uting the values of those properties to regions whose geotechnical behavior could be considered homogeneous. Starting from the information contained in the database, it was possible to esteem the values for each attribute in places without sampling by using the geostatistical methodology of the ordinary kriging for the module of the spatial analysis implanted in the GIS-SPRING-4.0, based on the subroutine “kt3d” of GSLIB (Deutsch and Journel, 1992). Therefore, the geotechnical properties of the uncon- solidated material and the values of the attributes ob- tained by the geostatistical methodology of the kriging were used, and the intermediary charts (bearing capacity, groundwater level, texture, drenability, organic layer, depth of the impenetrable to SPT and collapsibility) were elaborated. Starting from the information of those inter- mediary charts, the interpretative chart of shallow foun- dations, with its respective suitability classes according to adopted methodology, were obtained. The methodology used in the elaboration of the inter- pretative chart was based on the attributes of the urban physical territory and limits proposed (Zuquette, 1987, 1993). Those limits were defined starting from the ex- perience of works developed in several areas of Brazil and using the information obtained through the referred author’s bibliographical, where the homogeneity of the terrain (in terms of areas) was described in suitability classes (Favourable, Moderate, Severe and Restrictive) that reflect the degree of difficulty in the introduction of buildings in the terrain. Considering the objectives, the attributes, its occurrence levels and purposes were de- fined according to Zuquette (1993), and four suitability classes were used in that mapping: a) Favourable: the totality of the attributes presents appropriate levels, where two attributes of secondary importance present levels that would place them in the moderate class. The favourable class means that the nec- essary technological resources for the occupation or con- struction will be the simplest and most inexpensive; the potential of negative impacts and of risks will be the lowest within the studied region; b) Moderate: 80% or more of the fundamental attrib- utes present compatible levels with the moderate and favourable classes. In areas classified as moderate, there are possibilities of the occurrence of negative impacts and risks. During the occupation or construction there can be a need for more onerous operational and techno- logical resources with a certain degree of complexity; c) Severe: 15% of the attributes present compatible 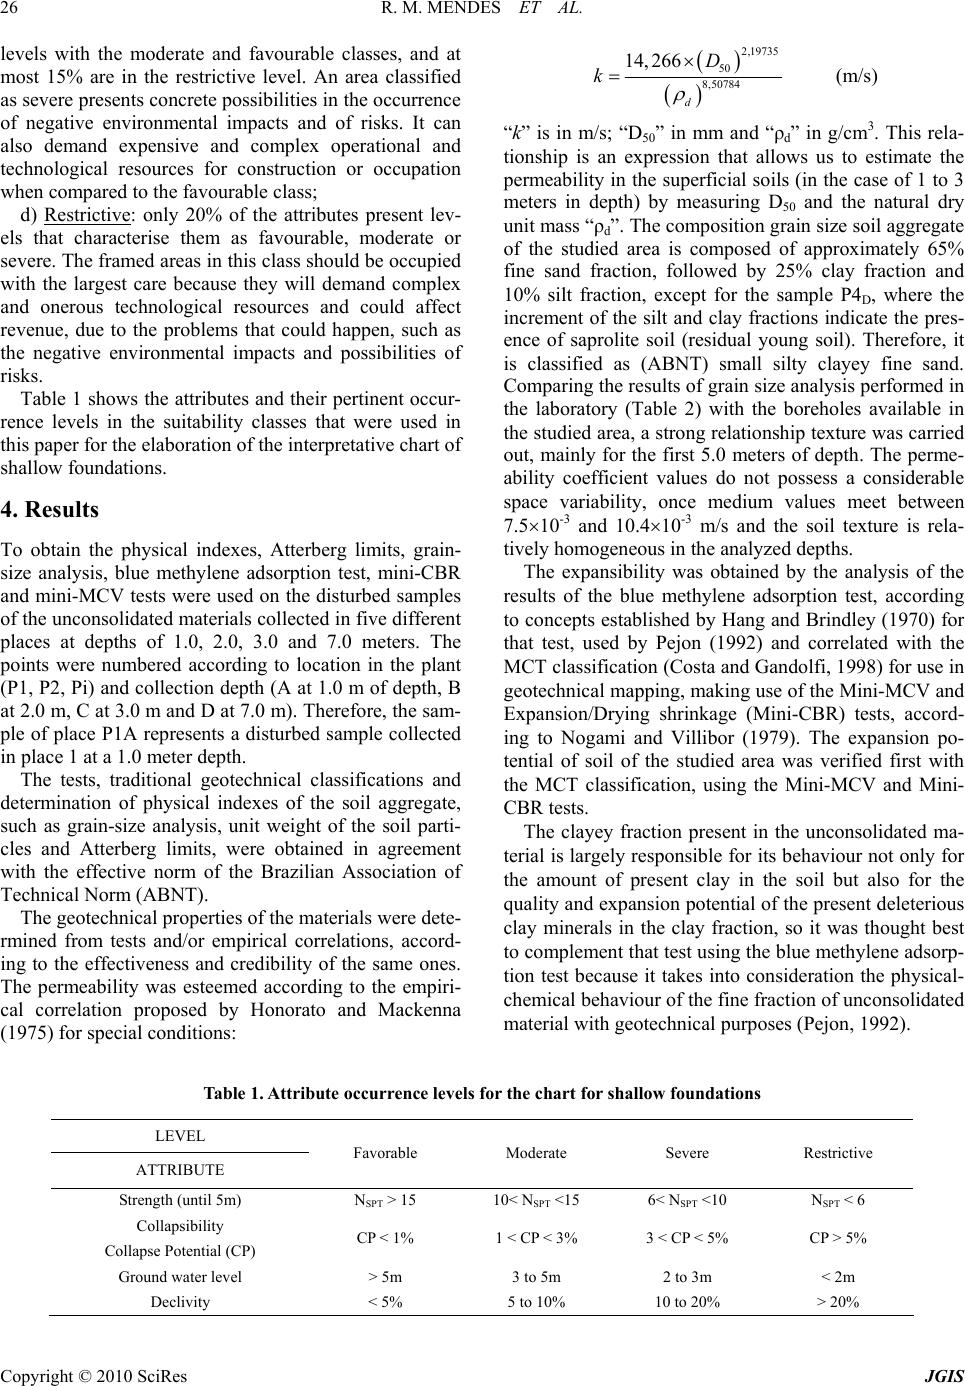 R. M. MENDES ET AL. Copyright © 2010 SciRes JGIS 26 levels with the moderate and favourable classes, and at most 15% are in the restrictive level. An area classified as severe presents concrete possibilities in the occurrence of negative environmental impacts and of risks. It can also demand expensive and complex operational and technological resources for construction or occupation when compared to the favourable class; d) Restrictive: only 20% of the attributes present lev- els that characterise them as favourable, moderate or severe. The framed areas in this class should be occupied with the largest care because they will demand complex and onerous technological resources and could affect revenue, due to the problems that could happen, such as the negative environmental impacts and possibilities of risks. Table 1 shows the attributes and their pertinent occur- rence levels in the suitability classes that were used in this paper for the elaboration of the interpretative chart of shallow foundations. 4. Results To obtain the physical indexes, Atterberg limits, grain- size analysis, blue methylene adsorption test, mini-CBR and mini-MCV tests were used on the disturbed samples of the unconsolidated materials collected in five different places at depths of 1.0, 2.0, 3.0 and 7.0 meters. The points were numbered according to location in the plant (P1, P2, Pi) and collection depth (A at 1.0 m of depth, B at 2.0 m, C at 3.0 m and D at 7.0 m). Therefore, the sam- ple of place P1A represents a disturbed sample collected in place 1 at a 1.0 meter depth. The tests, traditional geotechnical classifications and determination of physical indexes of the soil aggregate, such as grain-size analysis, unit weight of the soil parti- cles and Atterberg limits, were obtained in agreement with the effective norm of the Brazilian Association of Technical Norm (ABNT). The geotechnical properties of the materials were dete- rmined from tests and/or empirical correlations, accord- ing to the effectiveness and credibility of the same ones. The permeability was esteemed according to the empiri- cal correlation proposed by Honorato and Mackenna (1975) for special conditions: 2,19735 50 8,50784 14, 266 d D k (m/s) “k” is in m/s; “D50” in mm and “ρd” in g/cm3. This rela- tionship is an expression that allows us to estimate the permeability in the superficial soils (in the case of 1 to 3 meters in depth) by measuring D50 and the natural dry unit mass “ρd”. The composition grain size soil aggregate of the studied area is composed of approximately 65% fine sand fraction, followed by 25% clay fraction and 10% silt fraction, except for the sample P4D, where the increment of the silt and clay fractions indicate the pres- ence of saprolite soil (residual young soil). Therefore, it is classified as (ABNT) small silty clayey fine sand. Comparing the results of grain size analysis performed in the laboratory (Table 2) with the boreholes available in the studied area, a strong relationship texture was carried out, mainly for the first 5.0 meters of depth. The perme- ability coefficient values do not possess a considerable space variability, once medium values meet between 7.510-3 and 10.410-3 m/s and the soil texture is rela- tively homogeneous in the analyzed depths. The expansibility was obtained by the analysis of the results of the blue methylene adsorption test, according to concepts established by Hang and Brindley (1970) for that test, used by Pejon (1992) and correlated with the MCT classification (Costa and Gandolfi, 1998) for use in geotechnical mapping, making use of the Mini-MCV and Expansion/Drying shrinkage (Mini-CBR) tests, accord- ing to Nogami and Villibor (1979). The expansion po- tential of soil of the studied area was verified first with the MCT classification, using the Mini-MCV and Mini- CBR tests. The clayey fraction present in the unconsolidated ma- terial is largely responsible for its behaviour not only for the amount of present clay in the soil but also for the quality and expansion potential of the present deleterious clay minerals in the clay fraction, so it was thought best to complement that test using the blue methylene adsorp- tion test because it takes into consideration the physical- chemical behaviour of the fine fraction of unconsolidated material with geotechnical purposes (Pejon, 1992). Table 1. Attribute occurrence levels for the chart for shallow foundations LEVEL ATTRIBUTE Favorable Moderate Severe Restrictive Strength (until 5m) NSPT > 15 10< NSPT <15 6< NSPT <10 NSPT < 6 Collapsibility Collapse Potential (CP) CP < 1% 1 < CP < 3% 3 < CP < 5% CP > 5% Ground water level > 5m 3 to 5m 2 to 3m < 2m Declivity < 5% 5 to 10% 10 to 20% > 20% 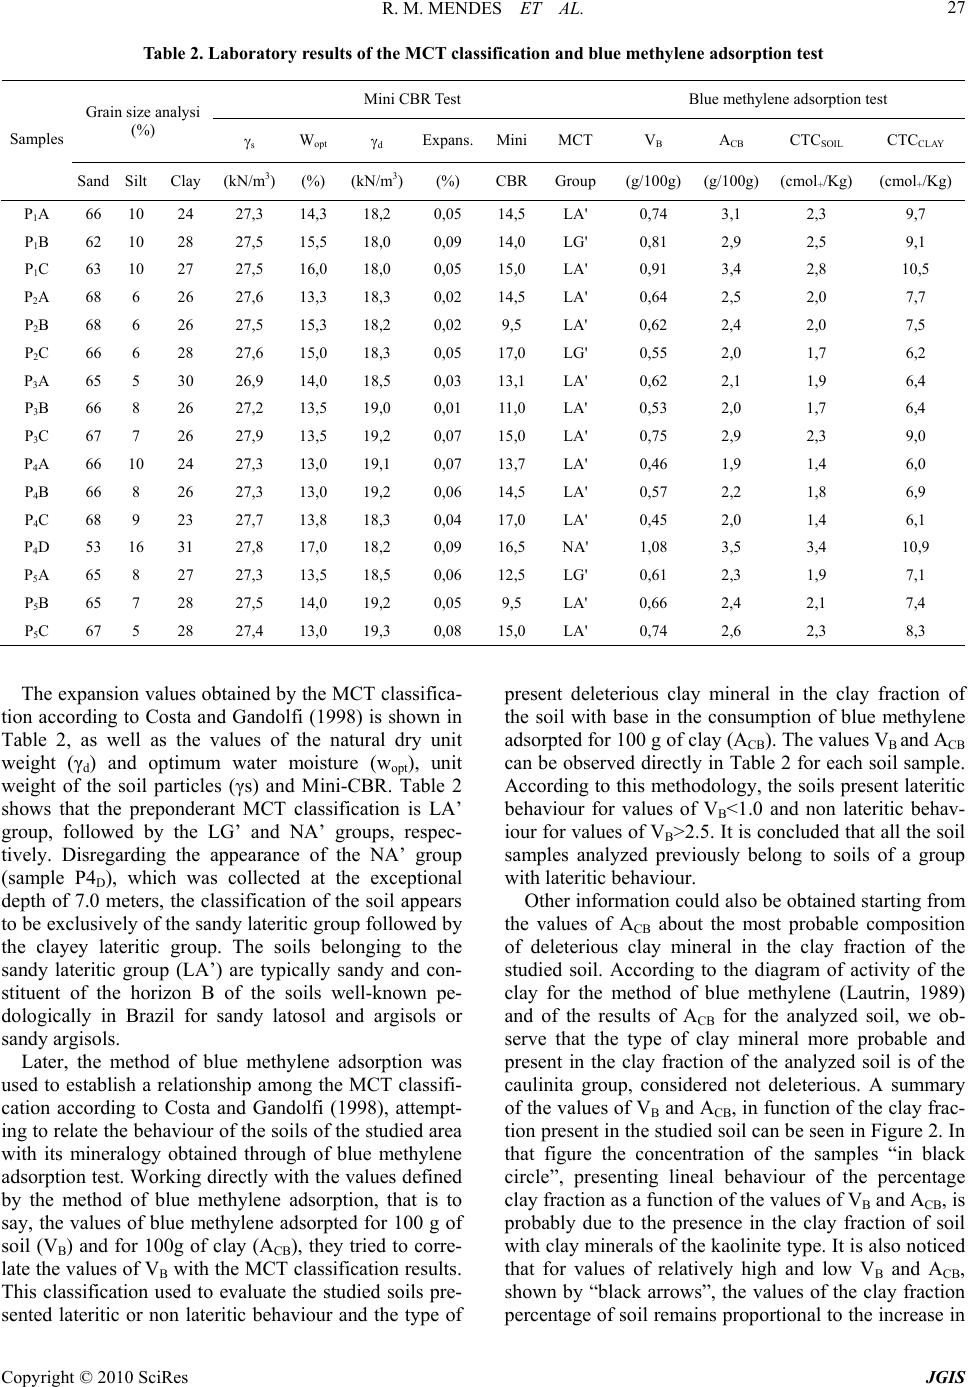 R. M. MENDES ET AL. Copyright © 2010 SciRes JGIS 27 Table 2. Laboratory results of the MCT classification and blue methylene adsorption test Mini CBR Test Blue methylene adsorption test Grain size analysi (%) s Wopt d Expans.MiniMCT VB ACB CTCSOIL CTCCLAY Samples Sand Silt Clay (kN/m3) (%) (kN/m3)(%) CBRGroup(g/100g)(g/100g) (cmol+/Kg) (cmol+/Kg) P1A 66 10 24 27,3 14,3 18,2 0,05 14,5LA' 0,74 3,1 2,3 9,7 P1B 62 10 28 27,5 15,5 18,0 0,09 14,0LG' 0,81 2,9 2,5 9,1 P1C 63 10 27 27,5 16,0 18,0 0,05 15,0LA' 0,91 3,4 2,8 10,5 P2A 68 6 26 27,6 13,3 18,3 0,02 14,5LA' 0,64 2,5 2,0 7,7 P2B 68 6 26 27,5 15,3 18,2 0,02 9,5 LA' 0,62 2,4 2,0 7,5 P2C 66 6 28 27,6 15,0 18,3 0,05 17,0LG' 0,55 2,0 1,7 6,2 P3A 65 5 30 26,9 14,0 18,5 0,03 13,1LA' 0,62 2,1 1,9 6,4 P3B 66 8 26 27,2 13,5 19,0 0,01 11,0LA' 0,53 2,0 1,7 6,4 P3C 67 7 26 27,9 13,5 19,2 0,07 15,0LA' 0,75 2,9 2,3 9,0 P4A 66 10 24 27,3 13,0 19,1 0,07 13,7LA' 0,46 1,9 1,4 6,0 P4B 66 8 26 27,3 13,0 19,2 0,06 14,5LA' 0,57 2,2 1,8 6,9 P4C 68 9 23 27,7 13,8 18,3 0,04 17,0LA' 0,45 2,0 1,4 6,1 P4D 53 16 31 27,8 17,0 18,2 0,09 16,5NA' 1,08 3,5 3,4 10,9 P5A 65 8 27 27,3 13,5 18,5 0,06 12,5LG' 0,61 2,3 1,9 7,1 P5B 65 7 28 27,5 14,0 19,2 0,05 9,5 LA' 0,66 2,4 2,1 7,4 P5C 67 5 28 27,4 13,0 19,3 0,08 15,0LA' 0,74 2,6 2,3 8,3 The expansion values obtained by the MCT classifica- tion according to Costa and Gandolfi (1998) is shown in Table 2, as well as the values of the natural dry unit weight (γd) and optimum water moisture (wopt), unit weight of the soil particles (γs) and Mini-CBR. Table 2 shows that the preponderant MCT classification is LA’ group, followed by the LG’ and NA’ groups, respec- tively. Disregarding the appearance of the NA’ group (sample P4D), which was collected at the exceptional depth of 7.0 meters, the classification of the soil appears to be exclusively of the sandy lateritic group followed by the clayey lateritic group. The soils belonging to the sandy lateritic group (LA’) are typically sandy and con- stituent of the horizon B of the soils well-known pe- dologically in Brazil for sandy latosol and argisols or sandy argisols. Later, the method of blue methylene adsorption was used to establish a relationship among the MCT classifi- cation according to Costa and Gandolfi (1998), attempt- ing to relate the behaviour of the soils of the studied area with its mineralogy obtained through of blue methylene adsorption test. Working directly with the values defined by the method of blue methylene adsorption, that is to say, the values of blue methylene adsorpted for 100 g of soil (VB) and for 100g of clay (ACB), they tried to corre- late the values of VB with the MCT classification results. This classification used to evaluate the studied soils pre- sented lateritic or non lateritic behaviour and the type of present deleterious clay mineral in the clay fraction of the soil with base in the consumption of blue methylene adsorpted for 100 g of clay (ACB). The values VB and ACB can be observed directly in Table 2 for each soil sample. According to this methodology, the soils present lateritic behaviour for values of VB<1.0 and non lateritic behav- iour for values of VB>2.5. It is concluded that all the soil samples analyzed previously belong to soils of a group with lateritic behaviour. Other information could also be obtained starting from the values of ACB about the most probable composition of deleterious clay mineral in the clay fraction of the studied soil. According to the diagram of activity of the clay for the method of blue methylene (Lautrin, 1989) and of the results of ACB for the analyzed soil, we ob- serve that the type of clay mineral more probable and present in the clay fraction of the analyzed soil is of the caulinita group, considered not deleterious. A summary of the values of VB and ACB, in function of the clay frac- tion present in the studied soil can be seen in Figure 2. In that figure the concentration of the samples “in black circle”, presenting lineal behaviour of the percentage clay fraction as a function of the values of VB and ACB, is probably due to the presence in the clay fraction of soil with clay minerals of the kaolinite type. It is also noticed that for values of relatively high and low VB and ACB, shown by “black arrows”, the values of the clay fraction percentage of soil remains proportional to the increase in 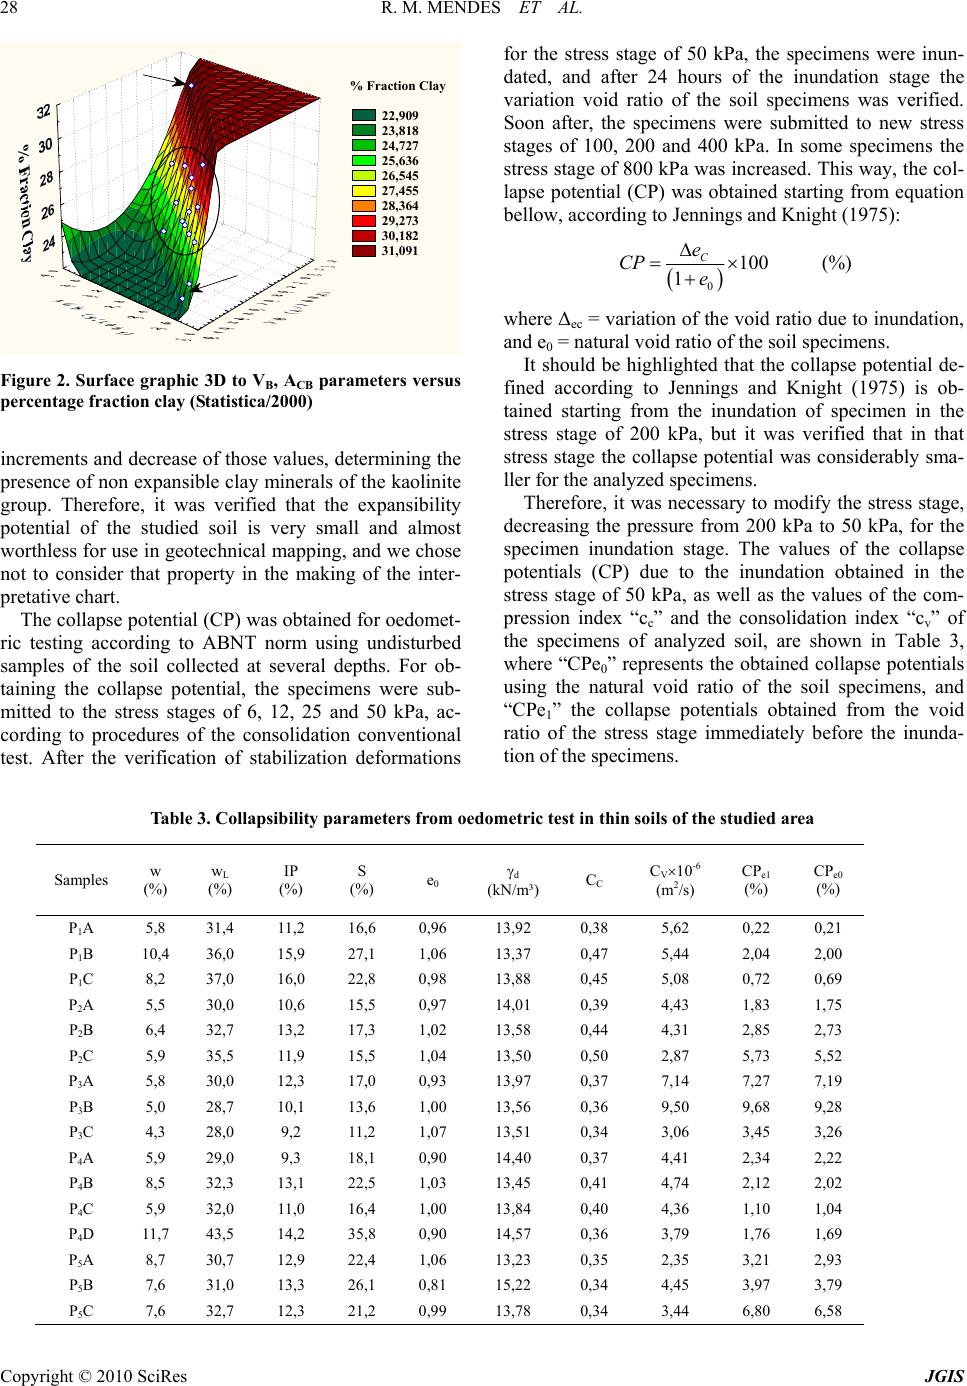 R. M. MENDES ET AL. Copyright © 2010 SciRes JGIS 28 % Fraction Clay 22,909 23,818 24,727 25,636 26,545 27,455 28,364 29,273 30,182 31,091 Figure 2. Surface graphic 3D to VB, ACB parameters versus percentage fraction clay (Statistica/2000) increments and decrease of those values, determining the presence of non expansible clay minerals of the kaolinite group. Therefore, it was verified that the expansibility potential of the studied soil is very small and almost worthless for use in geotechnical mapping, and we chose not to consider that property in the making of the inter- pretative chart. The collapse potential (CP) was obtained for oedomet- ric testing according to ABNT norm using undisturbed samples of the soil collected at several depths. For ob- taining the collapse potential, the specimens were sub- mitted to the stress stages of 6, 12, 25 and 50 kPa, ac- cording to procedures of the consolidation conventional test. After the verification of stabilization deformations for the stress stage of 50 kPa, the specimens were inun- dated, and after 24 hours of the inundation stage the variation void ratio of the soil specimens was verified. Soon after, the specimens were submitted to new stress stages of 100, 200 and 400 kPa. In some specimens the stress stage of 800 kPa was increased. This way, the col- lapse potential (CP) was obtained starting from equation bellow, according to Jennings and Knight (1975): 0 100 1 C e CP e (%) where Δec = variation of the void ratio due to inundation, and e0 = natural void ratio of the soil specimens. It should be highlighted that the collapse potential de- fined according to Jennings and Knight (1975) is ob- tained starting from the inundation of specimen in the stress stage of 200 kPa, but it was verified that in that stress stage the collapse potential was considerably sma- ller for the analyzed specimens. Therefore, it was necessary to modify the stress stage, decreasing the pressure from 200 kPa to 50 kPa, for the specimen inundation stage. The values of the collapse potentials (CP) due to the inundation obtained in the stress stage of 50 kPa, as well as the values of the com- pression index “cc” and the consolidation index “cv” of the specimens of analyzed soil, are shown in Table 3, where “CPe0” represents the obtained collapse potentials using the natural void ratio of the soil specimens, and “CPe1” the collapse potentials obtained from the void ratio of the stress stage immediately before the inunda- tion of the specimens. Table 3. Collapsibility parameters from oedometric test in thin soils of the studied area Samples w (%) wL (%) IP (%) S (%) e0 d (kN/m³) CC CV10-6 (m2/s) CPe1 (%) CPe0 (%) P1A 5,8 31,4 11,2 16,6 0,96 13,92 0,38 5,62 0,22 0,21 P1B 10,4 36,0 15,9 27,1 1,06 13,37 0,47 5,44 2,04 2,00 P1C 8,2 37,0 16,0 22,8 0,98 13,88 0,45 5,08 0,72 0,69 P2A 5,5 30,0 10,6 15,5 0,97 14,01 0,39 4,43 1,83 1,75 P2B 6,4 32,7 13,2 17,3 1,02 13,58 0,44 4,31 2,85 2,73 P2C 5,9 35,5 11,9 15,5 1,04 13,50 0,50 2,87 5,73 5,52 P3A 5,8 30,0 12,3 17,0 0,93 13,97 0,37 7,14 7,27 7,19 P3B 5,0 28,7 10,1 13,6 1,00 13,56 0,36 9,50 9,68 9,28 P3C 4,3 28,0 9,2 11,2 1,07 13,51 0,34 3,06 3,45 3,26 P4A 5,9 29,0 9,3 18,1 0,90 14,40 0,37 4,41 2,34 2,22 P4B 8,5 32,3 13,1 22,5 1,03 13,45 0,41 4,74 2,12 2,02 P4C 5,9 32,0 11,0 16,4 1,00 13,84 0,40 4,36 1,10 1,04 P4D 11,7 43,5 14,2 35,8 0,90 14,57 0,36 3,79 1,76 1,69 P5A 8,7 30,7 12,9 22,4 1,06 13,23 0,35 2,35 3,21 2,93 P5B 7,6 31,0 13,3 26,1 0,81 15,22 0,34 4,45 3,97 3,79 P5C 7,6 32,7 12,3 21,2 0,99 13,78 0,34 3,44 6,80 6,58 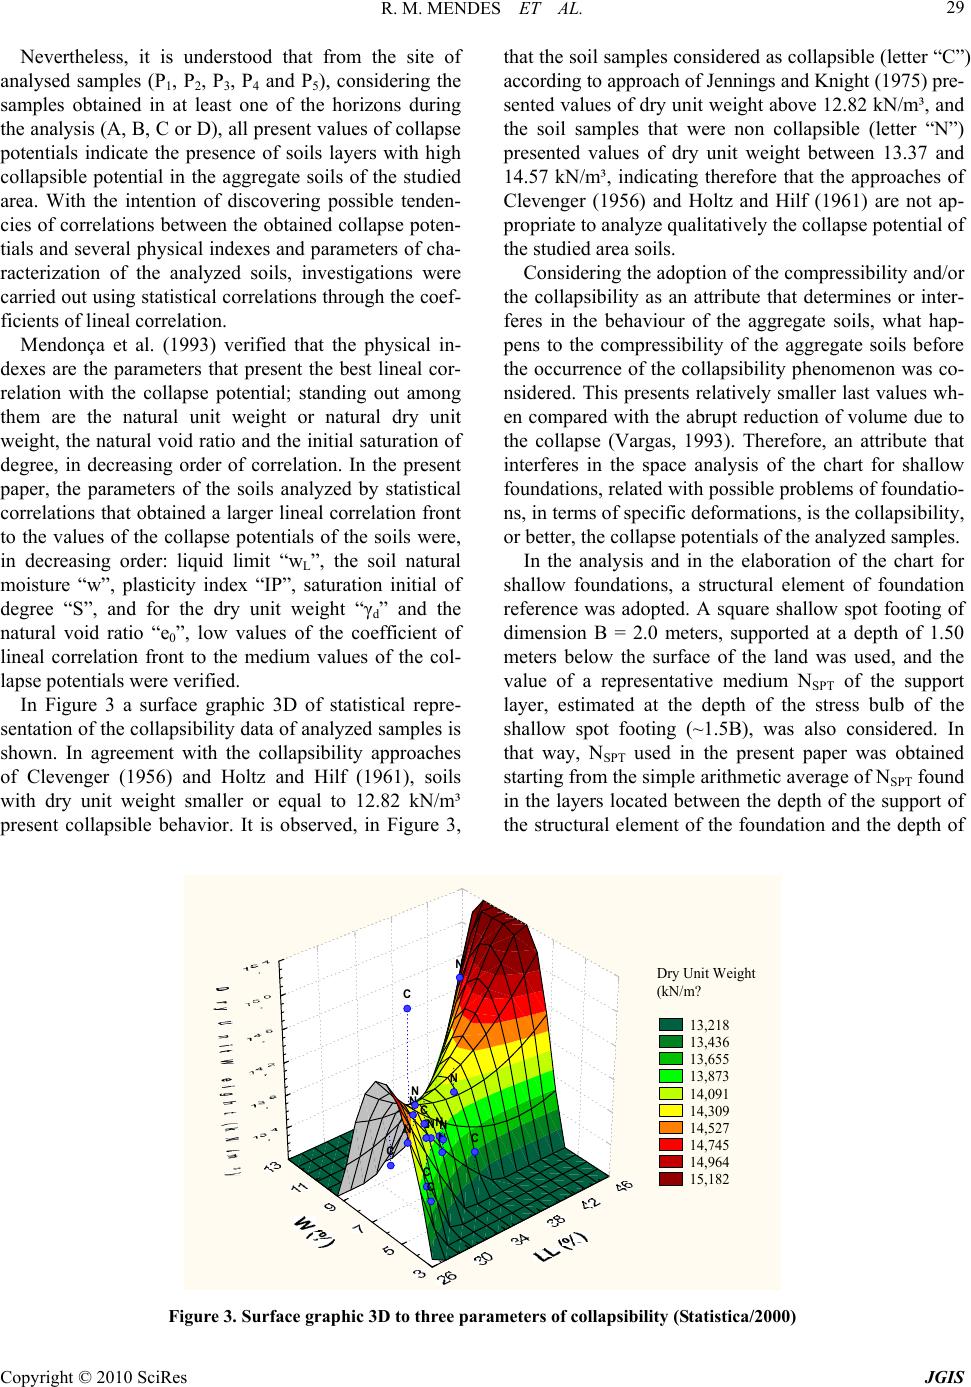 R. M. MENDES ET AL. Copyright © 2010 SciRes JGIS 29 Nevertheless, it is understood that from the site of analysed samples (P1, P2, P3, P4 and P5), considering the samples obtained in at least one of the horizons during the analysis (A, B, C or D), all present values of collapse potentials indicate the presence of soils layers with high collapsible potential in the aggregate soils of the studied area. With the intention of discovering possible tenden- cies of correlations between the obtained collapse poten- tials and several physical indexes and parameters of cha- racterization of the analyzed soils, investigations were carried out using statistical correlations through the coef- ficients of lineal correlation. Mendonça et al. (1993) verified that the physical in- dexes are the parameters that present the best lineal cor- relation with the collapse potential; standing out among them are the natural unit weight or natural dry unit weight, the natural void ratio and the initial saturation of degree, in decreasing order of correlation. In the present paper, the parameters of the soils analyzed by statistical correlations that obtained a larger lineal correlation front to the values of the collapse potentials of the soils were, in decreasing order: liquid limit “wL”, the soil natural moisture “w”, plasticity index “IP”, saturation initial of degree “S”, and for the dry unit weight “γd” and the natural void ratio “e0”, low values of the coefficient of lineal correlation front to the medium values of the col- lapse potentials were verified. In Figure 3 a surface graphic 3D of statistical repre- sentation of the collapsibility data of analyzed samples is shown. In agreement with the collapsibility approaches of Clevenger (1956) and Holtz and Hilf (1961), soils with dry unit weight smaller or equal to 12.82 kN/m³ present collapsible behavior. It is observed, in Figure 3, that the soil samples considered as collapsible (letter “C”) according to approach of Jennings and Knight (1975) pre- sented values of dry unit weight above 12.82 kN/m³, and the soil samples that were non collapsible (letter “N”) presented values of dry unit weight between 13.37 and 14.57 kN/m³, indicating therefore that the approaches of Clevenger (1956) and Holtz and Hilf (1961) are not ap- propriate to analyze qualitatively the collapse potential of the studied area soils. Considering the adoption of the compressibility and/or the collapsibility as an attribute that determines or inter- feres in the behaviour of the aggregate soils, what hap- pens to the compressibility of the aggregate soils before the occurrence of the collapsibility phenomenon was co- nsidered. This presents relatively smaller last values wh- en compared with the abrupt reduction of volume due to the collapse (Vargas, 1993). Therefore, an attribute that interferes in the space analysis of the chart for shallow foundations, related with possible problems of foundatio- ns, in terms of specific deformations, is the collapsibility, or better, the collapse potentials of the analyzed samples. In the analysis and in the elaboration of the chart for shallow foundations, a structural element of foundation reference was adopted. A square shallow spot footing of dimension B = 2.0 meters, supported at a depth of 1.50 meters below the surface of the land was used, and the value of a representative medium NSPT of the support layer, estimated at the depth of the stress bulb of the shallow spot footing (~1.5B), was also considered. In that way, NSPT used in the present paper was obtained starting from the simple arithmetic average of NSPT found in the layers located between the depth of the support of the structural element of the foundation and the depth of N N N NNC C C C N NN N C C C Dry Unit Weight (kN/m? 13,218 13,436 13,655 13,873 14,091 14,309 14,527 14,745 14,964 15,182 Figure 3. Surface graphic 3D to three parameters of collapsibility (Statistica/2000) 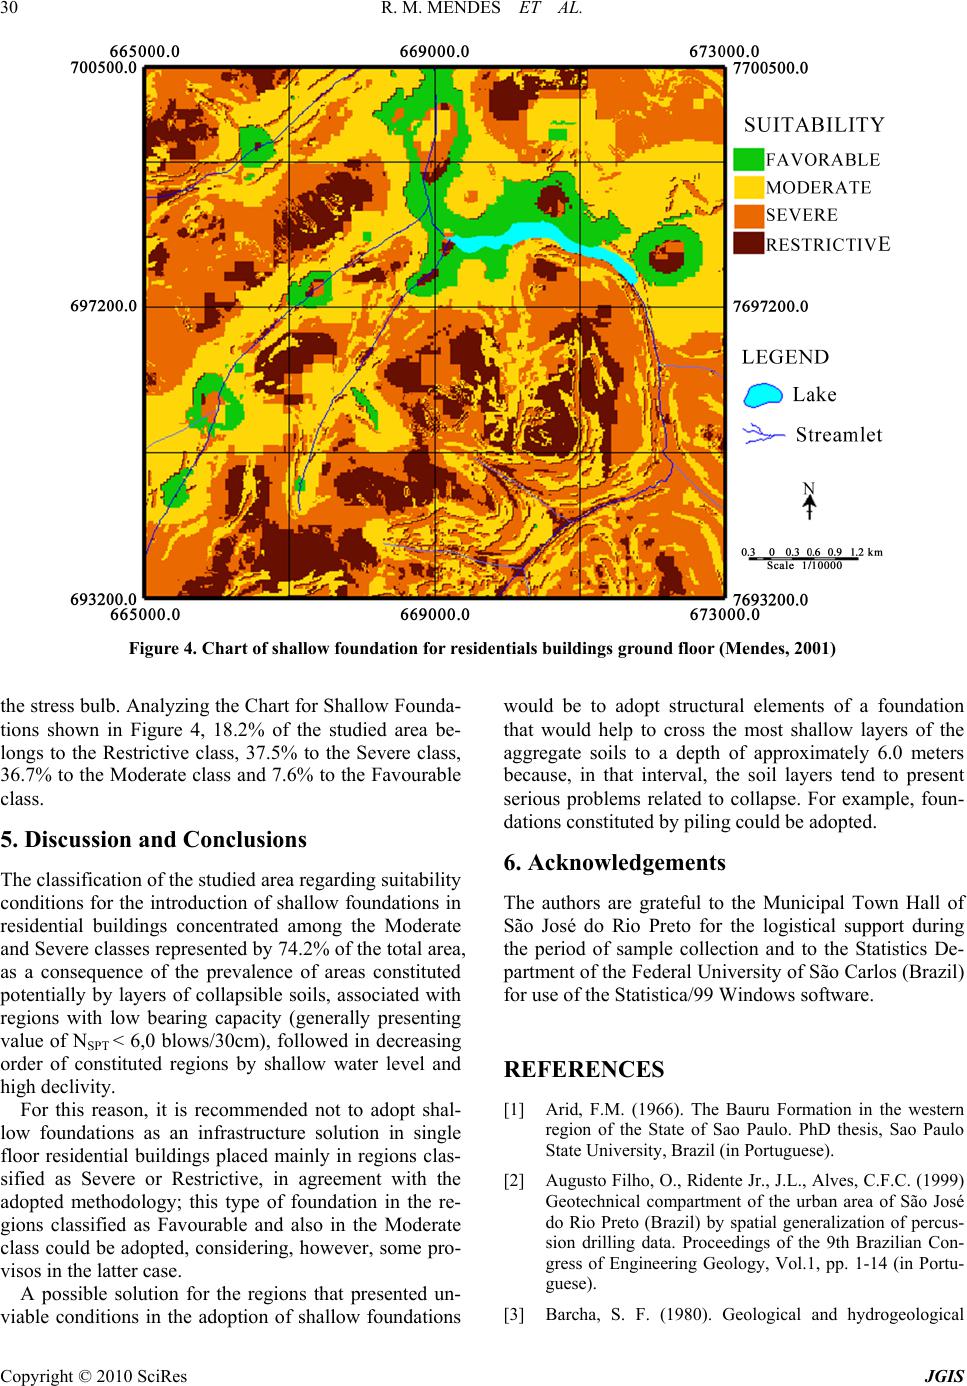 R. M. MENDES ET AL. Copyright © 2010 SciRes JGIS 30 Figure 4. Chart of shallow foundation for residentials buildings ground floor (Mendes, 2001) the stress bulb. Analyzing the Chart for Shallow Founda- tions shown in Figure 4, 18.2% of the studied area be- longs to the Restrictive class, 37.5% to the Severe class, 36.7% to the Moderate class and 7.6% to the Favourable class. 5. Discussion and Conclusions The classification of the studied area regarding suitability conditions for the introduction of shallow foundations in residential buildings concentrated among the Moderate and Severe classes represented by 74.2% of the total area, as a consequence of the prevalence of areas constituted potentially by layers of collapsible soils, associated with regions with low bearing capacity (generally presenting value of NSPT < 6,0 blows/30cm), followed in decreasing order of constituted regions by shallow water level and high declivity. For this reason, it is recommended not to adopt shal- low foundations as an infrastructure solution in single floor residential buildings placed mainly in regions clas- sified as Severe or Restrictive, in agreement with the adopted methodology; this type of foundation in the re- gions classified as Favourable and also in the Moderate class could be adopted, considering, however, some pro- visos in the latter case. A possible solution for the regions that presented un- viable conditions in the adoption of shallow foundations would be to adopt structural elements of a foundation that would help to cross the most shallow layers of the aggregate soils to a depth of approximately 6.0 meters because, in that interval, the soil layers tend to present serious problems related to collapse. For example, foun- dations constituted by piling could be adopted. 6. Acknowledgements The authors are grateful to the Municipal Town Hall of São José do Rio Preto for the logistical support during the period of sample collection and to the Statistics De- partment of the Federal University of São Carlos (Brazil) for use of the Statistica/99 Windows software. REFERENCES [1] Arid, F.M. (1966). The Bauru Formation in the western region of the State of Sao Paulo. PhD thesis, Sao Paulo State University, Brazil (in Portuguese). [2] Augusto Filho, O., Ridente Jr., J.L., Alves, C.F.C. (1999) Geotechnical compartment of the urban area of São José do Rio Preto (Brazil) by spatial generalization of percus- sion drilling data. Proceedings of the 9th Brazilian Con- gress of Engineering Geology, Vol.1, pp. 1-14 (in Portu- guese). [3] Barcha, S. F. (1980). Geological and hydrogeological  R. M. MENDES ET AL. Copyright © 2010 SciRes JGIS 31 aspects of the Bauru Formation in the western region of the State of São Paulo. PhD thesis, São Paulo State Uni- versity, Brazil (in Portuguese). [4] Birkholz, L.B. et al. (1983) The urbanization process and the development industrial in State of São Paulo. 2nd edi- tion. Nobel, São Paulo (in Portuguese). [5] Brasil–IBGE (2001) Statistical data of the censu popula- tion of 2000, 1, 05-08 (http://www.ibge.gov.br /ibge/estatistica/populacao/censo2000). (in Portuguese) [6] Caiado, A.; Vasconcelos, L. (1994) The politics of attract municipal: industrial location and industrial districts. Mimeo, Campinas. (in Portuguese) [7] Campolina Diniz, C.; Santos, F. (1995) South-west: structural heterogeneous and perspectives. In: Affonso, R. and Silva, P. (ed.), Federalism in Brazil. Regional ine- qualities and development. São Paulo, pp 195-223 (in Portuguese). [8] Clevenger, W. A. (1956) Experiences with loess as foun- dation material. Proceedings of the American Society of Civil Engineers, 1025: pp. 1-26. [9] Costa, T.C.D.; Gandolfi, N. (1998) The blue methylene method and its correlation with the MCT classificacion. Proceedings of the 8th Congress of the International As- sociation for Engineering Geology and Environment, Vol. 1, pp. 307-314. [10] Deutsch, C. V.; Journel, A.G. (1992) GSLIB: Geostatist- ical Software Library and user's guide. Oxford University Press, New York. [11] Hang, P.T.; Brindley, G.W. (1970) Methylene blue ab- sorption by clay minerals: determination of surface areas and cation exchange capacities. Clays and Clay Minerals, 18, 203-212. [12] Holtz, W.G.; Hilf, J.W. (1961) Settlement of soil founda- tions due to saturation. Earth Dams Section. Bureau of Reclamation, 673-679. [13] Honorato, S.; Mackenna, J. (1975) Influence of the grain-size distribution of an porous media on your per- meability. Proceedings of the 5th Panamerican Congress of Soil Mechanics and Foundation Engineering, Vol. 3, pp. 135-148 (in Portuguese). [14] Jennings, J.E.; Knight, K. (1975) A guide to construction on or with materials exhibiting additional settlement due to collapse of grain structure. Proceedings of the 6th Re- gional Conference for Africa on Soil Mechanics and Foundation Engineering, pp. 99-105. [15] Lautrin, D. (1989) Utilisation pratique des paramètres dèdivés de l’essai au bleu de méthylène dans les projets de génie civil. Bull. Liaison Labo P. et Ch., 160, 53-65. [16] Mendes, R.M. (2001) Geotechnical mapping of the urban center area of São José do Rio Preto (Brazil) in scale 1:10.000 – as an aid to urban planning. M.S. thesis, Federal University of São Carlos, São Paulo, Brazil (in Portuguese). [17] Mendonça, M.B; Mahler, C.F.; Pereira, J.H.F. (1993) Laboratory tests on colapsible soils of the Bom Jesus da Lapa (Brazil) region. Soils and Rocks, 16, 159-172 (in Portuguese). [18] Negri, B.; Pacheco, C. A. (1993) Technological change and regional development in the 90’s: the internalization of the development to new space dimension of the paulist industry. Accord SCTDE/FECAMP/UNICAMP-IE (in Portuguese). [19] Nogami, J. S.; Villibor, D.F. (1979) Soil characterization of mapping units for highway purposes in a tropical area. Bulletin of the International Association of Engineering Geology, 19, 196-199. [20] Pejon, O. J. (1992) Geotechnical mapping of Piraci- caba-Brazil (scale 1:100.000): study of methodology as- pects, caracterization and attributes presentation. PhD thesis, Engineering School of São Carlos, University of São Paulo, Brazil (in Portuguese). [21] São Paulo-FFLCH/USP-IPT-FAPESP (1997) Geomor- phological map of the São Paulo State. In Ross, J.L.S. and Moroz, I.C. (eds.), 64p + color map in scale 1:500.000 (in Portuguese). [22] Statistica (2000) Statistica for windows: computer pro- gram manual. StatSoft, Inc.,Tulsa, OK., one CDROM. [23] Vargas, M. (1993) Colapsible and porous soils. Lecture Notes. Engineering School of São Carlos, University of São Paulo, Brazil (in Portuguese). [24] Zuquette, L.V. (1987) Critical analysis of the geotechni- cal mapping and methodological proposal for the brazil- ian conditions. PhD thesis, Engineering School of São Carlos, University of São Paulo, Brazil (in Portuguese). [25] Zuquette, L.V. (1993) The importance of geotechnical mapping in the use and occupation of the physical envi- ronment: basis and guide for development. Free Acade- mician thesis, Engineering School of São Carlos, Univer- sity of São Paulo, Brazil (in Portuguese). |

