Paper Menu >>
Journal Menu >>
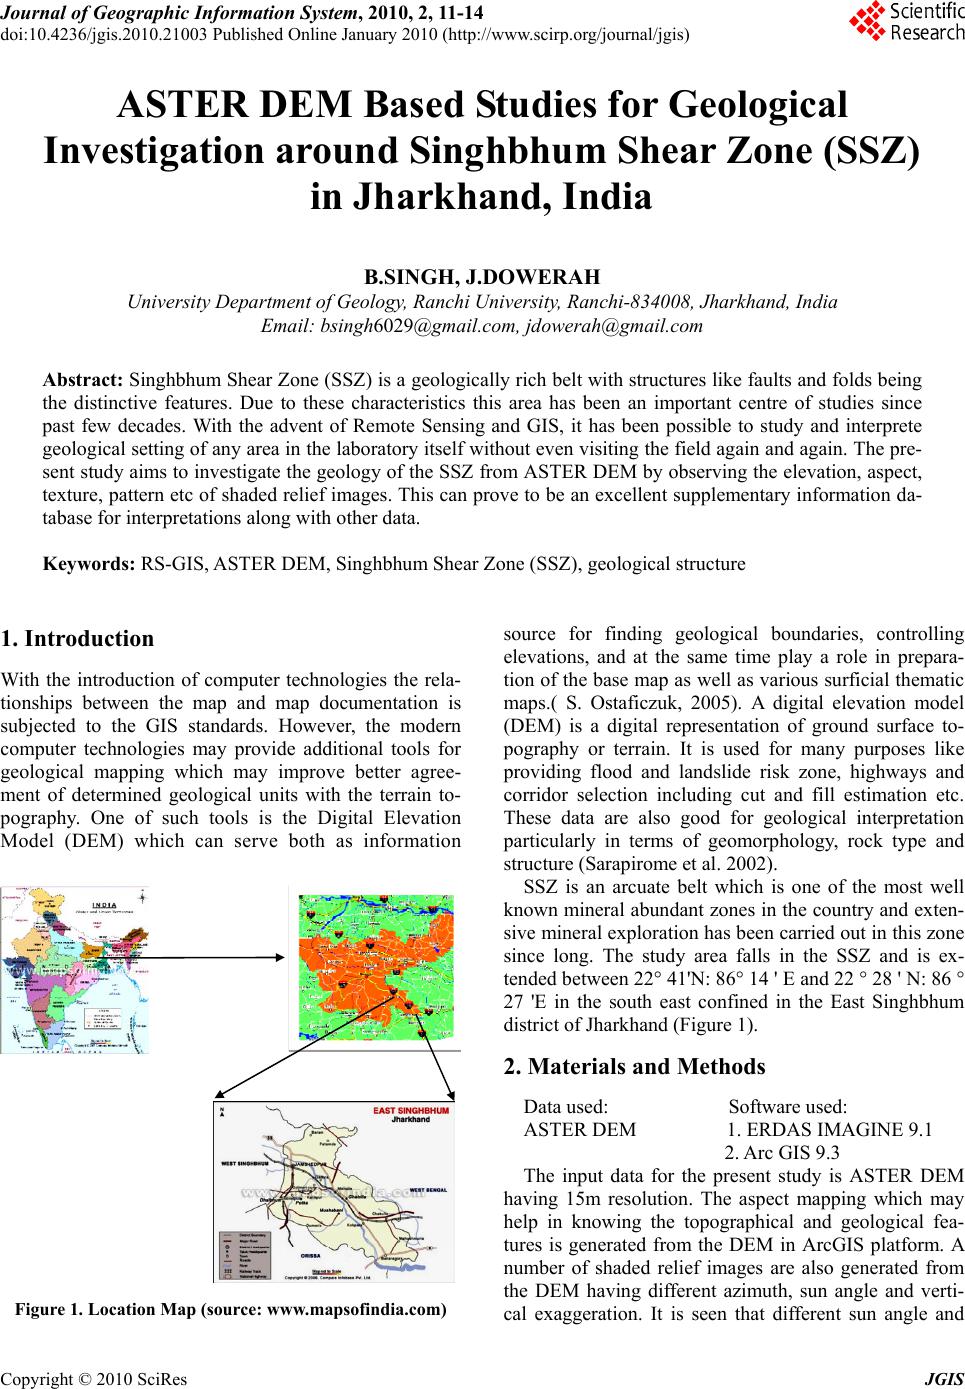 Journal of Geographic Information System, 2010, 2, 11-14 doi:10.4236/jgis.2010.21003 Published Online January 2010 (http://www.scirp.org/journal/jgis) Copyright © 2010 SciRes JGIS ASTER DEM Based Studies for Geological Investigation around Singhbhum Shear Zone (SSZ) in Jharkhand, India B.SINGH, J.DOWERAH University Department of Geology, Ranchi University, Ranchi-834008, Jharkhand, India Email: bsingh6029@gmail.com, jdowerah@gmail.com Abstract: Singhbhum Shear Zone (SSZ) is a geologically rich belt with structures like faults and folds b eing the distinctive features. Due to these characteristics this area has been an important centre of studies since past few decades. With the advent of Remote Sensing and GIS, it has been possible to study and interprete geological setting of any area in the laboratory itself w ithout even vi siting the field again an d again. The pr e- sent study aims to investigate the geology of the SSZ from ASTER DEM by observing the elevation, aspect, texture, pattern etc of shaded relief images. This can prove to be an ex cellent supplementary information da- tabase for interpretations along with other data. Keywords: RS-GIS, ASTER DEM, Singhbhum Shear Zone (SSZ), geological structure 1. Introduction With the introduction of computer technologies the rela- tionships between the map and map documentation is subjected to the GIS standards. However, the modern computer technologies may provide additional tools for geological mapping which may improve better agree- ment of determined geological units with the terrain to- pography. One of such tools is the Digital Elevation Model (DEM) which can serve both as information Figure 1. Location Map (source: www.mapsofindia.com) source for finding geological boundaries, controlling elevations, and at the same time play a role in prepara- tion of the base map as well as various surficial thematic maps.( S. Ostaficzuk, 2005). A digital elevation model (DEM) is a digital representation of ground surface to- pography or terrain. It is used for many purposes like providing flood and landslide risk zone, highways and corridor selection including cut and fill estimation etc. These data are also good for geological interpretation particularly in terms of geomorphology, rock type and structure (Sarapirome et al. 2002). SSZ is an arcuate belt which is one of the most well known mineral abun dant zones in the country and ex ten- sive mineral exploration has been carried out in this zone since long. The study area falls in the SSZ and is ex- tended between 22° 41'N: 86° 14 ' E and 22 ° 28 ' N: 86 ° 27 'E in the south east confined in the East Singhbhum district of Jharkhand (Figure 1). 2. Materials and Methods Data used: Software used: ASTER DEM 1. ERDAS IMAGINE 9.1 2. Arc GIS 9.3 The input data for the present study is ASTER DEM having 15m resolution. The aspect mapping which may help in knowing the topographical and geological fea- tures is generated from the DEM in ArcGIS platform. A number of shaded relief images are also generated from the DEM having different azimuth, sun angle and verti- cal exaggeration. It is seen that different sun angle and  B. SINGH ET AL. Copyright © 2010 SciRes JGIS 12 INPUT ASTER DEM ASPECT MAP SHADED R E LIEF IMAGE INTERPRETATION RESULTS EXISTING LITHOLOGICAL MAP EXISTING GEOMORPHOLOGICAL MAP Figure 2. Flowchart showing methodology Figure 3. Aspect Map of study area azimuth help in enhancing different features. On these parameters the various interpretations are made based on the shaded relief images, aspect map with reference to the existing geomorphological and lithological maps. The results are hereby presented in this pa per (Fi gu re 2) . 3. Data Interpretation Shaded relief images can help in extracting information about geomorphology, rock types and structure of an area. From the shaded relief image, the morphology which is described as extent, size, shape, height, variation of slope and aspect on the surface can be identified. Geological structures look curvilinear or linear on an image, out of which the curvilinears may indicate dome structures and the linears may indicate faults (Lillesand et al.1979) In the present study, aspect map of the study area is prepared from the ASTER DEM and the shaded relief images are enhanced by changing the sun angle, azimuth and height exaggeration in different images. Changes in texture and pattern are seen in different parts in different images after the enhancements. It also helps in enhancing the rock type and structures to a certain extent. The en- hanced features observed when the sun angles and azi- muth are changed are as follows- 1) The NW elongated and arcuate shaped hilly areas associated with faults are seen in the middle part of 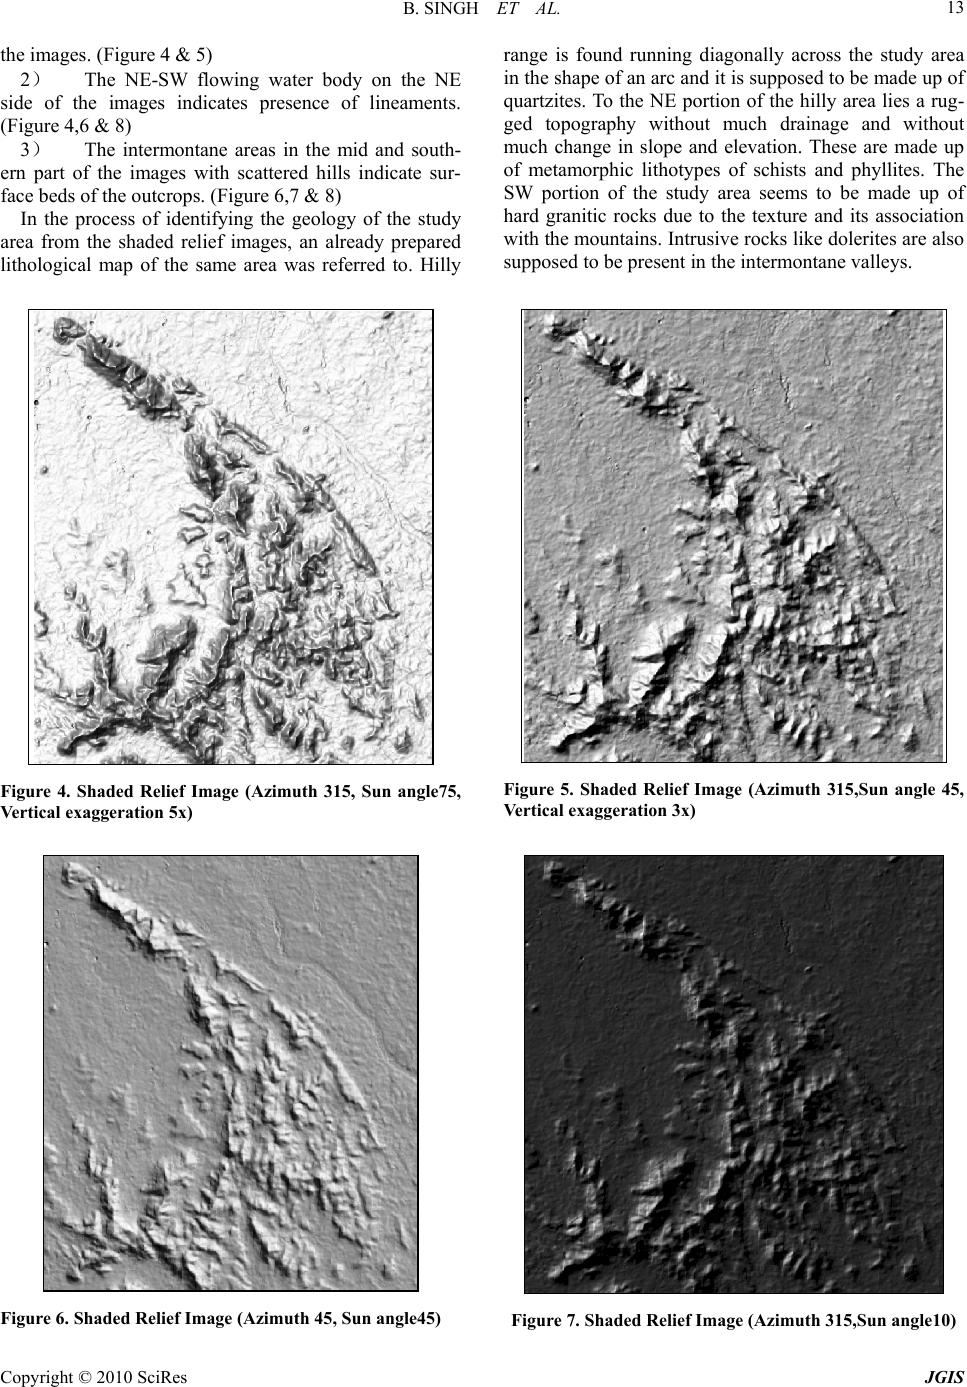 B. SINGH ET AL. Copyright © 2010 SciRes JGIS 13 the images. (Figure 4 & 5) 2) The NE-SW flowing water body on the NE side of the images indicates presence of lineaments. (Figure 4,6 & 8) 3) The intermontane areas in the mid and south- ern part of the images with scattered hills indicate sur- face beds of the outcrops. (Figure 6,7 & 8) In the process of identifying the geology of the study area from the shaded relief images, an already prepared lithological map of the same area was referred to. Hilly range is found running diagonally across the study area in the shape of an arc an d it is suppo sed to be made up of quartzites. To the NE portion of the hilly area lies a rug- ged topography without much drainage and without much change in slope and elevation. These are made up of metamorphic lithotypes of schists and phyllites. The SW portion of the study area seems to be made up of hard granitic rocks due to the texture and its association with the mountains. Intrusive rocks like dolerites are also supposed to be present in the intermontane valleys. Figure 4. Shaded Relief Image (Azimuth 315, Sun angle75, Vertical exaggeration 5x) Figure 5. Shaded Relief Image (Azimuth 315,Sun angle 45, Vertical exaggeration 3x) Figure 6. Shaded Relief Image (Azimuth 45, Sun angle45) Figure 7. Shaded Relief Image (Azimuth 315,Sun angle10)  B. SINGH ET AL. Copyright © 2010 SciRes JGIS 14 Figure 8. Shaded Relief Image (Azimuth 225, Sun angle10) 4. Conclusion It is seen that DEM data can be used for geological in- terpretation in terms of geomorphology, materials and structure/ lineaments recognition but not to a very de- tailed level (Drury, 1987). It can be used for defining the structure, morphology etc of an area but as it lacks in- formation like that of vegetation cover or soil moisture it cannot be trusted to give an accurate interpretation of the geology. DEM data, however cannot be ignored alto- gether as it can be very useful in giving an overview of the geology of any area especially where no other data is available for study. It can also prove to be a reliable source of supplementary datatabase in the visual inter- pretation as far as Remote Sensing and GIS is concerned. Reconnaissance survey before the interpretation can fur- ther help to identify the characteristic features seen through the imag eries. For better results an integrated datasets like topograp- hical maps, aerial photographs, satellite data and ground data generated by previous workers can be h i ghl y usef ul . 5. Acknowledgements This work has been carried out under the ISRO-SAC (RESPOND) Project (SAC Code: 0GP62, ISRO Code: 10/4/556), Department of Space, Govt. of India. We are thankful for the support provided by the Head of the Un- iv. Dept. of Geology, Ranchi University. We also thank Dr. A.T.Jeyaseelan, Director, JSAC for his kind motiva- tion and co-operation. Dr. T.J.Majumder SAC focal per- son under the project is also gratefully acknowledged for his sharing and academic comments. REFERENCES [1] Drury, S.A., (1987) Image Interpretation in Geology, Allen & Unwin, London. [2] Gupta, R.P. (2003) Remote Sensing Geology 2nd Edition. Springer, India. [3] Lillesand, T.M., Kiefer, R.W., (1979) Remote Sensing and Image Interpretation, John Wiley and Sons, New York. [4] Lo, C.P., Yeung, A.K. (2002) Concepts and Techniques of Geographic Information Systems 1st Edition, Prentice Hall, India. [5] Ostaficzuk, S (ed). (2005) The Current Role of Geologi- cal Mapping in Geosciences, Springer, Netherlands, pp.89-96. [6] Sarapirome, S et.al (2002) Application of DEM data to Geological Interpretation: Tho Pha Phum Area, Thailand. 23rd Asian Conference on Remote Sensing, Birendra In- ternational Convention Centre, Kathmandu, Nepal. [7] Singh, B, Dowerah, J.(2009) RS-GIS Based Strategies for Mineral Targetting in Parts of Singhbhum Shear Zone, Jharkhand.Vistas in Geological Research U.U. Spl. Publ. in Geology, Vol.8, pp. 81-86. |