Paper Menu >>
Journal Menu >>
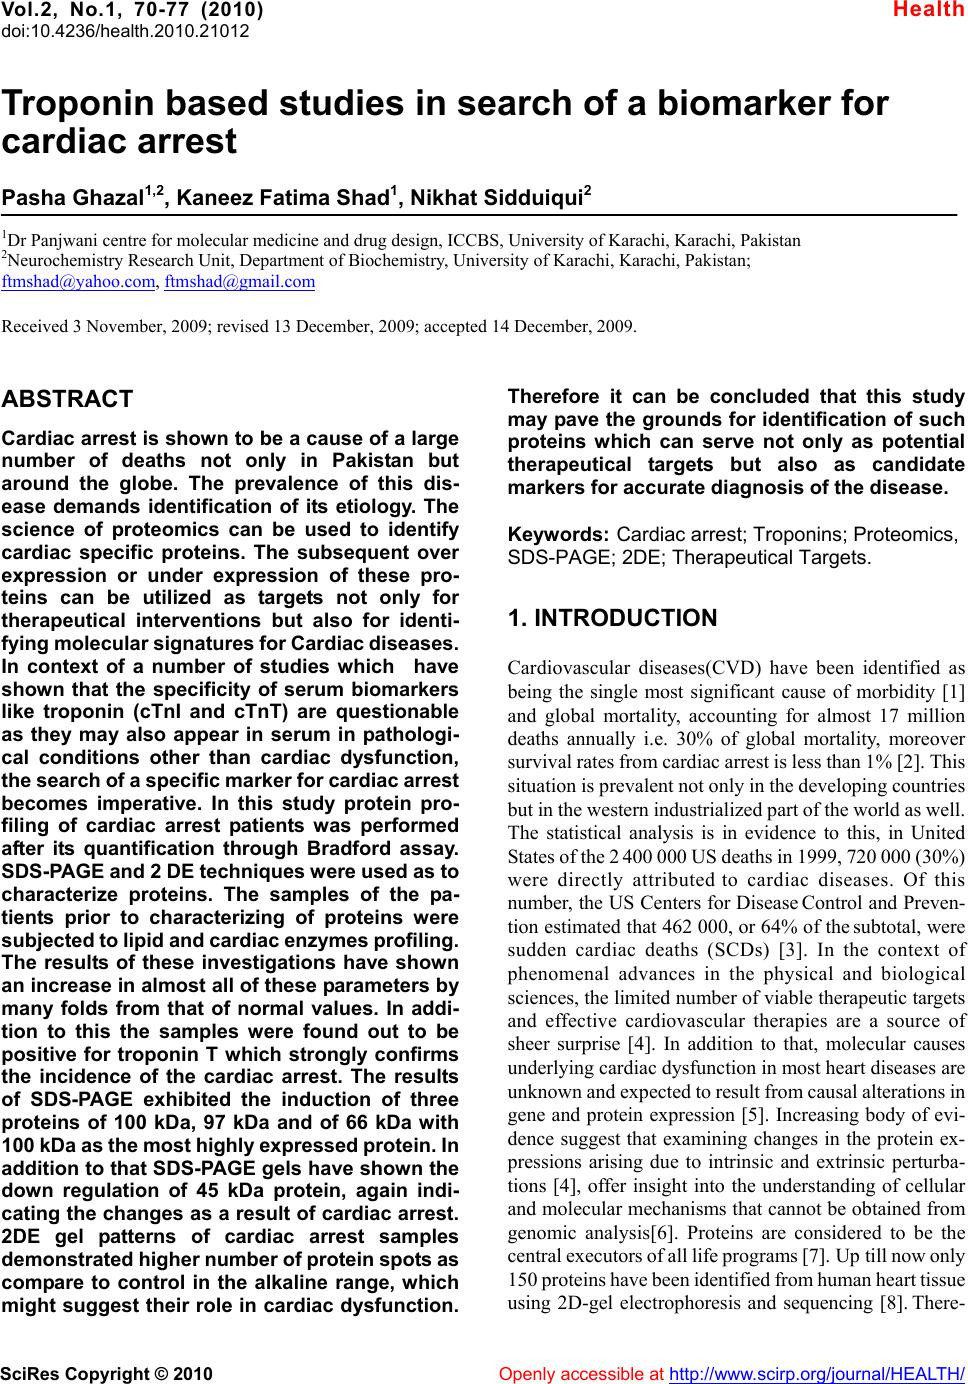 Vol.2, No.1, 70-77 (2010) doi:10.4236/health.2010.21012 SciRes Copyright © 2010 Openly accessible at http://www.scirp.org/journal/HEALTH/ Health Troponin based studies in search of a biomarker for cardiac arrest Pasha Ghazal1,2, Kaneez Fatima Shad1, Nikhat Sidduiqui2 1Dr Panjwani centre for molecular medicine and drug design, ICCBS, University of Karachi, Karachi, Pakistan 2Neurochemistry Research Unit, Department of Biochemistry, University of Karachi, Karachi, Pakistan; ftmshad@yahoo.com, ftmshad@gmail.com Received 3 November, 2009; revised 13 December, 2009; accepted 14 December, 2009. ABSTRACT Cardiac arrest is shown to be a cause of a large number of deaths not only in Pakistan but around the globe. The prevalence of this dis- ease demands identification of its etiology. The science of proteomics can be used to identify cardiac specific proteins. The subsequent over expression or under expression of these pro- teins can be utilized as targets not only for therapeutical interventions but also for identi- fying molecular signatures for Cardiac diseases. In context of a number of studies which have shown that the specificity of serum biomarkers like troponin (cTnI and cTnT) are questionable as they may also appear in serum in pathologi- cal conditions other than cardiac dysfunction, the search of a specific marker for cardiac arrest becomes imperative. In this study protein pro- filing of cardiac arrest patients was performed after its quantification through Bradford assay. SDS-PAGE and 2 DE techniques were used as to characterize proteins. The samples of the pa- tients prior to characterizing of proteins were subjected to lipid and cardiac enzymes profiling. The results of these investigations have shown an increase in almost all of these parameters by many folds from that of normal values. In addi- tion to this the samples were found out to be positive for troponin T which strongly confirms the incidence of the cardiac arrest. The results of SDS-PAGE exhibited the induction of three proteins of 100 kDa, 97 kDa and of 66 kDa with 100 kDa as the most highly expressed protein. In addition to that SDS-PAGE gels have shown the down regulation of 45 kDa protein, again indi- cating the changes as a result of cardiac arrest. 2DE gel patterns of cardiac arrest samples demonstrated higher number of protein spots as compare to control in the alkaline range, which might suggest their role in cardiac dysfunction. Therefore it can be concluded that this study may pave the grounds for identification of such proteins which can serve not only as potential therapeutical targets but also as candidate markers for accurate diagnosis of the disease. Keywords: Cardiac arrest; Troponins; Proteomics, SDS-PAGE; 2DE; Therapeutical Targets. 1. INTRODUCTION Cardiovascular diseases(CVD) have been identified as being the single most significant cause of morbidity [1] and global mortality, accounting for almost 17 million deaths annually i.e. 30% of global mortality, moreover survival rates from cardiac arrest is less than 1% [2]. This situation is prevalent not only in the developing countries but in the western industrialized part of the world as well. The statistical analysis is in evidence to this, in United States of the 2 400 000 US deaths in 1999, 720 000 (30%) were directly attributed to cardiac diseases. Of this number, the US Centers for Disease Control and Preven- tion estimated that 462 000, or 64% of the subtotal, were sudden cardiac deaths (SCDs) [3]. In the context of phenomenal advances in the physical and biological sciences, the limited number of viable therapeutic targets and effective cardiovascular therapies are a source of sheer surprise [4]. In addition to that, molecular causes underlying cardiac dysfunction in most heart diseases are unknown and expected to result from causal alterations in gene and protein expression [5]. Increasing body of evi- dence suggest that examining changes in the protein ex- pressions arising due to intrinsic and extrinsic perturba- tions [4], offer insight into the understanding of cellular and molecular mechanisms that cannot be obtained from genomic analysis[6]. Proteins are considered to be the central executors of all life programs [7]. Up till now only 150 proteins have been identified from human heart tissue using 2D-gel electrophoresis and sequencing [8]. There- 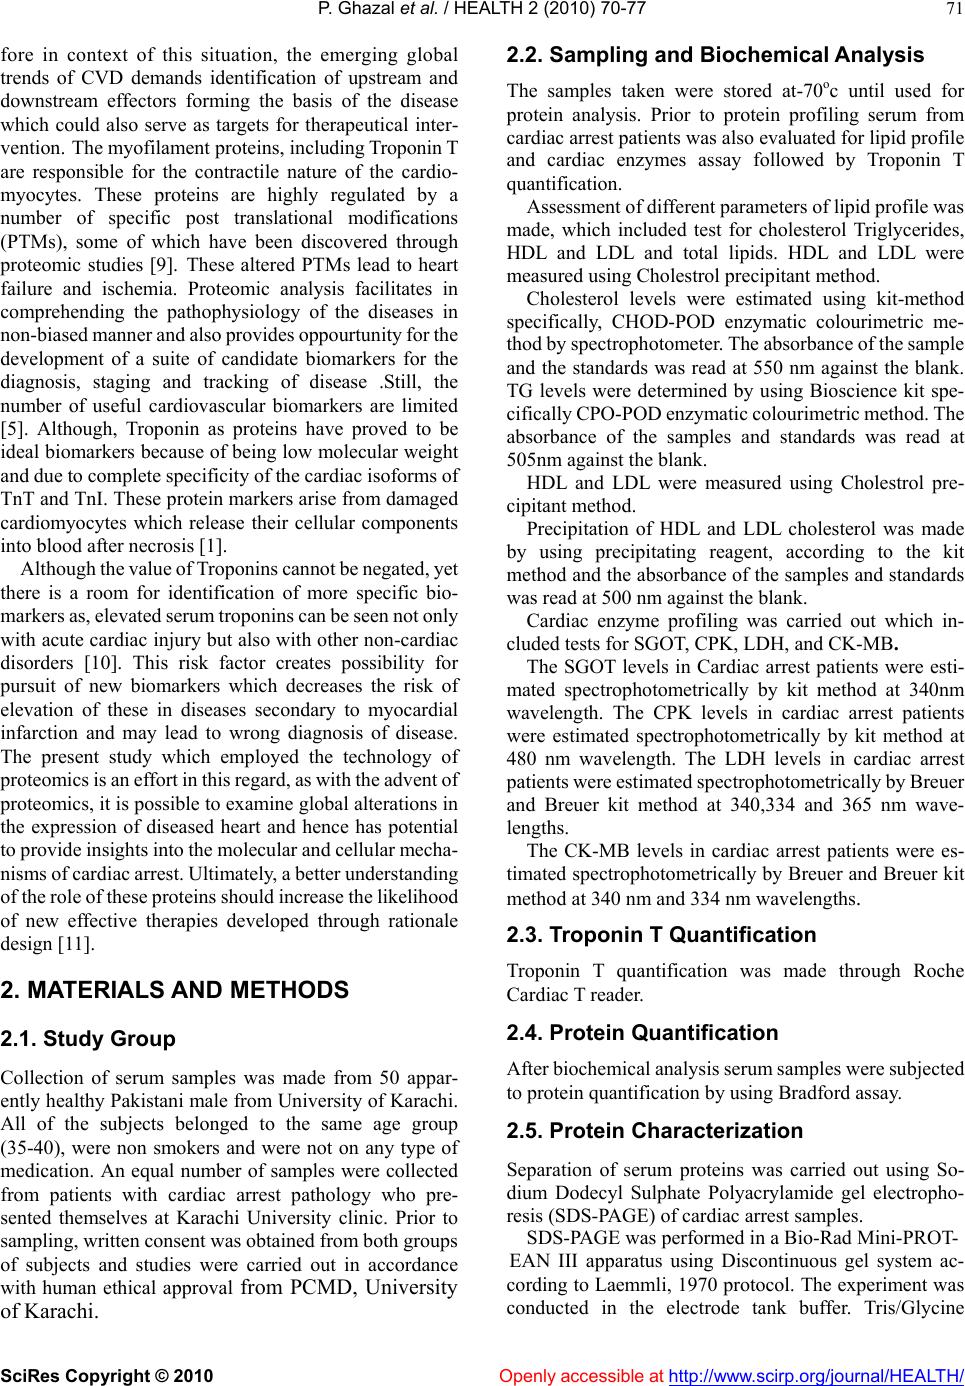 P. Ghazal et al. / HEALTH 2 (2010) 70-77 SciRes Copyright © 2010 Openly accessible at http://www.scirp.org/journal/HEALTH/ 71 fore in context of this situation, the emerging global trends of CVD demands identification of upstream and downstream effectors forming the basis of the disease which could also serve as targets for therapeutical inter- vention. The myofilament proteins, including Troponin T are responsible for the contractile nature of the cardio- myocytes. These proteins are highly regulated by a number of specific post translational modifications (PTMs), some of which have been discovered through proteomic studies [9]. These altered PTMs lead to heart failure and ischemia. Proteomic analysis facilitates in comprehending the pathophysiology of the diseases in non-biased manner and also provides oppourtunity for the development of a suite of candidate biomarkers for the diagnosis, staging and tracking of disease .Still, the number of useful cardiovascular biomarkers are limited [5]. Although, Troponin as proteins have proved to be ideal biomarkers because of being low molecular weight and due to complete specificity of the cardiac isoforms of TnT and TnI. These protein markers arise from damaged cardiomyocytes which release their cellular components into blood after necrosis [1]. Although the value of Troponins cannot be negated, yet there is a room for identification of more specific bio- markers as, elevated serum troponins can be seen not only with acute cardiac injury but also with other non-cardiac disorders [10]. This risk factor creates possibility for pursuit of new biomarkers which decreases the risk of elevation of these in diseases secondary to myocardial infarction and may lead to wrong diagnosis of disease. The present study which employed the technology of proteomics is an effort in this regard, as with the advent of proteomics, it is possible to examine global alterations in the expression of diseased heart and hence has potential to provide insights into the molecular and cellular mecha- nisms of cardiac arrest. Ultimately, a better understanding of the role of these proteins should increase the likelihood of new effective therapies developed through rationale design [11]. 2. MATERIALS AND METHODS 2.1. Study Group Collection of serum samples was made from 50 appar- ently healthy Pakistani male from University of Karachi. All of the subjects belonged to the same age group (35-40), were non smokers and were not on any type of medication. An equal number of samples were collected from patients with cardiac arrest pathology who pre- sented themselves at Karachi University clinic. Prior to sampling, written consent was obtained from both groups of subjects and studies were carried out in accordance with human ethical approval from PCMD, University of Karachi. 2.2. Sampling and Biochemical Analysis The samples taken were stored at-70oc until used for protein analysis. Prior to protein profiling serum from cardiac arrest patients was also evaluated for lipid profile and cardiac enzymes assay followed by Troponin T quantification. Assessment of different parameters of lipid profile was made, which included test for cholesterol Triglycerides, HDL and LDL and total lipids. HDL and LDL were measured using Cholestrol precipitant method. Cholesterol levels were estimated using kit-method specifically, CHOD-POD enzymatic colourimetric me- thod by spectrophotometer. The absorbance of the sample and the standards was read at 550 nm against the blank. TG levels were determined by using Bioscience kit spe- cifically CPO-POD enzymatic colourimetric method. The absorbance of the samples and standards was read at 505nm against the blank. HDL and LDL were measured using Cholestrol pre- cipitant method. Precipitation of HDL and LDL cholesterol was made by using precipitating reagent, according to the kit method and the absorbance of the samples and standards was read at 500 nm against the blank. Cardiac enzyme profiling was carried out which in- cluded tests for SGOT, CPK, LDH, and CK-MB. The SGOT levels in Cardiac arrest patients were esti- mated spectrophotometrically by kit method at 340nm wavelength. The CPK levels in cardiac arrest patients were estimated spectrophotometrically by kit method at 480 nm wavelength. The LDH levels in cardiac arrest patients were estimated spectrophotometrically by Breuer and Breuer kit method at 340,334 and 365 nm wave- lengths. The CK-MB levels in cardiac arrest patients were es- timated spectrophotometrically by Breuer and Breuer kit method at 340 nm and 334 nm wavelengths. 2.3. Troponin T Quantification Troponin T quantification was made through Roche Cardiac T reader. 2.4. Protein Quantification After biochemical analysis serum samples were subjected to protein quantification by using Bradford assay. 2.5. Protein Characterization Separation of serum proteins was carried out using So- dium Dodecyl Sulphate Polyacrylamide gel electropho- resis (SDS-PAGE) of cardiac arrest samples. SDS-PAGE was performed in a Bio-Rad Mini-PROT- EAN III apparatus using Discontinuous gel system ac- cording to Laemmli, 1970 protocol. The experiment was conducted in the electrode tank buffer. Tris/Glycine 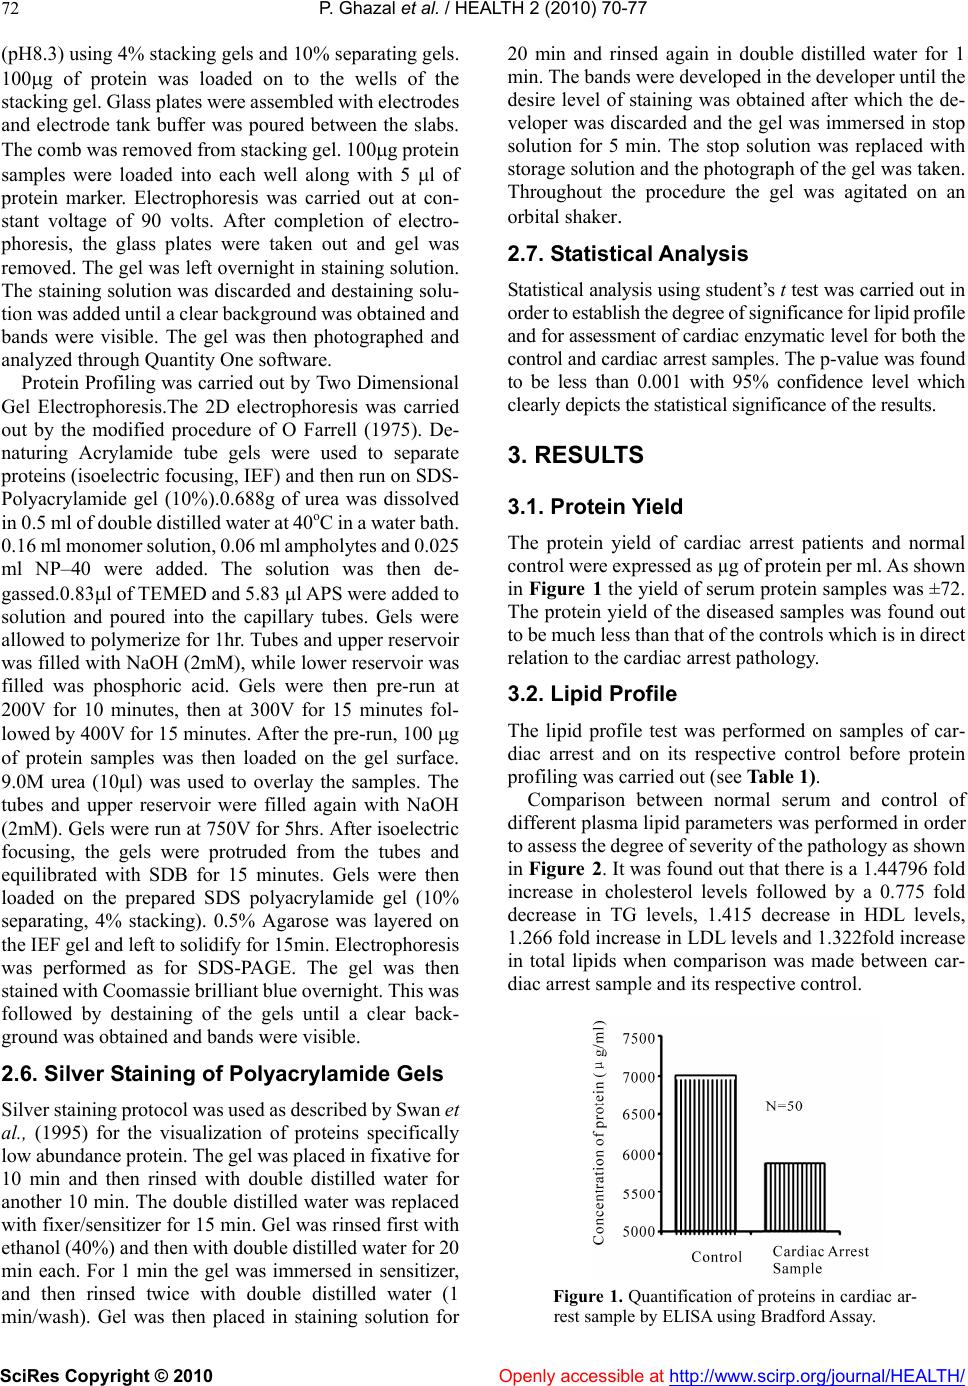 P. Ghazal et al. / HEALTH 2 (2010) 70-77 SciRes Copyright © 2010 Openly accessible at http://www.scirp.org/journal/HEALTH/ 72 (pH8.3) using 4% stacking gels and 10% separating gels. 100g of protein was loaded on to the wells of the stacking gel. Glass plates were assembled with electrodes and electrode tank buffer was poured between the slabs. The comb was removed from stacking gel. 100g protein samples were loaded into each well along with 5 l of protein marker. Electrophoresis was carried out at con- stant voltage of 90 volts. After completion of electro- phoresis, the glass plates were taken out and gel was removed. The gel was left overnight in staining solution. The staining solution was discarded and destaining solu- tion was added until a clear background was obtained and bands were visible. The gel was then photographed and analyzed through Quantity One software. Protein Profiling was carried out by Two Dimensional Gel Electrophoresis.The 2D electrophoresis was carried out by the modified procedure of O Farrell (1975). De- naturing Acrylamide tube gels were used to separate proteins (isoelectric focusing, IEF) and then run on SDS- Polyacrylamide gel (10%).0.688g of urea was dissolved in 0.5 ml of double distilled water at 40oC in a water bath. 0.16 ml monomer solution, 0.06 ml ampholytes and 0.025 ml NP–40 were added. The solution was then de- gassed.0.83l of TEMED and 5.83 l APS were added to solution and poured into the capillary tubes. Gels were allowed to polymerize for 1hr. Tubes and upper reservoir was filled with NaOH (2mM), while lower reservoir was filled was phosphoric acid. Gels were then pre-run at 200V for 10 minutes, then at 300V for 15 minutes fol- lowed by 400V for 15 minutes. After the pre-run, 100 g of protein samples was then loaded on the gel surface. 9.0M urea (10l) was used to overlay the samples. The tubes and upper reservoir were filled again with NaOH (2mM). Gels were run at 750V for 5hrs. After isoelectric focusing, the gels were protruded from the tubes and equilibrated with SDB for 15 minutes. Gels were then loaded on the prepared SDS polyacrylamide gel (10% separating, 4% stacking). 0.5% Agarose was layered on the IEF gel and left to solidify for 15min. Electrophoresis was performed as for SDS-PAGE. The gel was then stained with Coomassie brilliant blue overnight. This was followed by destaining of the gels until a clear back- ground was obtained and bands were visible. 2.6. Silver Staining of Polyacrylamide Gels Silver staining protocol was used as described by Swan et al., (1995) for the visualization of proteins specifically low abundance protein. The gel was placed in fixative for 10 min and then rinsed with double distilled water for another 10 min. The double distilled water was replaced with fixer/sensitizer for 15 min. Gel was rinsed first with ethanol (40%) and then with double distilled water for 20 min each. For 1 min the gel was immersed in sensitizer, and then rinsed twice with double distilled water (1 min/wash). Gel was then placed in staining solution for 20 min and rinsed again in double distilled water for 1 min. The bands were developed in the developer until the desire level of staining was obtained after which the de- veloper was discarded and the gel was immersed in stop solution for 5 min. The stop solution was replaced with storage solution and the photograph of the gel was taken. Throughout the procedure the gel was agitated on an orbital shaker. 2.7. Statistical Analysis Statistical analysis using student’s t test was carried out in order to establish the degree of significance for lipid profile and for assessment of cardiac enzymatic level for both the control and cardiac arrest samples. The p-value was found to be less than 0.001 with 95% confidence level which clearly depicts the statistical significance of the results. 3. RESULTS 3.1. Protein Yield The protein yield of cardiac arrest patients and normal control were expressed as µg of protein per ml. As shown in Figure 1 the yield of serum protein samples was ±72. The protein yield of the diseased samples was found out to be much less than that of the controls which is in direct relation to the cardiac arrest pathology. 3.2. Lipid Profile The lipid profile test was performed on samples of car- diac arrest and on its respective control before protein profiling was carried out (see Table 1). Comparison between normal serum and control of different plasma lipid parameters was performed in order to assess the degree of severity of the pathology as shown in Figure 2. It was found out that there is a 1.44796 fold increase in cholesterol levels followed by a 0.775 fold decrease in TG levels, 1.415 decrease in HDL levels, 1.266 fold increase in LDL levels and 1.322fold increase in total lipids when comparison was made between car- diac arrest sample and its respective control. Figure 1. Quantification of proteins in cardiac ar- rest sample by ELISA using Bradford Assay. 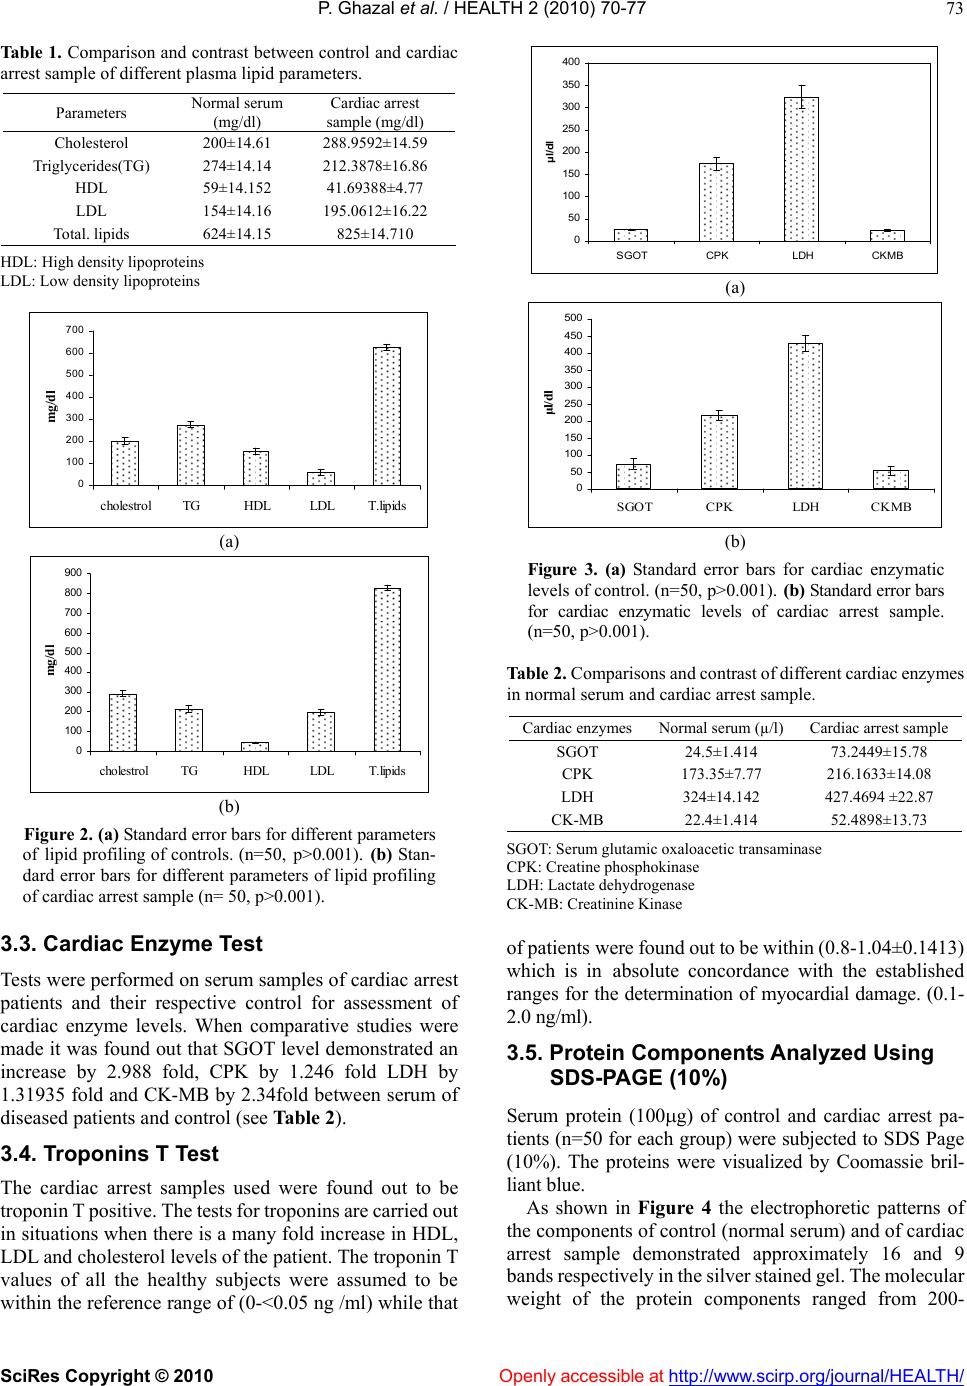 P. Ghazal et al. / HEALTH 2 (2010) 70-77 SciRes Copyright © 2010 Openly accessible at http://www.scirp.org/journal/HEALTH/ 73 Table 1. Comparison and contrast between control and cardiac arrest sample of different plasma lipid parameters. Parameters Normal serum (mg/dl) Cardiac arrest sample (mg/dl) Cholesterol 200±14.61 288.9592±14.59 Triglycerides(TG) 274±14.14 212.3878±16.86 HDL 59±14.152 41.69388±4.77 LDL 154±14.16 195.0612±16.22 Total. lipids 624±14.15 825±14.710 HDL: High density lipoproteins LDL: Low density lipoproteins 0 100 200 300 400 500 600 700 cholestrol TGHDLLDLT.lipids mg/d l (a) 0 100 200 300 400 500 600 700 800 900 cholestrol TGHDLLDLT.lipids mg/d l (b) Figure 2. (a) Standard error bars for different parameters of lipid profiling of controls. (n=50, p>0.001). (b) Sta n- dard error bars for different parameters of lipid profiling of cardiac arrest sample (n= 50, p>0.001). 3.3. Cardiac Enzyme Test Tests were performed on serum samples of cardiac arrest patients and their respective control for assessment of cardiac enzyme levels. When comparative studies were made it was found out that SGOT level demonstrated an increase by 2.988 fold, CPK by 1.246 fold LDH by 1.31935 fold and CK-MB by 2.34fold between serum of diseased patients and control (see Table 2). 3.4. Troponins T Test The cardiac arrest samples used were found out to be troponin T positive. The tests for troponins are carried out in situations when there is a many fold increase in HDL, LDL and cholesterol levels of the patient. The troponin T values of all the healthy subjects were assumed to be within the reference range of (0-<0.05 ng /ml) while that 0 50 100 150 200 250 300 350 400 SGOT CPKLDH CKMB μl/dl (a) 0 50 100 150 200 250 300 350 400 450 500 SGOTCPKLDH CKMB μl/dl (b) Figure 3. (a) Standard error bars for cardiac enzymatic levels of control. (n=50, p>0.001). (b) Standard error bars for cardiac enzymatic levels of cardiac arrest sample. (n=50, p>0.001). Table 2. Comparisons and contrast of different cardiac enzymes in normal serum and cardiac arrest sample. Cardiac enzymesNormal serum (µ/l) Cardiac arrest sample SGOT 24.5±1.414 73.2449±15.78 CPK 173.35±7.77 216.1633±14.08 LDH 324±14.142 427.4694 ±22.87 CK-MB 22.4±1.414 52.4898±13.73 SGOT: Serum glutamic oxaloacetic transaminase CPK: Creatine phosphokinase LDH: Lactate dehydrogenase CK-MB: Creatinine Kinase of patients were found out to be within (0.8-1.04±0.1413) which is in absolute concordance with the established ranges for the determination of myocardial damage. (0.1- 2.0 ng/ml). 3.5. Protein Components Analyzed Using SDS-PAGE (10%) Serum protein (100g) of control and cardiac arrest pa- tients (n=50 for each group) were subjected to SDS Page (10%). The proteins were visualized by Coomassie bril- liant blue. As shown in Figure 4 the electrophoretic patterns of the components of control (normal serum) and of cardiac arrest sample demonstrated approximately 16 and 9 bands respectively in the silver stained gel. The molecular weight of the protein components ranged from 200- 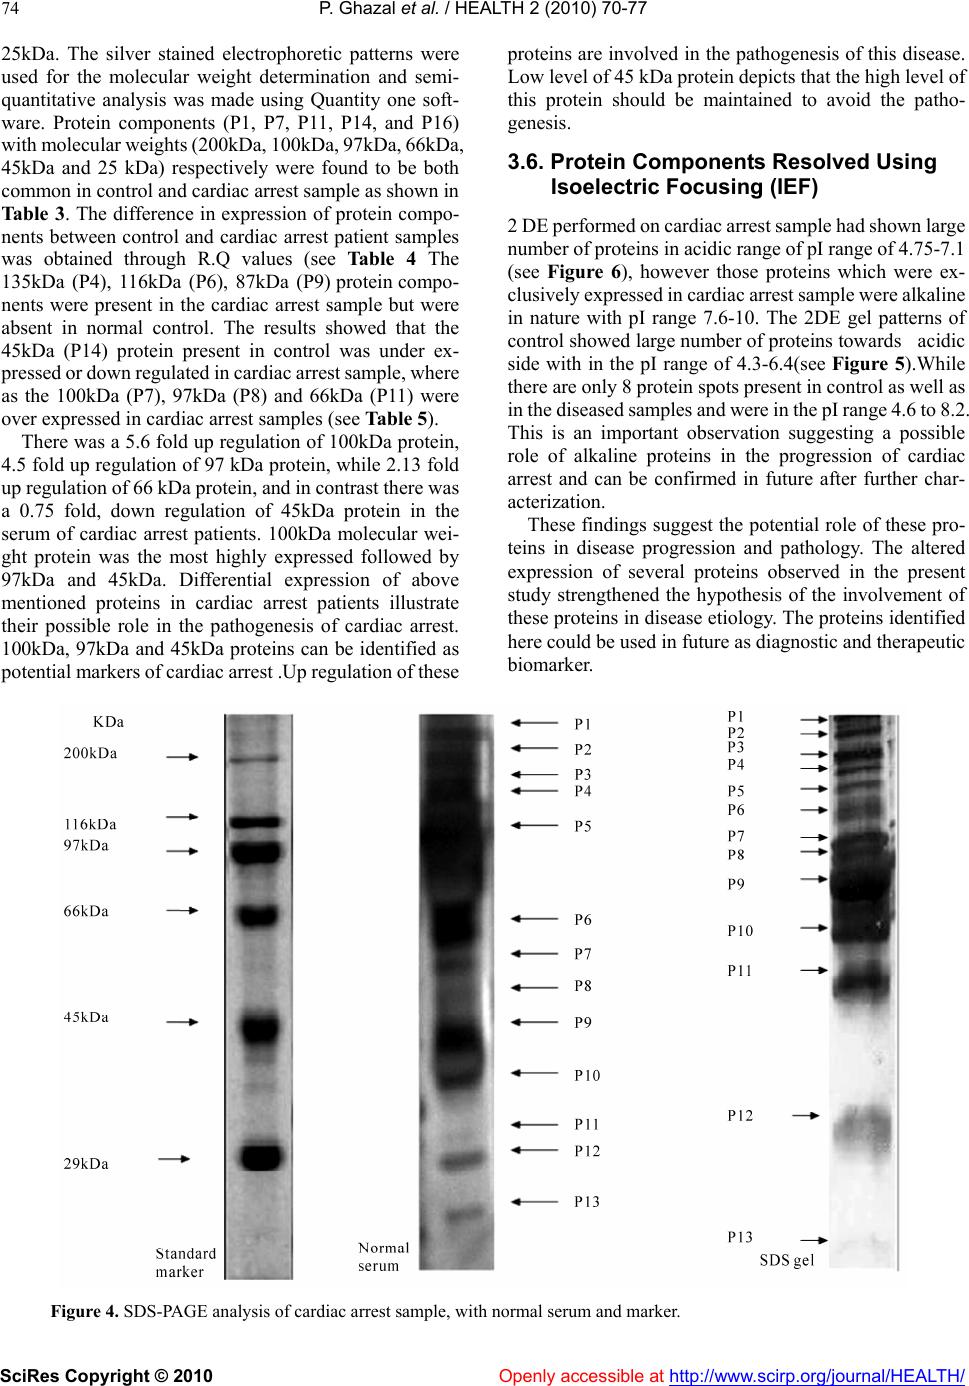 P. Ghazal et al. / HEALTH 2 (2010) 70-77 SciRes Copyright © 2010 http://www.scirp.org/journal/HEALTH/ 74 25kDa. The silver stained electrophoretic patterns were used for the molecular weight determination and semi- quantitative analysis was made using Quantity one soft- ware. Protein components (P1, P7, P11, P14, and P16) with molecular weights (200kDa, 100kDa, 97kDa, 66kDa, 45kDa and 25 kDa) respectively were found to be both common in control and cardiac arrest sample as shown in Table 3. The difference in expression of protein compo- nents between control and cardiac arrest patient samples was obtained through R.Q values (see Table 4 The 135kDa (P4), 116kDa (P6), 87kDa (P9) protein compo- nents were present in the cardiac arrest sample but were absent in normal control. The results showed that the 45kDa (P14) protein present in control was under ex- pressed or down regulated in cardiac arrest sample, where as the 100kDa (P7), 97kDa (P8) and 66kDa (P11) were over expressed in cardiac arrest samples (see Table 5). There was a 5.6 fold up regulation of 100kDa protein, 4.5 fold up regulation of 97 kDa protein, while 2.13 fold up regulation of 66 kDa protein, and in contrast there was a 0.75 fold, down regulation of 45kDa protein in the serum of cardiac arrest patients. 100kDa molecular wei- ght protein was the most highly expressed followed by 97kDa and 45kDa. Differential expression of above mentioned proteins in cardiac arrest patients illustrate their possible role in the pathogenesis of cardiac arrest. 100kDa, 97kDa and 45kDa proteins can be identified as potential markers of cardiac arrest .Up regulation of these proteins are involved in the pathogenesis of this disease. Low level of 45 kDa protein depicts that the high level of this protein should be maintained to avoid the patho- genesis. 3.6. Protein Components Resolved Using Isoelectric Focusing (IEF) 2 DE performed on cardiac arrest sample had shown large number of proteins in acidic range of pI range of 4.75-7.1 (see Figure 6), however those proteins which were ex- clusively expressed in cardiac arrest sample were alkaline in nature with pI range 7.6-10. The 2DE gel patterns of control showed large number of proteins towards acidic side with in the pI range of 4.3-6.4(see Figure 5).While there are only 8 protein spots present in control as well as in the diseased samples and were in the pI range 4.6 to 8.2. This is an important observation suggesting a possible role of alkaline proteins in the progression of cardiac arrest and can be confirmed in future after further char- acterization. These findings suggest the potential role of these pro- teins in disease progression and pathology. The altered expression of several proteins observed in the present study strengthened the hypothesis of the involvement of these proteins in disease etiology. The proteins identified here could be used in future as diagnostic and therapeutic biomarker. Figure 4. SDS-PAGE analysis of cardiac arrest sample, with normal serum and marker. Openly accessible at 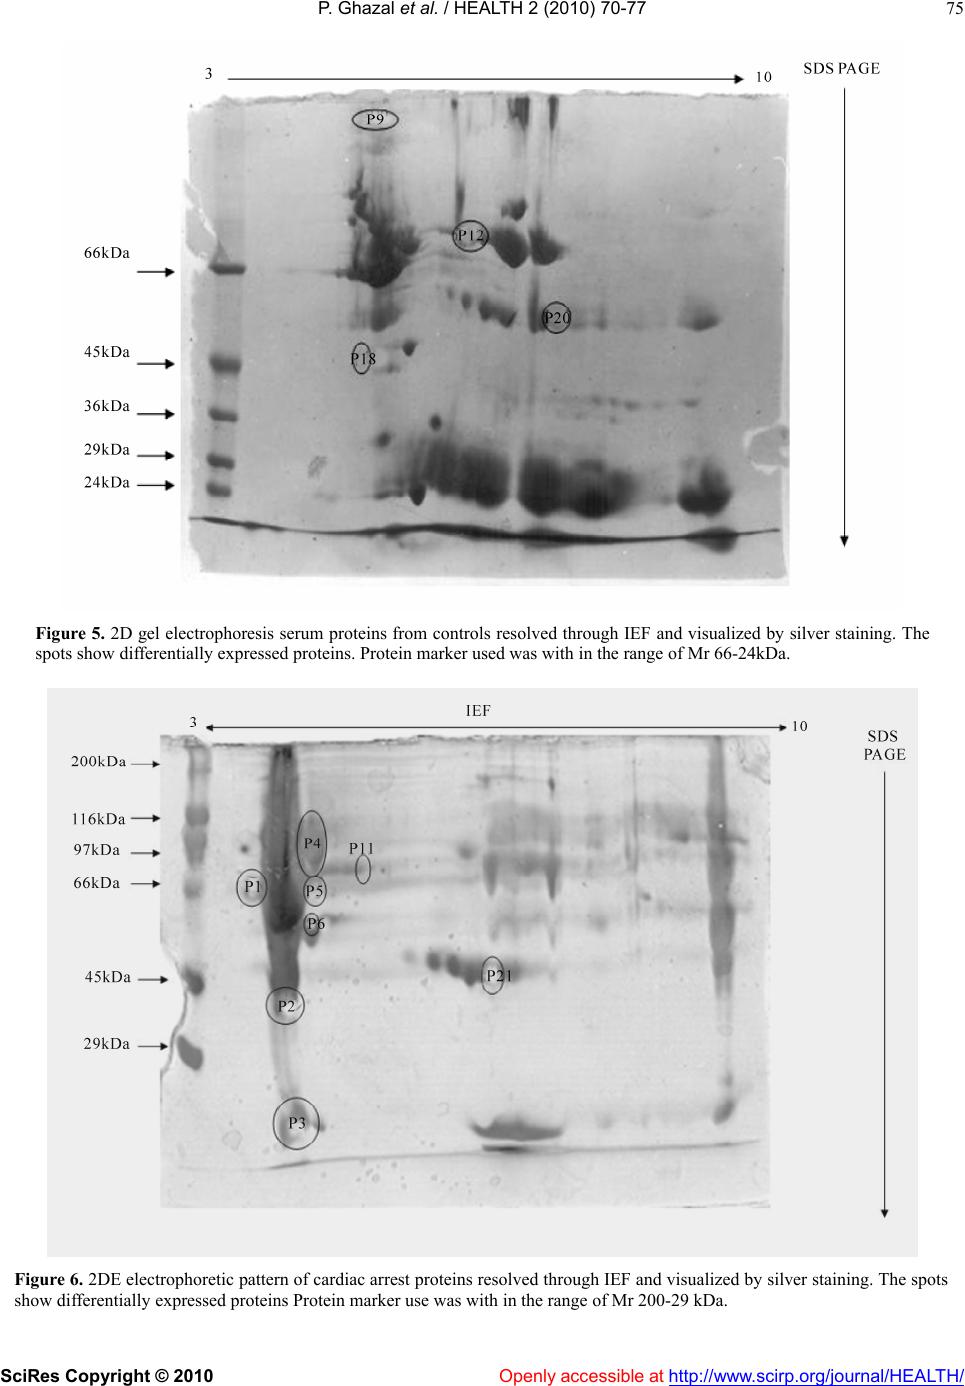 P. Ghazal et al. / HEALTH 2 (2010) 70-77 SciRes Copyright © 2010 Openly accessible at http://www.scirp.org/journal/HEALTH/ 75 Figure 5. 2D gel electrophoresis serum proteins from controls resolved through IEF and visualized by silver staining. The spots show differentially expressed proteins. Protein marker used was with in the range of Mr 66-24kDa. Figure 6. 2DE electrophoretic pattern of cardiac arrest proteins resolved through IEF and visualized by silver staining. The spots show differentially expressed proteins Protein marker use was with in the range of Mr 200-29 kDa. 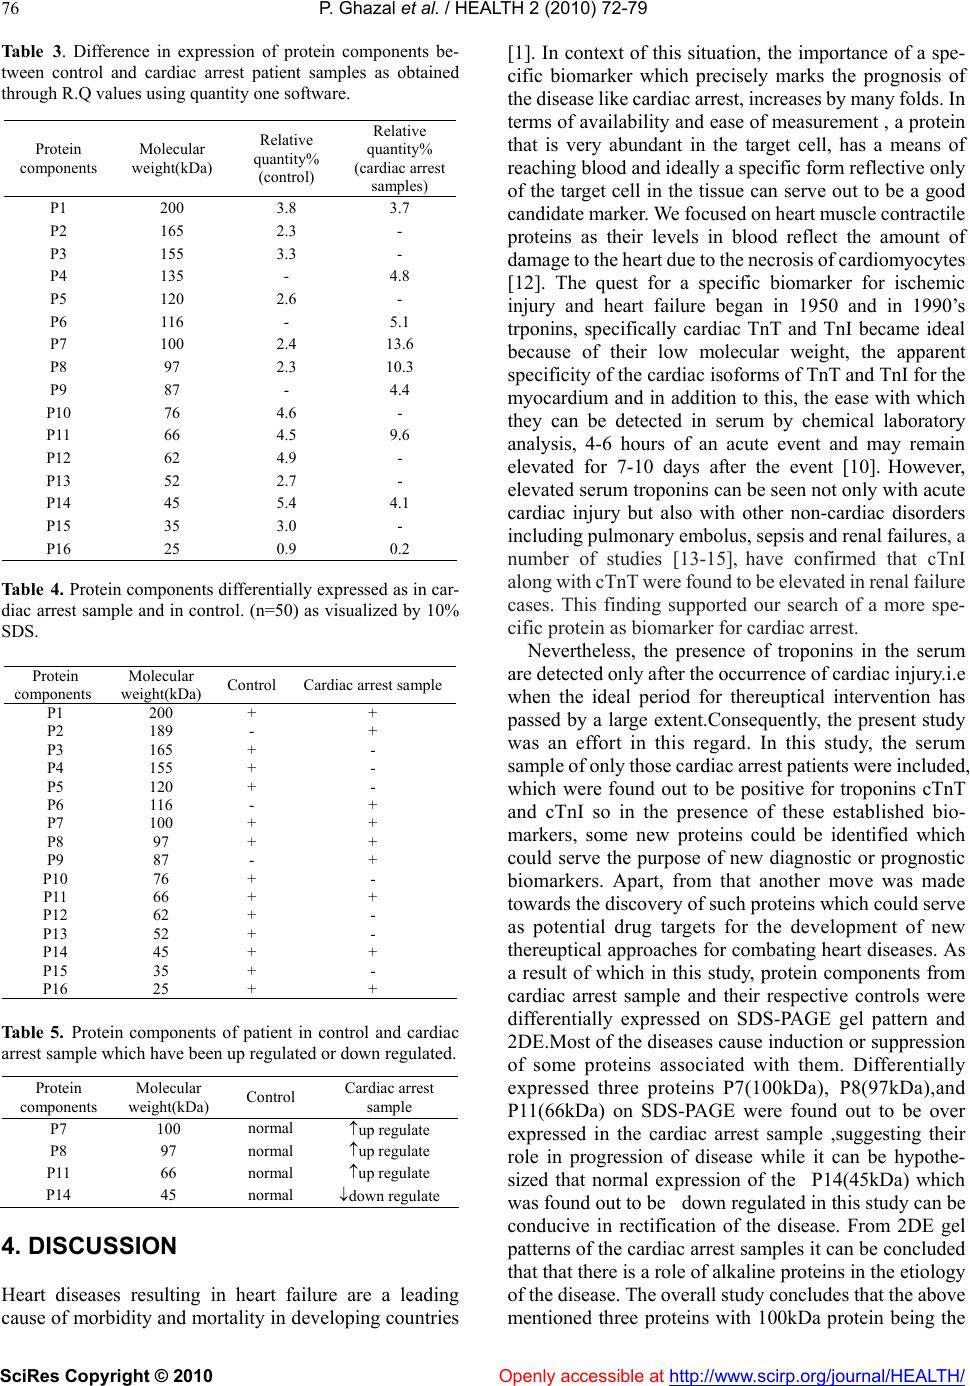 P. Ghazal et al. / HEALTH 2 (2010) 72-79 SciRes Copyright © 2010 Openly accessible at http://www.scirp.org/journal/HEALTH/ 76 Table 3. Difference in expression of protein components be- tween control and cardiac arrest patient samples as obtained through R.Q values using quantity one software. Protein components Molecular weight(kDa) Relative quantity% (control) Relative quantity% (cardiac arrest samples) P1 200 3.8 3.7 P2 165 2.3 - P3 155 3.3 - P4 135 - 4.8 P5 120 2.6 - P6 116 - 5.1 P7 100 2.4 13.6 P8 97 2.3 10.3 P9 87 - 4.4 P10 76 4.6 - P11 66 4.5 9.6 P12 62 4.9 - P13 52 2.7 - P14 45 5.4 4.1 P15 35 3.0 - P16 25 0.9 0.2 Table 4. Protein components differentially expressed as in car- diac arrest sample and in control. (n=50) as visualized by 10% SDS. Protein components Molecular weight(kDa) Control Cardiac arrest sample P1 200 + + P2 189 - + P3 165 + - P4 155 + - P5 120 + - P6 116 - + P7 100 + + P8 97 + + P9 87 - + P10 76 + - P11 66 + + P12 62 + - P13 52 + - P14 45 + + P15 35 + - P16 25 + + Table 5. Protein components of patient in control and cardiac arrest sample which have been up regulated or down regulated. Protein components Molecular weight(kDa) Control Cardiac arrest sample P7 100 normal up regulate P8 97 normal up regulate P11 66 normal up regulate P14 45 normal down regulate 4. DISCUSSION Heart diseases resulting in heart failure are a leading cause of morbidity and mortality in developing countries [1]. In context of this situation, the importance of a spe- cific biomarker which precisely marks the prognosis of the disease like cardiac arrest, increases by many folds. In terms of availability and ease of measurement , a protein that is very abundant in the target cell, has a means of reaching blood and ideally a specific form reflective only of the target cell in the tissue can serve out to be a good candidate marker. We focused on heart muscle contractile proteins as their levels in blood reflect the amount of damage to the heart due to the necrosis of cardiomyocytes [12]. The quest for a specific biomarker for ischemic injury and heart failure began in 1950 and in 1990’s trponins, specifically cardiac TnT and TnI became ideal because of their low molecular weight, the apparent specificity of the cardiac isoforms of TnT and TnI for the myocardium and in addition to this, the ease with which they can be detected in serum by chemical laboratory analysis, 4-6 hours of an acute event and may remain elevated for 7-10 days after the event [10]. However, elevated serum troponins can be seen not only with acute cardiac injury but also with other non-cardiac disorders including pulmonary embolus, sepsis and renal failures, a number of studies [13-15], have confirmed that cTnI along with cTnT were found to be elevated in renal failure cases. This finding supported our search of a more spe- cific protein as biomarker for cardiac arrest. Nevertheless, the presence of troponins in the serum are detected only after the occurrence of cardiac injury.i.e when the ideal period for thereuptical intervention has passed by a large extent.Consequently, the present study was an effort in this regard. In this study, the serum sample of only those cardiac arrest patients were included, which were found out to be positive for troponins cTnT and cTnI so in the presence of these established bio- markers, some new proteins could be identified which could serve the purpose of new diagnostic or prognostic biomarkers. Apart, from that another move was made towards the discovery of such proteins which could serve as potential drug targets for the development of new thereuptical approaches for combating heart diseases. As a result of which in this study, protein components from cardiac arrest sample and their respective controls were differentially expressed on SDS-PAGE gel pattern and 2DE.Most of the diseases cause induction or suppression of some proteins associated with them. Differentially expressed three proteins P7(100kDa), P8(97kDa),and P11(66kDa) on SDS-PAGE were found out to be over expressed in the cardiac arrest sample ,suggesting their role in progression of disease while it can be hypothe- sized that normal expression of the P14(45kDa) which was found out to be down regulated in this study can be conducive in rectification of the disease. From 2DE gel patterns of the cardiac arrest samples it can be concluded that that there is a role of alkaline proteins in the etiology of the disease. The overall study concludes that the above mentioned three proteins with 100kDa protein being the  P. Ghazal et al. / HEALTH 2 (2010) 70-77 SciRes Copyright © 2010 http://www.scirp.org/journal/HEALTH/Openly accessible at 77 Table 6. Difference in expression of protein components be- tween control and cardiac arrest patient samples as obtained through R.f values using graphical methods. The protein com- ponents were obtained through 2D gel electrophoresis. REFERENCES [1] White, M.Y., Edwards, A.V.G., Cordwell, J.S. and Van Eyk, J.E.M. (2008) Mitochondria: A mirror into cellular dysfunction in heart disease. Proteomics Clin. Appl, 2, 845-61. Protein component Molecular weight (kDa) pI (approx.) Control Cardiac arrest sample P1 168 7.6 - + P2 163 7.25 - + P3 156 8.2 - + P4 118 10 - + P5 112 8.7 - + P6 102 9.03 - + P7 99 7.68 + + P8 89.5 4.775 + - P9 85 4.9 - + P10 80 5.02 + + P11 76 7.1 + + P12 71 6.4 + - P13 67.4 5.715 + + P14 58 6.27 + + P15 54 6.61 + + P16 49 6.565 + + P17 43 4.6 + + P19 26 8.2 + + P20 22 4.3 + - P21 18 7.3 - + [2] Mehra, R. (2007) Global public health problem of sudden cardiac arrest. Journal of electrophysiology, 40,118-21. [3] Arking, D.E., Chugh, S.S., Chakarvarti, A., Spooner, P.M. (2004). Genomics in sudden cardiac death. Circ. Res.94:712-23. [4] Arab, S., Gramolini, A.O., Ping, P., et al. (2006). Car- diovascular Proteomics: Tools to Develop Novel Bio- markers and Potential Applications. Journal of the American College of Cardiology, 48, doi:10.1016/j. jacc.2006.06.063 [5] McGregor, E. and Dunn, M.J. (2006) Proteomics of the heart: unravelling disease. Circ. Res, 98, 309-21 [6] Macri, J. and Rapundalo, S.T. (2001) Application of Proteomics to the Study of Cardiovascular Biology. Trends in Cardiovascular Medicine 11, Pages 66-75 [7] Jäger, D., Jung Blut, P.R. and Müller-Werdan, U. (2002) Separation and identification of human heart proteins. Journal of Chromatography B: Analytical Technologies in the Biomedical and Life Sciences,771, 131-153 [8] Bahadori, M (2001) Proteomics in human disease: Awareness of new biomedical Opportunities. Arch Irn Med 3,144-149 [9] Mayr, M. and Van Eyk, J.E. (2008) Cardiovascular pro- teomics. Proteomics Clin. Appl, 2, 785-786. [10] Jin, W., Brown, A. T. and Murphy, A. M. (2008) Cardiac myofilaments: from proteome to pathophysiology. Pro- teomics Clin. Appl, 2, 800-810. most highly expressed and 45 kDa being suppressed can be identified as potential biomarkers and targets for thera- peutical intervention. The nature of these proteins can be elucidated by employing technique of mass spectrometry and tools of bioinformatics. [11] Charles, R.L. and Eaton, P. (2008) Redox signalling in cardiovascular disease. Proteomics Clin.Appl, 2, 823-36. [12] Ladenson, J.H.A. (2007) Personal history of markers of myocyte injury myocardial infarction. Clin Chim Acta, 381, 3-8. 5. CONCLUSIONS [13] Bhayana, V., Gougoulias, T, Cohoe, S. and Henderson, A.R. (1995) Discordance between results for serum tro- ponin T and troponin I in renal disease. Clin Chem, 41, 312–317. This study had been successful in detection of three pro- teins P7(100kDa), P8(97kDa) and P11(66kDa) on SDS- PAGE which were found out to be over expressed in the cardiac arrest sample, with 100 kDa protein being the most highly expressed and 45 kDa being down regulated and can be identified as potential biomarkers and targets for therapeutical intervention. In addition to that 2 DE had been conducive in proposing that proteins of alkaline nature play a major role in cardiac arrest pathology. [14] Collinson, P.O., Hadcocks, L, Foo, Y, Rosalki, S.B, et al (1998). Cardiac troponins in patients with renal dysfunc- tion. Ann Clin Biochem, 35, 380–386. [15] Apple, F.S, Murakami, M.M., Pearce, L.A. and Herzog, C.A. (2002) Predictive value of cardiac troponin I and T for subsequent death in end-stage renal disease. Circula- tion, 106, 2941–2945. |