Paper Menu >>
Journal Menu >>
 Vol.2, No.1, 32-37 (2010) doi:10.4236/health.2010.21006 SciRes Copyright © 2010 Openly accessible at http://www.scirp.org/journal/HEALTH/ Health Development of a high-throughput cell based 384-well influenza A quantification assay for interpandemic and highly pathogenic avian strains Melicia R. Gainey, Ann M. Wasko, Jennifer N. Garver, David J. Guistino, Eric M. Vela*, John E. Bigger Battelle Biomedical Research Center West Jefferson, OH 43162, USA; velae@battelle.org Received 25 November 2009; revised 1 December 2009; accepted 2 December 2009. ABSTRACT Influenza remains a world wide health threat, thus the need for a high-throughput and robust assay to quantify both seasonal and avian in- fluenza A strains. Therefore, a 384-well plate format was developed for the median tissue culture infectious dose assay (TCID50) utilizing the detection of nucleoprotein by an in situ en- zyme linked immunosorbent assay (ELISA) which was optimized for sensitivity in this assay. Highly pathogenic avian influenza, A/Vietnam/ 1203/04 (H5N1), and interpandemic strains, A/ New Caledonia/20/99 (H1N1) and A/Brisbane/ 10/07 (H3N2), were quantified using this high- throughput assay. Each 384-well plate can be used to analyze ten viral samples in quadrupli- cate, eight dilutions per sample, including all necessary assay controls. The results obtained from 384-well plates were comparable to tradi- tional 96-well plates and also demonstrate re- peatability, intermediate precision, and assay linearity. Further, the use of 384-well plates in- creased the throughput of sample analysis and the precision and accuracy of the resulting titer. Keywords: Avian Influenza; ELISA; High-Throughput Assay; Interpandemic Influenza A; TCID50 1. INTRODUCTION Interpandemic, or seasonal, influenza takes a toll on public health resources, economic productivity, and causes up to 500,000 deaths annually world-wide [1]. Highly pathogenic avian influenza (HPAI) strains cause heavy economic losses in countries dependent upon poultry revenues and have caused more than 250 deaths globally [2]. In addition, HPAI strains could potentially give rise to a pandemic. Given the economic and health implications of these viral strains, many new vaccines and therapeutics are being developed to counter this threat. In order to determine efficacy of these novel products, it is necessary to quantify antibody responses and influenza A viruses in various matrices, ideally in a high-throughput format. Currently, several high throu- ghput assays to detect influenza virus exist which utilize reverse transcription polymerase chain reaction (RT-PCR) alone [3], and coupled with flow cytometery [4] or utilize a latex turbidimetric immunoassay [5]. There are also a few high-throughput screening methods to determine putative antiviral compounds [6] and influenza antago- nists [7]. Although these methods are able to analyze many samples for the presence of influenza or screen potential therapeutics, these assays do not quantify in- fluenza virus. For high-throughput quantification, a reverse-phased high performance liquid chromatography has been used to enumerate the amount of hemagglutinin in several types of viral stocks [8], but does not provide an infectious titer. A branched DNA technology can be used for quantification of influenza A viruses, but this assay was developed for use as an antiviral assay [9] and not for viral quantitation. Median tissue culture infectious dose assays (TCID50 assay) utilizing Alamar blue in 96-well plates have also been described [10]. Analysis by this assay provides an infectious titer by indirect means; determining the metabolism of uninfected healthy cells instead of detecting the presence of viral infection. To date, 384-well plate assays have been described for the detection of influenza via RT-PCR [11] and for the screening of antivirals utilizing Flash plate technology [12] or cell based luminescence assays [13]. Thus, 384-well plates have not been harnessed to provide as- sessment of infectious titers of influenza viruses. As no world wide standard exists for the quantification of influenza viruses, the World Health Organization’s (WHO) Manual on Animal Influenza Diagnosis and Surveillance [14] was chosen as the basis for this work. The manual recommends that viral samples be analyzed  M. R. Gainey et al. / HEALTH 2 (2010) 32-37 SciRes Copyright © 2010 http://www.scirp.org/journal/HEALTH/Openly accessible at 33 in quadruplicate by the TCID50 assay in a 96-well mi- croplate format. These assays may be interpreted by the visual observation of cytopathic effect (CPE) or the de- tection of influenza nucleoprotein by an in situ ELISA. To increase the assay throughput and efficiency, a 384-well microplate assay with an ELISA readout was developed based on recommended WHO manual TCID50 procedures. Titration of HPAI and interpandemic influenza A viruses in a 384-well microplate was compared to the traditional 96-well format. Based on preliminary qualification data, the 384-well format measures accurate and precise titers with less variability and higher assay linearity than the 96-well plates, suggesting this method provides more reliable titer data. Further, the use of 384-well plates reduces the time and effort required for analysis to 24 minutes per sample, a reduction of 80%. This assay for- mat has also been adapted for micro-neutralization assays and is amenable for use with manual or robotic liquid handlers. 2. MATERIALS AND METHODS 2.1. Metabolic Assay 384-well plates were seeded with MDCK cells at 2.5 x 10⁵ or 3.0 x 10⁵ cells/mL and incubated overnight at 37°C and 5.0% CO2. A 5% (w/v) Tetrazolium salt, 3- [4,5- dimethylthiazol-2-yl]-2,5-diphenyltetrazolium bromide (MTT) solution was prepared in 1X phosphate buffered saline (PBS), added to each well and incubated 2 hr at 37°C. The reduced MTT was released from the cells by adding Solubilization Buffer (50% dimethyl formamide solution containing 20% w/v sodium dodecyl sulfate) and incubating for 2 hr at 37°C. The plates were read at 550 nm with a 690 nm reference. All subsequent experiments utilized a seeding density of 3.0 x 10⁵ cells/mL due to lower variability, which was analyzed by calculating the coefficient of variance according to the location on the plate. 2.2. Viruses and Cells Each viral strain was received from the Centers for Dis- ease Control (Atlanta, GA) and propagated in 8-10 day old specific-pathogen free chicken embryos (Charles River Franklin, CT) at 37°C for 24 hr for A/ Vietnam/ 1203/04, 37°C for 72 hr for A/New Caledonia/20/99, and 35°C for 48 hr for A/Brisbane/10/07. The harvested al- lantoic fluid was stored at ≤-70°C. Madin-Darby canine kidney (MDCK) cells (Salisbury lineage, Sigma St. Louis, MO), were maintained in complete Eagle’s minimal es- sential media (EMEM) containing 1% Penicillin- Strep- tomycin and 10% fetal bovine serum. MDCK plates seeded at 70% confluency were purchased from Diag- nostic Hybrids, Inc. (Athens, OH). 2.3. Viral Quantification Viral stocks were quantified by inoculating serial dilu- tions in quintuplicate on 96-well plates or quadruplicate on 384-well plates onto confluent MDCK monolayers. TPCK-treated trypsin at 2.0 μg/mL (US Biological Swampscott, MA) was added to the inoculation media for the interpandemic strains. Each plate contained cell cul- ture control (CC) wells containing inoculation media alone. The inoculated plates were incubated at 37°C and 5.0% CO2 in a humidified incubator for 20 ± 1 hr prior to fixation. 2.4. In Situ Influenza A Nucleoprotein ELISA The ELISA was performed as previously described [14] with the following noted changes. Plates were fixed by the addition of 1 ½ volumes of 80% cold acetone in water directly to the inoculum and incubated at room tempera- ture (RT) for 30 min. All subsequent incubations were increased from the recommended RT to 37°C in a hu- midified incubator to increase the sensitivity of the assay. For the primary incubation, an equal mixture of mouse anti-influenza A nucleoprotein monoclonal antibody clone MAB8257 and MAB8258 (Chemicon International; Bellirica, MA) was used. The ABTS Microwell Peroxi- dase Substrate System (Kirkegaard and Perry Laborato- ries, prepared according to manufacturer’s instructions) substrate and stop solution was used according to the manufacturer’s instructions. The plates were read at 405 nm with a 490 nm reference. The positive threshold was calculated as the average optical density (OD) of the CC wells plus two standard deviations. Each sample well was scored as positive for infection if the OD was above the positive threshold and negative for infection if the OD was less than or equal to the positive threshold. The me- dian infectious dose for all samples was calculated using the Spearman Kärber formula [15]. 3. RESULTS 3.1. Optimization of the 384-Well Plate To assess the suitability of 384-well plates for a cell- based infectivity assay, MDCK cells were seeded at two concentrations and the metabolic activity was determined by reduction of MTT. The metabolism of cells seeded in the outer wells was identical to the cells seeded in the inner wells (see Table 1). The variability was analyzed by calculating the coefficient of variance (CV) by location on the plate and found to be less than 13% for inner and outer wells as well as the entire plate. Therefore, 384-well plates were found suitable for this assay due to the low variability demonstrated between inner and outer wells. Further, seeding the plate at 3 x 10⁵ cells/mL provided less variability (CV < 8%, see Table 1). 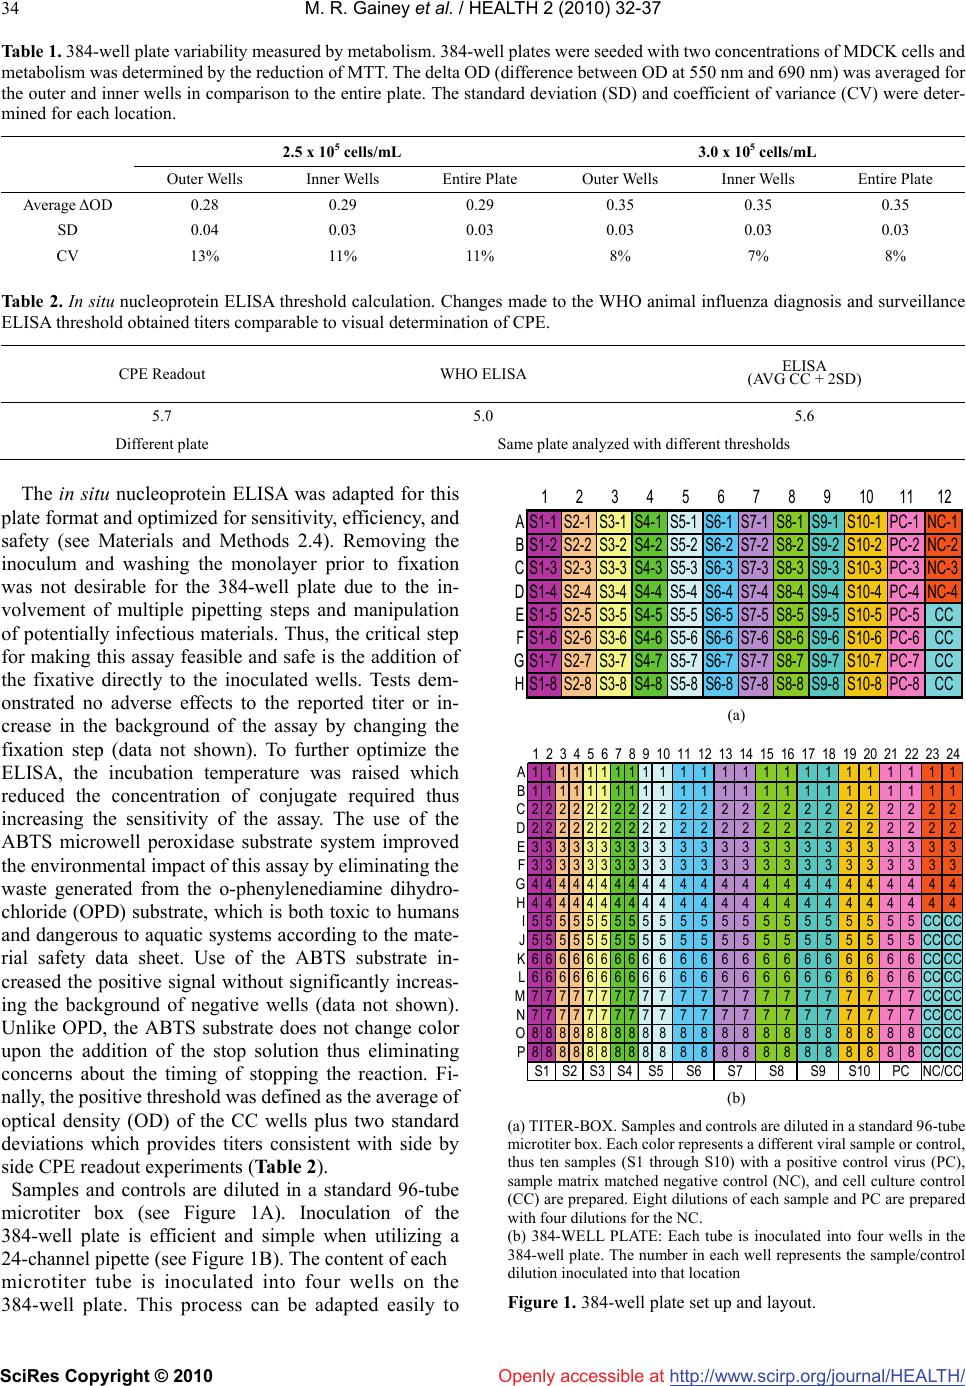 M. R. Gainey et al. / HEALTH 2 (2010) 32-37 SciRes Copyright © 2010 http://www.scirp.org/journal/HEALTH/ 34 Openly accessible at Table 1. 384-well plate variability measured by metabolism. 384-well plates were seeded with two concentrations of MDCK cells and metabolism was determined by the reduction of MTT. The delta OD (difference between OD at 550 nm and 690 nm) was averaged for the outer and inner wells in comparison to the entire plate. The standard deviation (SD) and coefficient of variance (CV) were deter- mined for each location. 2.5 x 10⁵ cells/mL 3.0 x 10⁵ cells/mL Outer Wells Inner Wells Entire Plate Outer Wells Inner Wells Entire Plate Average ΔOD 0.28 0.29 0.29 0.35 0.35 0.35 SD 0.04 0.03 0.03 0.03 0.03 0.03 CV 13% 11% 11% 8% 7% 8% Table 2. In situ nucleoprotein ELISA threshold calculation. Changes made to the WHO animal influenza diagnosis and surveillance ELISA threshold obtained titers comparable to visual determination of CPE. CPE Readout WHO ELISA ELISA (AVG CC + 2SD) 5.7 5.0 5.6 Different plate Same plate analyzed with different thresholds The in situ nucleoprotein ELISA was adapted for this plate format and optimized for sensitivity, efficiency, and safety (see Materials and Methods 2.4). Removing the inoculum and washing the monolayer prior to fixation was not desirable for the 384-well plate due to the in- volvement of multiple pipetting steps and manipulation of potentially infectious materials. Thus, the critical step for making this assay feasible and safe is the addition of the fixative directly to the inoculated wells. Tests dem- onstrated no adverse effects to the reported titer or in- crease in the background of the assay by changing the fixation step (data not shown). To further optimize the ELISA, the incubation temperature was raised which reduced the concentration of conjugate required thus increasing the sensitivity of the assay. The use of the ABTS microwell peroxidase substrate system improved the environmental impact of this assay by eliminating the waste generated from the o-phenylenediamine dihydro- chloride (OPD) substrate, which is both toxic to humans and dangerous to aquatic systems according to the mate- rial safety data sheet. Use of the ABTS substrate in- creased the positive signal without significantly increas- ing the background of negative wells (data not shown). Unlike OPD, the ABTS substrate does not change color upon the addition of the stop solution thus eliminating concerns about the timing of stopping the reaction. Fi- nally, the positive threshold was defined as the average of optical density (OD) of the CC wells plus two standard deviations which provides titers consistent with side by side CPE readout experiments (Table 2). Samples and controls are diluted in a standard 96-tube microtiter box (see Figure 1A). Inoculation of the 384-well plate is efficient and simple when utilizing a 24-channel pipette (see Figure 1B). The content of each microtiter tube is inoculated into four wells on the 384-well plate. This process can be adapted easily to 123456789101112 AS1-1S2-1S3-1S4-1S5-1S6-1S7-1S8-1S9-1S10-1PC-1NC-1 BS1-2S2-2S3-2S4-2S5-2S6-2S7-2S8-2S9-2S10-2PC-2NC-2 CS1-3S2-3S3-3S4-3S5-3S6-3S7-3S8-3S9-3S10-3PC-3NC-3 DS1-4S2-4S3-4S4-4S5-4S6-4S7-4S8-4S9-4S10-4PC-4NC-4 ES1-5S2-5S3-5S4-5S5-5S6-5S7-5S8-5S9-5S10-5PC-5 CC FS1-6S2-6S3-6S4-6S5-6S6-6S7-6S8-6S9-6S10-6PC-6 CC GS1-7S2-7S3-7S4-7S5-7S6-7S7-7S8-7S9-7S10-7PC-7 CC HS1-8S2-8S3-8S4-8S5-8S6-8S7-8S8-8S9-8S10-8PC-8 CC (a) 123456789101112131415161718192021222324 A1111111111 11 111 11 11 11 111 B1111111111 11 111 11 11 11 111 C2222222222 22 222 22 22 22 22 2 D2222222222 22 222 22 22 22 22 2 E3333333333 33 333 33 33 33 333 F3333333333 33 33 333 33 33 33 3 G44444444444 44 44 444 44 44 44 H4444444444 44 444 44 44 44 44 4 I5555555555 55 55 555 55 55 5CCCC J55555555555 55 55 555 55 55CCCC K6666666666 66 666 66 66 66 6CCCC L6666666666 66 66 666 66 66 6CCCC M7777777777 77 77 777 77 77 7CCCC N7777777777 77 777 77 77 77 7CCCC O88888888888 88 88 888 88 88CCCC P8888888888 88 888 88 88 88 8CCCC S9S10PC NC/CCS5S6S7S8S1 S2 S3 S4 (b) (a) TITER-BOX. Samples and controls are diluted in a standard 96-tube microtiter box. Each color represents a different viral sample or control, thus ten samples (S1 through S10) with a positive control virus (PC), sample matrix matched negative control (NC), and cell culture control (CC) are prepared. Eight dilutions of each sample and PC are prepared with four dilutions for the NC. (b) 384-WELL PLATE: Each tube is inoculated into four wells in the 384-well plate. The number in each well represents the sample/control dilution inoculated into that location Figure 1. 384-well plate set up and layout.  M. R. Gainey et al. / HEALTH 2 (2010) 32-37 SciRes Copyright © 2010 http://www.scirp.org/journal/HEALTH/Openly accessible at 35 Table 3. Intra-assay and inter-assay variability data for TCID50 assays. The repeatability (intra-assay variability) and intermediate precision (inter-assay variability) of each plate format was assessed for three strains of influenza A. Repeatability (Intra-Assay Variability)1 Intermediate Precision (Inter-Assay Variability)2 384-well 96-well 384-well 96-well Expected Titer3 A/Vietnam/1203/04 (H5N1) GEOMEAN SD CV 7.6 0.2 3% 7.8 0.2 3% 7.6 0.3 4% 7.9 0.4 5% 7.6 A/New Caledonia/20/99 (H1N1) GEOMEAN SD CV 4.7 0.0 0% 4.5 0.1 2% 4.9 0.3 6% 5.3 0.8 15% 5.1 A/Brisbane/10/07 (H3N2) GEOMEAN SD CV 6.3 0.1 2% 5.7 0.2 4% 6.3 0.2 3% 5.5 0.3 5% 6.1 1) Value reported is the geometric mean of the titer of three iterations by one operator on one testing day 2) Value reported is the geometric mean of the titer of three iterations by two operators on two testing days 3) The expected titer was based on prior titer certification on 96-well plates by two operators over three testing days using nine randomly selected aliquots of the stock robotic or manual liquid handler capabilities and has been used in our facility. 3.2. Assay Acceptability To compare the new 384-well plate with the traditional 96-well plate, the repeatability (intra-assay variability) and intermediate precision (inter-assay variability) were evaluated (see Table 3) for three influenza strains (H1N1, H3N2, and H5N1). Use of three different influenza vi- ruses demonstrated the robustness of the assay for quan- tification of any influenza A strain. The expected titer of each strain was established using 96-well plates prior to the experiment. To establish repeatability and precision, the mean titer obtained must be within 0.5 log of the ex- pected titer. The repeatability was assessed by three iterations of the same viral lot by one operator on a single day of testing. The geometric mean and standard deviation were calcu- lated for each plate type and viral strain (see Table 3). For the 384-well plates, all mean titers were within 0.4 log of the expected titer and were deemed repeatable for all three strains. Further, the standard deviations were less than or equal to 0.2 log TCID50/mL which demonstrates low variability regardless of the influenza strain quantified on the 384-well plate. The 96-well plates produced titers within 0.6 log of the expected titer, indicating less re- peatability with this plate format. The intermediate precision for each assay format and viral strain was assessed by three iterations of the same viral lot by two operators on two testing days. The geo- metric mean and standard deviation of the resulting 12 data points were calculated (see Table 3). All of the mean titers obtained with 384-well plates were within 0.2 log of the expected titer, thus establishing the intermediate pre- cision of the 384-well plate. The 96-well plate demon- strated less precision with all mean titers falling within 0.6 log of the expected titer. In addition, the standard devia- tions for the 384-well plates were calculated to be 0.3 log TCID50/mL or less, compared with 0.8 log TCID50/mL or less for 96-well plates, indicating lower variability be- tween assays, operators, and testing days for the high- throughput plate format. All strains performed as ex- pected in comparison to titers established using 96-well plates, thus verifying the robustness of the 384-well plate. The linearity of an assay measures the ability to obtain results proportional to the concentration of the sample. For each assay format, the linearity was assessed by pre- paring four serial dilutions of the viral stock. Each dilu- tion was then quantified in each plate type. The predicted titer for each dilution was calculated based on the dilution from the certified stock titer. The observed titer was plotted against the predicted titer and a linear regression analysis was performed (see Figure 2). For the purposes of this study, an r2 ≥ to 0.85 was considered linear. Al- though the 96-well plate for both the A/ Vietnam/1203/04 and A/New Caledonia/20/99 strains demonstrated linear- ity, r2 >0.96, the 384-well plate for both strains demon- strated greater linearity, r2 >0.99 which suggests the use of a 384-well plate format provides more reliable data. However, both 96-well and 384-well plates are expected to produce results proportional to the concentration of the sample quantified.  M. R. Gainey et al. / HEALTH 2 (2010) 32-37 SciRes Copyright © 2010 http://www.scirp.org/journal/HEALTH/ 36 Openly accessible at r2 = 0.9942 r2 = 0.9865 r2 = 0.9959 r2 = 0.9640 0.5 1 1.5 2 2.5 3 3.5 4 0.511.522.533.54 Predicted log Titer (TCID50/mL) Observed log Titer (TCID 50/mL) A/Vietnam/1203/04 384-wellA/Vietnam/1203/04 96-well A/New Caledonia/20/99 384-wellA/New Caledonia/20/99 96-well Four serial dilutions of each strain were prepared and then quantified in each assay format. The observed log titer was compared with the predicted titer for each dilution. The linear regression for each format was determined. An r2 >0.85 was considered linear for each assay format. Figure 2. Assay linearity for influenza A (H5N1 and H1N1). 3.3. Advantage of High-Throughput 384-Well Plate To compare efficiency of the new 384-well plate format with the standard 96-well plate, the average time required to analyze one sample in a TCID50 assay from seeding the plate to analysis of the data was determined. The average time for the 96-well assay (plates seeded in house) was 2 hr per sample from start to finish. For the most efficient 384-well assay, commercially available seeded plates were used, removing the need for cell culture mainte- nance. An additional advantage of these pre-seeded plates is that more assays can be conducted each week without the need of multiple cell lines being maintained for har- vest. The average time for the analysis of one sample on a pre-seeded 384-well plate was 0.4 hr. Thus, using pur- chased 384-well plate increases efficiency of the TCID50 assay by 80%, thereby reducing cost significantly. 4. DISCUSSION HPAI infections in animals cause economic losses in countries dependent on poultry revenues [16]. Further, HPAI and interpandemic (seasonal) influenza infections in humans burden public health resources [17]. A myriad of vaccines and therapeutics are under development; however, assays that test influenza virus titers and screen the efficacy of vaccines and therapeutics cannot be used to quantify influenza virus and those that do measure infectious virus, do so by indirect methods [9, 10]. The TCID50 assay directly quantifies infectious influenza A viruses by utilizing an in situ nucleoprotein ELISA that detects the influenza A nucleoprotein in infected mon- olayers [14]. Therefore, a 384-well plate TCID50 assay with an ELISA readout was developed and tested for robustness, accuracy, precision, and reliability. The time and effort required for sample testing was also deter- mined. For this study, two plate formats were examined: a traditional 96-well plate and a high throughput 384-well plate. To demonstrate the robustness of the assays, three influenza A strains were quantified: A/ Vietnam/1203/04 (H5N1), A/New Caledonia/20/99 (H1N1), and A/ Bri- sbane/10/07 (H3N2). All viral strains performed as ex- pected without modification of the procedure, demon- strating the robustness of the new 384-well plate format when compared with the traditional 96-well plate. Addi-  M. R. Gainey et al. / HEALTH 2 (2010) 32-37 SciRes Copyright © 2010 http://www.scirp.org/journal/HEALTH/Openly accessible at 37 tionally, each assay format was tested for intra- and in- ter-assay variability to ascertain the precision of the assay and for linearity to verify the overall performance of the plate format. Both 96-well and 384-well plate formats tested were found to be repeatable, precise, and linear. The 384-well plate appears to be more accurate, precise and linear than the traditional 96-well plate and demon- strated less overall variability. Further, the efficiency afforded by using purchased pre-seeded 384-well plates was substantial. The increase in efficiency greatly lowers the cost and time required to obtain an infectious titer for a variety of viral samples without sacrificing precision. The 384-well plate format with ELISA readout offers a high-throughput, more efficient alternative for the de- termination of infectious influenza A titers in compliance with WHO recommendations for the assay. The 384-well plate has also been adapted for automation via liquid handling, considerably increasing the throughput of sample analysis in order to determine the efficacy of novel vaccines and therapeutics. 5. ACKNOWLEDGEMENTS The authors would like to acknowledge Dr. Hank Lockman and Mr. Aaron Martin for their assistance in the production of this manuscript. In addition, the authors would like to thank Drs. Herb Bresler, Catherine Smith, and Carol Sabourin for providing their support and technical assistance. This work was funded through the Battelle Independent Research and Development Program. REFERENCES [1] (2009) Influenza statistics. Roche. [2] (2009) WHO confirmed human cases of avian influenza a (H5N1). World Health Organization Department Co- mmunicable Disease Surveillance and Response. [3] Tewari, D., Zellers, C., Acland, H. and Pedersen, J.C. (2007) Automated extraction of avian influenza virus for rapid detection using real-time RT-PCR. Journal of Clinical Virology, 40, 142-145. [4] Lee, W.-M., Grindle, K., Pappas, T., Marshall, D.J., Moser, M.J., Beaty, E.L., Shult, P.A., Prudent, J.R. and Gern, J.E. (2007) High-throughput, sensitive, and accu- rate multiplex PCR-microsphere flow cytometry system for large-scale comprehensive detection of respiratory viruses. Journal of Clinical Microbiology, 45, 2626-2634. [5] Nemoto, H., Komoriya, T. and Kohno, H. (2007) Devel- opment of latex turbidimetric immunoassay for rapid and sensitive detection of influenza virus. Rinsho Biseibutshu Jinsoku Shindan Kenkyukai Shi., 18, 117-126. [6] Severson, W. E., McDowell, M., Ananthan, S., Chung, D.H., Rasmussen, L., Sosa, M.I., White, E.L., Noah, J. and Jonsson, C.B. (10-1-2008) High-throughput screen- ing of a 100,000-compound library for inhibitors of in- fluenza a virus (H3N2). Journal of Biomolecular Screening, 13, 879-887. [7] Wang, S.Y., Su, C.Y., Lin, M., Huang, S.Y., Huang, W. I., Wang, C.C., Wu, Y.T., Cheng, T. J., Yu, H.M., Ren, C.T., Wu, C.Y., Wong, C.H. and Cheng, Y.S. (2-11-2009) HA-pseudotyped retroviral vectors for influenza an- tagonist screening. Journal of Biomolecular Screening, 1087-0571, 0833-0786. [8] Kapteyn, J.C., Porre, A.M., de Rond, E.J.P., Hessels, W.B., Tijms, M.A., Kessen, H., Slotboom, A.M.E., Oerlemans, M.A., Smit, D., van der Linden, J., Schoen, P. and Thus, J.L.G. (2-25-2009) HPLC-based quantification of haema- gglutinin in the production of egg- and MDCK cell- de- rived influenza virus seasonal and pandemic vaccines. Vaccine, 27, 1468-1477. [9] Wagaman, P.C., Leong, M.A. and Simmen, K.A. (2002) Development of a novel influenza a antiviral assay. Journal of Virological Methods, 105, 105-114. [10] Mo, C., Yamagata, R., Pan, A., Reddy, J., Hazari, N. and Duke, G. (2008) Development of a high-throughput Ala- mar blue assay for the determination of influenza virus infectious dose, serum antivirus neutralization titer and virus ca/ts phenotype. Journal of Virological Methods, 150, 63-69. [11] Aguero, M., San Miguel, E., Sanchez, A., Gomez-Tejedor, C. and Jimenez-Clavero, M. (2007) A fully automated procedure for the high-throughput detection of avian in- fluenza virus by real-time reverse transcriptionpoly- merase chain reaction. Avian Diseases, 51, 235-241. [12] Maroto, M., Fernandez, Y., Ortin, J., Pelaez, F. and Ca- bello, M.A. (8-1-2008) Development of an HTS assay for the search of anti-influenza agents targeting the interac- tion of viral RNA with the NS1 protein. Journal of Bio- molecular Screening, 13, 581-590. [13] Noah, J.W., Severson, W.D., Noah, L., Rasmussen, L., White, E.L. and Jonsson, C.B. (2007) A cell-based lumi- nescence assay is effective for high-throughput screening of potential influenza antivirals. Antiviral Research, 73, 50-59. [14] Cox, N., Webster, R. and Stohr, K. (2002) WHO manual on animal influenza diagnosis and surveillance. World Health Organization Department Communicable Disease Surveillance and Response. [15] Hamilton, M.A., Russo, R.C. and Thurston, R.V. (1977) Trimmed spearman-karber method for estimated median lethal concentration in toxicity bioassays. Environmental Science & Technology, 11, 714-719. [16] (2007) Food and Agriculture Organization of the United Nations (FAO) and World Organization for Animal Health (OIE). The Global Strategy for Prevention and Control of H5N1 Highly Pathogenic Avian Influenza1-39. [17] (2009) Financial impact of the Flu, http://www. flu- facts.com/impact/financial.aspx. |