Paper Menu >>
Journal Menu >>
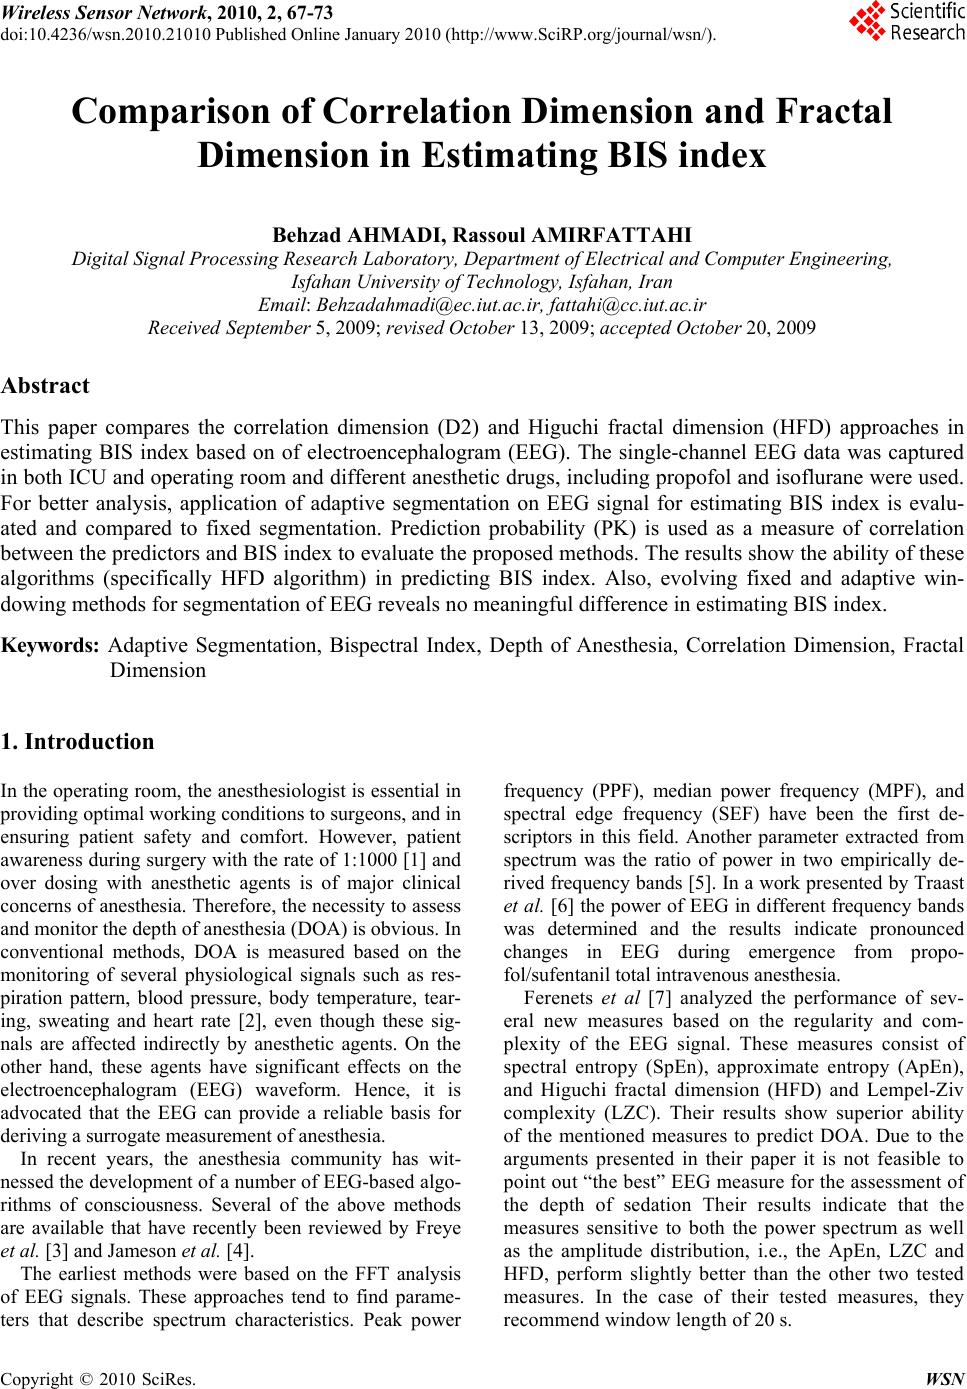 Wireless Sensor Network, 2010, 2, 67-73 doi:10.4236/wsn.2010.21010 anuary 2010 (http://www.SciRP.org/journal/wsn/). Copyright © 2010 SciRes. WSN Published Online J Comparison of Correlation Dimension and Fractal Dimension in Estimating BIS index Behzad AHMADI, Rassoul AMIRFATTAHI Digital Signal Processing Research Laboratory, Department of Electrical and Computer Engineering, Isfahan University of Technology, Isfahan, Iran Email: Behzadahmadi@ec.iut.ac.ir, fattahi@cc.iut.ac.ir Received September 5, 2009; revised October 13, 2009; accepted October 20, 2009 Abstract This paper compares the correlation dimension (D2) and Higuchi fractal dimension (HFD) approaches in estimating BIS index based on of electroencephalogram (EEG). The single-channel EEG data was captured in both ICU and operating room and different anesthetic drugs, including propofol and isoflurane were used. For better analysis, application of adaptive segmentation on EEG signal for estimating BIS index is evalu- ated and compared to fixed segmentation. Prediction probability (PK) is used as a measure of correlation between the predictors and BIS index to evaluate the proposed methods. The results show the ability of these algorithms (specifically HFD algorithm) in predicting BIS index. Also, evolving fixed and adaptive win- dowing methods for segmentation of EEG reveals no meaningful difference in estimating BIS index. Keywords: Adaptive Segmentation, Bispectral Index, Depth of Anesthesia, Correlation Dimension, Fractal Dimension 1. Introduction In the operating room, the anesthesiologist is essential in providing optimal working conditions to surgeons, and in ensuring patient safety and comfort. However, patient awareness during surgery with the rate of 1:1000 [1] and over dosing with anesthetic agents is of major clinical concerns of anesthesia. Therefore, the necessity to assess and monitor the depth of anesthesia (DOA) is obvious. In conventional methods, DOA is measured based on the monitoring of several physiological signals such as res- piration pattern, blood pressure, body temperature, tear- ing, sweating and heart rate [2], even though these sig- nals are affected indirectly by anesthetic agents. On the other hand, these agents have significant effects on the electroencephalogram (EEG) waveform. Hence, it is advocated that the EEG can provide a reliable basis for deriving a surrogate measurement of anesthesia. In recent years, the anesthesia community has wit- nessed the development of a number of EEG-based algo- rithms of consciousness. Several of the above methods are available that have recently been reviewed by Freye et al. [3] and Jameson et al. [4]. The earliest methods were based on the FFT analysis of EEG signals. These approaches tend to find parame- ters that describe spectrum characteristics. Peak power frequency (PPF), median power frequency (MPF), and spectral edge frequency (SEF) have been the first de- scriptors in this field. Another parameter extracted from spectrum was the ratio of power in two empirically de- rived frequency bands [5]. In a work presented by Traast et al. [6] the power of EEG in different frequency bands was determined and the results indicate pronounced changes in EEG during emergence from propo- fol/sufentanil total intravenous anesthesia. Ferenets et al [7] analyzed the performance of sev- eral new measures based on the regularity and com- plexity of the EEG signal. These measures consist of spectral entropy (SpEn), approximate entropy (ApEn), and Higuchi fractal dimension (HFD) and Lempel-Ziv complexity (LZC). Their results show superior ability of the mentioned measures to predict DOA. Due to the arguments presented in their paper it is not feasible to point out “the best” EEG measure for the assessment of the depth of sedation Their results indicate that the measures sensitive to both the power spectrum as well as the amplitude distribution, i.e., the ApEn, LZC and HFD, perform slightly better than the other two tested measures. In the case of their tested measures, they recommend window length of 20 s. 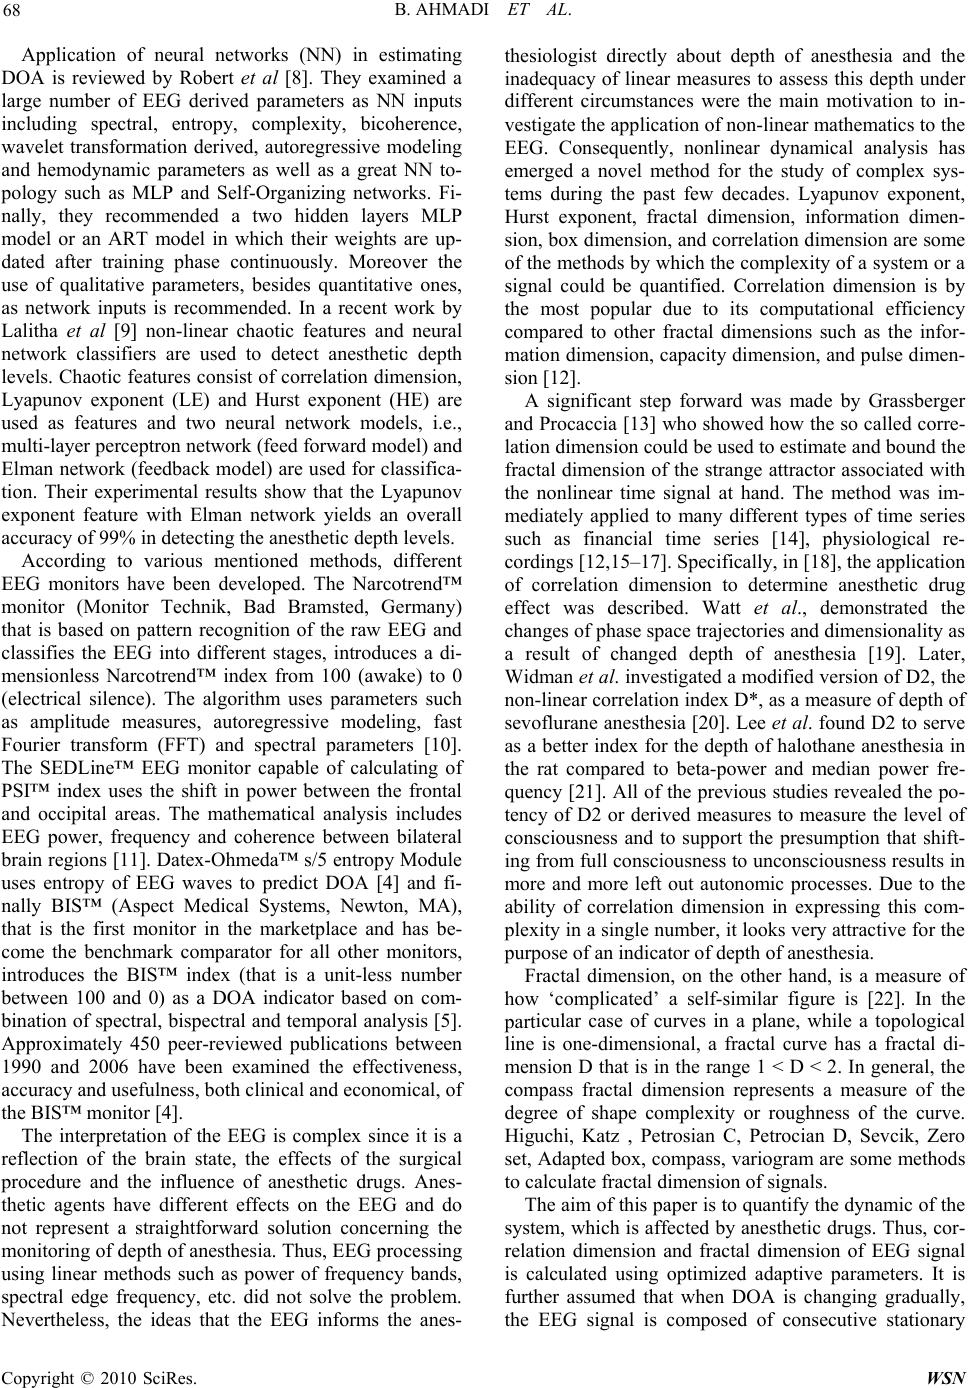 B. AHMADI ET AL. 68 Application of neural networks (NN) in estimating DOA is reviewed by Robert et al [8]. They examined a large number of EEG derived parameters as NN inputs including spectral, entropy, complexity, bicoherence, wavelet transformation derived, autoregressive modeling and hemodynamic parameters as well as a great NN to- pology such as MLP and Self-Organizing networks. Fi- nally, they recommended a two hidden layers MLP model or an ART model in which their weights are up- dated after training phase continuously. Moreover the use of qualitative parameters, besides quantitative ones, as network inputs is recommended. In a recent work by Lalitha et al [9] non-linear chaotic features and neural network classifiers are used to detect anesthetic depth levels. Chaotic features consist of correlation dimension, Lyapunov exponent (LE) and Hurst exponent (HE) are used as features and two neural network models, i.e., multi-layer perceptron network (feed forward model) and Elman network (feedback model) are used for classifica- tion. Their experimental results show that the Lyapunov exponent feature with Elman network yields an overall accuracy of 99% in detecting the anesthetic depth levels. According to various mentioned methods, different EEG monitors have been developed. The Narcotrend™ monitor (Monitor Technik, Bad Bramsted, Germany) that is based on pattern recognition of the raw EEG and classifies the EEG into different stages, introduces a di- mensionless Narcotrend™ index from 100 (awake) to 0 (electrical silence). The algorithm uses parameters such as amplitude measures, autoregressive modeling, fast Fourier transform (FFT) and spectral parameters [10]. The SEDLine™ EEG monitor capable of calculating of PSI™ index uses the shift in power between the frontal and occipital areas. The mathematical analysis includes EEG power, frequency and coherence between bilateral brain regions [11]. Datex-Ohmeda™ s/5 entropy Module uses entropy of EEG waves to predict DOA [4] and fi- nally BIS™ (Aspect Medical Systems, Newton, MA), that is the first monitor in the marketplace and has be- come the benchmark comparator for all other monitors, introduces the BIS™ index (that is a unit-less number between 100 and 0) as a DOA indicator based on com- bination of spectral, bispectral and temporal analysis [5]. Approximately 450 peer-reviewed publications between 1990 and 2006 have been examined the effectiveness, accuracy and usefulness, both clinical and economical, of the BIS™ monitor [4]. The interpretation of the EEG is complex since it is a reflection of the brain state, the effects of the surgical procedure and the influence of anesthetic drugs. Anes- thetic agents have different effects on the EEG and do not represent a straightforward solution concerning the monitoring of depth of anesthesia. Thus, EEG processing using linear methods such as power of frequency bands, spectral edge frequency, etc. did not solve the problem. Nevertheless, the ideas that the EEG informs the anes- thesiologist directly about depth of anesthesia and the inadequacy of linear measures to assess this depth under different circumstances were the main motivation to in- vestigate the application of non-linear mathematics to the EEG. Consequently, nonlinear dynamical analysis has emerged a novel method for the study of complex sys- tems during the past few decades. Lyapunov exponent, Hurst exponent, fractal dimension, information dimen- sion, box dimension, and correlation dimension are some of the methods by which the complexity of a system or a signal could be quantified. Correlation dimension is by the most popular due to its computational efficiency compared to other fractal dimensions such as the infor- mation dimension, capacity dimension, and pulse dimen- sion [12]. A significant step forward was made by Grassberger and Procaccia [13] who showed how the so called corre- lation dimension could be used to estimate and bound the fractal dimension of the strange attractor associated with the nonlinear time signal at hand. The method was im- mediately applied to many different types of time series such as financial time series [14], physiological re- cordings [12,15–17]. Specifically, in [18], the application of correlation dimension to determine anesthetic drug effect was described. Watt et al., demonstrated the changes of phase space trajectories and dimensionality as a result of changed depth of anesthesia [19]. Later, Widman et al. investigated a modified version of D2, the non-linear correlation index D*, as a measure of depth of sevoflurane anesthesia [20]. Lee et al. found D2 to serve as a better index for the depth of halothane anesthesia in the rat compared to beta-power and median power fre- quency [21]. All of the previous studies revealed the po- tency of D2 or derived measures to measure the level of consciousness and to support the presumption that shift- ing from full consciousness to unconsciousness results in more and more left out autonomic processes. Due to the ability of correlation dimension in expressing this com- plexity in a single number, it looks very attractive for the purpose of an indicator of depth of anesthesia. Fractal dimension, on the other hand, is a measure of how ‘complicated’ a self-similar figure is [22]. In the particular case of curves in a plane, while a topological line is one-dimensional, a fractal curve has a fractal di- mension D that is in the range 1 < D < 2. In general, the compass fractal dimension represents a measure of the degree of shape complexity or roughness of the curve. Higuchi, Katz , Petrosian C, Petrocian D, Sevcik, Zero set, Adapted box, compass, variogram are some methods to calculate fractal dimension of signals. The aim of this paper is to quantify the dynamic of the system, which is affected by anesthetic drugs. Thus, cor- relation dimension and fractal dimension of EEG signal is calculated using optimized adaptive parameters. It is further assumed that when DOA is changing gradually, the EEG signal is composed of consecutive stationary Copyright © 2010 SciRes. WSN 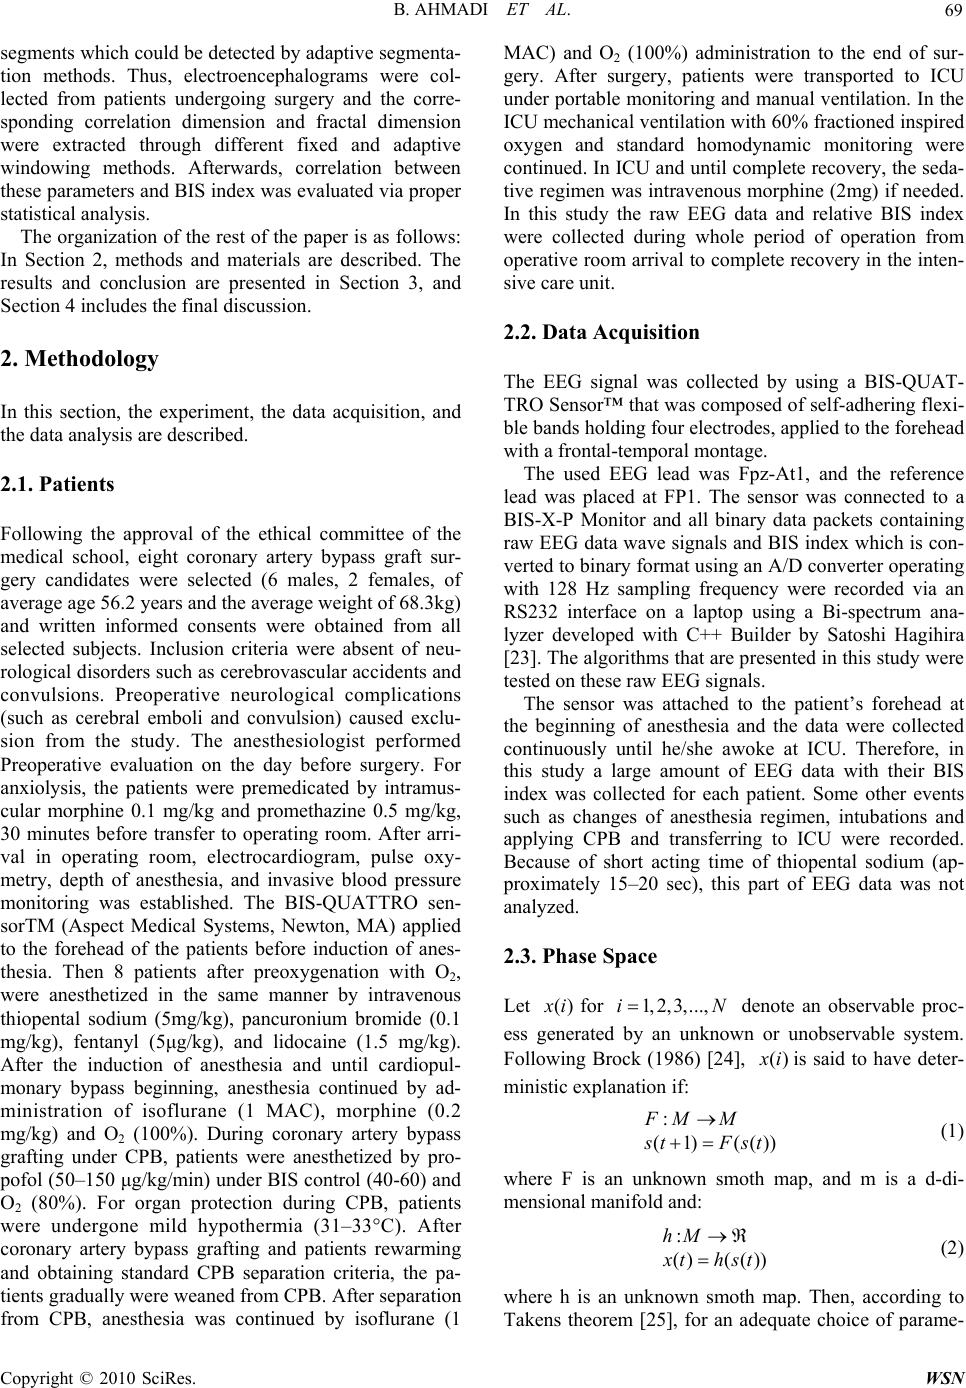 B. AHMADI ET AL. 69 N segments which could be detected by adaptive segmenta- tion methods. Thus, electroencephalograms were col- lected from patients undergoing surgery and the corre- sponding correlation dimension and fractal dimension were extracted through different fixed and adaptive windowing methods. Afterwards, correlation between these parameters and BIS index was evaluated via proper statistical analysis. The organization of the rest of the paper is as follows: In Section 2, methods and materials are described. The results and conclusion are presented in Section 3, and Section 4 includes the final discussion. 2. Methodology In this section, the experiment, the data acquisition, and the data analysis are described. 2.1. Patients Following the approval of the ethical committee of the medical school, eight coronary artery bypass graft sur- gery candidates were selected (6 males, 2 females, of average age 56.2 years and the average weight of 68.3kg) and written informed consents were obtained from all selected subjects. Inclusion criteria were absent of neu- rological disorders such as cerebrovascular accidents and convulsions. Preoperative neurological complications (such as cerebral emboli and convulsion) caused exclu- sion from the study. The anesthesiologist performed Preoperative evaluation on the day before surgery. For anxiolysis, the patients were premedicated by intramus- cular morphine 0.1 mg/kg and promethazine 0.5 mg/kg, 30 minutes before transfer to operating room. After arri- val in operating room, electrocardiogram, pulse oxy- metry, depth of anesthesia, and invasive blood pressure monitoring was established. The BIS-QUATTRO sen- sorTM (Aspect Medical Systems, Newton, MA) applied to the forehead of the patients before induction of anes- thesia. Then 8 patients after preoxygenation with O2, were anesthetized in the same manner by intravenous thiopental sodium (5mg/kg), pancuronium bromide (0.1 mg/kg), fentanyl (5μg/kg), and lidocaine (1.5 mg/kg). After the induction of anesthesia and until cardiopul- monary bypass beginning, anesthesia continued by ad- ministration of isoflurane (1 MAC), morphine (0.2 mg/kg) and O2 (100%). During coronary artery bypass grafting under CPB, patients were anesthetized by pro- pofol (50–150 μg/kg/min) under BIS control (40-60) and O2 (80%). For organ protection during CPB, patients were undergone mild hypothermia (31–33°C). After coronary artery bypass grafting and patients rewarming and obtaining standard CPB separation criteria, the pa- tients gradually were weaned from CPB. After separation from CPB, anesthesia was continued by isoflurane (1 MAC) and O2 (100%) administration to the end of sur- gery. After surgery, patients were transported to ICU under portable monitoring and manual ventilation. In the ICU mechanical ventilation with 60% fractioned inspired oxygen and standard homodynamic monitoring were continued. In ICU and until complete recovery, the seda- tive regimen was intravenous morphine (2mg) if needed. In this study the raw EEG data and relative BIS index were collected during whole period of operation from operative room arrival to complete recovery in the inten- sive care unit. 2.2. Data Acquisition The EEG signal was collected by using a BIS-QUAT- TRO Sensor™ that was composed of self-adhering flexi- ble bands holding four electrodes, applied to the forehead with a frontal-temporal montage. The used EEG lead was Fpz-At1, and the reference lead was placed at FP1. The sensor was connected to a BIS-X-P Monitor and all binary data packets containing raw EEG data wave signals and BIS index which is con- verted to binary format using an A/D converter operating with 128 Hz sampling frequency were recorded via an RS232 interface on a laptop using a Bi-spectrum ana- lyzer developed with C++ Builder by Satoshi Hagihira [23]. The algorithms that are presented in this study were tested on these raw EEG signals. The sensor was attached to the patient’s forehead at the beginning of anesthesia and the data were collected continuously until he/she awoke at ICU. Therefore, in this study a large amount of EEG data with their BIS index was collected for each patient. Some other events such as changes of anesthesia regimen, intubations and applying CPB and transferring to ICU were recorded. Because of short acting time of thiopental sodium (ap- proximately 15–20 sec), this part of EEG data was not analyzed. 2.3. Phase Space Let for )(ix 1, 2,3,...,i denote an observable proc- ess generated by an unknown or unobservable system. Following Brock (1986) [24], () x iis said to have deter- ministic explanation if: : (1) (()) F MM s tFst (1) where F is an unknown smoth map, and m is a d-di- mensional manifold and: : ()( ()) hM x thst (2) where h is an unknown smoth map. Then, according to Takens theorem [25], for an adequate choice of parame- C opyright © 2010 SciRes. WSN  B. AHMADI ET AL. 70 ters and m E , there exists a function such as: G 22 : ()(() mm EE G ) X tGX t (3) With ( )(( ),(),...,((1))) m Xixi xixiE (4) And being the embedding dimension and m E the time delay which is usually fixed to one. The above vec- tor is suggested by Taken for the extraction of informa- tion in the dynamics of chaos by reconstructing the phase space (state space) from time series of signal variable. Thus, if () x i m E is a deterministic time series, then for any pair of points ((and for an adequate choice of , there exist arbitrary small and ),())yiyj a0 so that: () ()(())(())ifyiyjathenGyiGy j (5) where ab being the distances between the vector and b. So, the images of close points are closed in the phase space. a 2.4. Correlation Dimension Estimation The Grassberger and Proccacia algorithm using Theiler method [26,27] considers spatial correlation between pairs of points on a reconstructed attractor. For an -dimensional phase space, the modified correlation integral is defined as m E ()Cr ))()(( ))(1( 2 )( 1 m i im ij jXiXr mm rC (6) where (1) m mN E m E is the number of embedded points in an -dimensional space, is the length of data series, and N r is the radius of sphere centered on or its box size, and )(ix () x is the heaviside step function as follows 1 () 0 x xx 0 0 (7) If scales like ()Cr () v Cr r (8) Then, is called the correlation dimension of the time series v x or equivalently the slop of the log-log plot of versus r. In this study correlation dimen- sion is calculated while is fixed to 10. (Cr) r The delay time is commonly determined by using the autocorrelation function (ACF) method (by finding the place where ACF first attains zeros or below a small value, e.g. 0.2 or 0.1), or mutual Information (MI) method (Fraser& Swinney 1986) [28] (by finding the place where MI first attains a minimum). In this study, is changed manually from one to ten. The result shows that smaller s would yield in better correlation between D2 and BIS index. So, it is fixed to one. Finally, is fixed to 10 and correlation dimension is calcu- lated. m E Consequently, EEG is divided in to fixed (20 seconds) segments and correlation dimension is calculated using the above parameters. The above parameter is named “fixed CD”. 2.5. Fractal Dimension Nonlinear methods that assess signal complexity matter if the signal itself is chaotic or deterministic. Consider the time series (1), (2),...,() x xxN, where is the total number of samples. The algorithm con- structs new time series as: Nk () {(),(,(2),...,(()/.)}) m X kxmx xmkxmNmkk mk where km ,...,2,1 . The length,, is calculated as: )(kLm 1 1 ()()(( 1)./ . Nm l i N kxm kxm ikk Nmk k i m L (9) Higuchi algorithm calculates fractal dimension of a time series directly in the time domain. It is based on a measure of length, of the curve. An average length is computed for all time series having the same scale , as the mean of the length for )(kL k 1, 2, k() m Lk 3,...,mk . If scale like, (Lk)() f D Lk f D k , then the curve is said to show fractal dimension [29]. The fractal dimension of EEG signal is calculated via above method while fixed windowing method (with the window length of 20 seconds) which is named “fixed HFD”. 2.6. Adaptive Segmentation of EEG Data It would be desirable to adapt the analysis window to changes in the given signal, allowing the window to be as long as possible while the signal remains stationary, and to start a new window at the exact instant when the signal changes its characteristics [30]. In order to per- form the described approach, two adaptive windowing Copyright © 2010 SciRes. WSN  B. AHMADI ET AL. 71 methods have been used, adaptive variance detection and ACF (Auto-Correlation Function) distance methods. In both approaches, a reference window is extracted at the beginning of each scan, and the given EEG signal is ob- served through a moving window. In each of the above algorithms, the performance of the reference window length L= 1 second has been evaluated. In adaptive variance detection method, a segment boundary is drawn when the variance of the moving window becomes m times greater or larger than the vari- ance of the reference window. By considering the changes of EEG variance, 7k and are tested and finally was considered better for applying the above procedure (The CD and HFD values obtained using this method of windowing are named “CD_var” and “HFD_var”, respectively). 10k 10k On the other hand, for implementing ACF distance method, let () Rk be the ACF of the reference window at the beginning of a new segmentation step, where k is the lag or delay. Let (, ) Tnk be the ACF of the test and sliding window positioned at time instant n. A normal- ized power distance dp (n) between ACFs is computed as: (,0) (0) () min {(,0),(0)} TR p TR n dn n (16) The condition where dp (n) becomes larger than a spe- cific threshold, ThP, is considered to represent a signifi- cant change in ACF, and used to mark a segment bound- ary [30]. Again, due to the variation of dp (n) values, three different ThPs (25000, 30000, and 35000), are tested and is used to evaluate the de- scribed approach (The CD and HFD values obtained using this method of windowing are named “CD_ACF” and “HFD_ACF”, respectively). 30000 P Th 2.7. Statistical Analysis The correlation between BIS index and the extracted sub-parameters was investigated with the model-inde- pendent Prediction Probability (Pk) [31]. As a nonpara- metric measure, the Pk is independent of scale units and does not require knowledge of underlying distributions or efforts to linearize or otherwise transform scales. A Pk value of 1 means that the predicting variables (“fixed HFD”, “HFD_var”, “HFD_ACF”, “fixed CD”, “CD_ var”, and “CD_ACF”) always predict the value of the predicted variable (e.g., BIS index) correctly. Pk value of 0.5 means that predictors predict no better than only by chance. The Pk values were calculated on a spreadsheet using the Excel 2003 software program and the PKMA CRO written by Warren Smith [31]. In the case of in- verse proportionality between indicator and indicated parameters, the actual measured Pk value is 1-Pk. An- other statistical analysis used in this study was ordinal logistic regression. This regression examines the rela- tionship between one or more predictors and an ordinal response. The index that determines the efficiency of this regression model is called “Concordant”, which shows the percentage of values predicted successfully with the model. Our results are presented in three different groups; during propofol and isoflurane anesthesia in operating room and in ICU under sedative regimens. Higuchi frac- tal dimension and correlation dimesion were calculated based on the algorithms described in the previous sec- tions and different parameters were obtained. Correlation between our extracted parameters (“fixed HFD”, “HFD_ var”, “HFD_ACF”, “fixed CD”, “CD_var”, and “CD_ ACF”) and BIS index were calculated via proper statis- tical analysis. In order to apply logistic regression analy- sis the total BIS index range was divided into six non-overlapping groups: 0-25, 25-40, 40-50, 50-60, 60-80, and 80-100.Then, the best model was determined to identify how good a predictor could predict the BIS level. 3. Results and Conclusions According to Figure 1, HFD reveals higher Pk values than CD in the ICU group. Thus, HFD could predict BIS index much more acceptable in comparison to CD. Also, it could be concluded from Figure 1 that application of adaptive segmentation could neither improve the estimation of BIS index based on HFD nor based on CD methods. According to Figure 2, HFD parameters (“fixed HFD”, “HFD_var”, and “HFD_ACF”) are more capable of es- timating BIS index than CD parameters (“fixed CD”, “CD_var”, and “CD_ACF”) in propofol group, due to their higher Pk values. Adaptive segmentation methods could improve the performance of CD in predicting BIS Prediction Probability (Pk) CD_ACFCD_varfixed CDHFD _ AC FHFD_varfix ed HF D 0.85 0.80 0.75 0.70 0.65 0.60 0.55 0.50 Figure 1. Comparison of different parameters in ICU group using Pk values. C opyright © 2010 SciRes. WSN  B. AHMADI ET AL. 72 Prediction Probability (Pk) CD_ACFCD_varfixed CDHFD _ACFHFD_v arfixed HFD 0.80 0.75 0.70 0.65 0.60 0.55 0.50 Figure 2. Comparison of different parameters in isoflurane group using Pk values . Pre dici t ion Probabili t y (P k ) CD_ACFCD_varfixed CDHFD_AC FHF D_varfixed HFD 0.72 0.69 0.66 0.63 0.60 Figure 3. Comparison of different parameters in propofol group using Pk values. index, especially using variance method. Of course this is not true for none of the remaining parameters. Based on Figure 3, HFD parameters (“fixed HFD”, “HFD_var”, and “HFD_ACF”) are approximately as capable as CD parameters (“fixed CD”, “CD_var”, and “CD_ACF”) in estimating BIS index in isoflurane group. Among different extracted parameters in this group, “CD_var” could predict BIS index better than other parameters. Although adaptive segmentation methods couldn’t improve the performance of CD in predicting BIS index, they are able to improve estimating of BIS index based on correlation dimension calculation. 4. Discussions In this study, raw EEG signals with relative BIS index of 8 patients undergoing coronary artery bypass graft sur- gery have been acquired. Besides, a method based on Higuchi fractal dimension, correlation dimension and adaptive segmentation is proposed for estimating BIS index. In order to investigate the capability of the ex- tracted parameters in predicting BIS index, appropriate statistical analyses were used in three different groups. Due to the fact that HFD and CD are capable of quan- tifying signals and systems complexity, high Pk values were obtained while using these parameters as measures of DOA. Of course, adaptive segmentation methods were not able to improve this process, except when CD was computed using variance method in isoflurane and pro- pofol groups, which seems a little bit unusual due to the ability of adaotive segmentation methos in tracking sig- nal changes. The main result was the superiority of vari- ous HFD parameters to those of CDs in predicting the BIS index in most of the groups and methods which is evidenced by the high correlation of those parameters with BIS index. In other words, Higuchi fractal dimen- sion is more capable than correlation dimension in esti- mating BIS index. Furthermore, in order to improve the accuracy of the depth of anesthesia estimation, comparison against seda- tion scales (such as OAA/S) and drug levels is needed. The reason is that BIS is not equal to depth of anesthesia but needs to be validated for DOA assessment itself. The work reported is preliminary. Although the results are significant, wide patient population is necessary for better evaluation. Therefore, obtained claims and out- comes should be confirmed by working on a larger group of patients and drugs and through various surgeries. To sum up, the approaches proposed in this study based on the application of adaptive algorithms, including ACF and variance methods for segmentation, fractal dimen- sion and correlation dimension (and mainly fractal di- mension) were sensible and meaningful in estimating BIS index. 5. References [1] J. G. Jones, “Perception and memory during general an- esthesia,” British Journal of Anaesthesia, No. 73, pp. 31–37, 1994. [2] R. D. Miller, “Miller’s Anesthesia,” Sixth Edition, El- sevier Churchill Livingstone, pp. 1227–1264, 2005. [3] E. Freye and J. V. Levy, “Cerebral monitoring in the operating room and the intensive care unit: An introduc- tory for the clinician and a guide for the novice wanting to open a window to the brain,” Part I: The electroen- cephalogram, Journal of Clinical Monitoring and Com- puting, No. 19, pp. 1–76, 2005. [4] L. C. Jameson and T. B. Sloan, “Using EEG to monitor anesthesia drug effects during surgery,” Journal of Clini- cal Monitoring and Computing, No. 20, pp. 445–472, 2006. [5] I. J. Rampil, “A primer for EEG signal processing in anesthesia,” Anesthesiology, No. 89, pp. 980–1002, 1998. [6] H. S. Traast and C. J. Kalkman, “Electroencephalo- graphic Characteristics of emergence from propofol/ sufentanil total intravenous anesthesia,” Anesthesia and Copyright © 2010 SciRes. WSN  B. AHMADI ET AL. Copyright © 2010 SciRes. WSN 73 Analgesia, No. 81, pp. 366–371, 1995. [7] R. Ferenets, T. Lipping, A. Anier, V. Jäntti, S. Melto, and S. Hovilehto, “Comparison of entropy and complexity measures for the assessment of depth of sedation,” IEEE Transactions on Biomedical Engineering, Vol. 53, No. 6, pp. 1067–1077, 2006. [8] C. Robert, P. Karasinski, C. D. Arreto, and J. F. Gaudy, “Monitoring anesthesia using neural networks: A sur- vey,” Journal of Clinical Monitoring and Computing, No. 17, pp. 259–267, 2002. [9] V. Lalitha and C. Eswaran, “Automated detection of an- esthetic depth levels using chaotic features with artificial neural networks,” Journal of Medical Systems, No. 31, pp. 445–452, 2007. [10] R. Bender, B. Schultz, and U. Grouven, “Classification of EEG signals into general stages of anesthesia in real time using autoregressive models,” Conference Proceedings of the 16th Annual Conference of the Gesellschaft fur Klas- sifikatione, University of Dortmund, pp. 443–452, April 1–3, 1992. [11] D. R. Drover, H. J. Lemmens, E. T. Pierce, G. Plourde, G. Loyd, E. Ornstein, L. S. Prichep, R. J. Chabot, and L. Gugino, “Patient state index: Titration of delivery and recovery from propofol, alfentanil, and nitrous oxide an- esthesia,” Anesthesiology, No. 97, pp. 82–89, 2002. [12] B. J. West, “Fractal physiology and chaos in medicine,” World Scientific, Singapore, Studies of Nonlinear Phe- nomena in Life Sciences, Vol. 1, 1990. [13] P. Grassberger and I. Procaccia, “Characterization of strange attractors,” Physical Review Letters, No. 50, pp. 346–349, 1983. [14] D. Hsieh, “Chaos and nonlinear dynamics: Applications to financial markets,” Journal of Finance, No. 46, pp. 1839–1877, 1991. [15] J. Ulbikas and A. Cenys, “Nonlinear dynamics methods in EEG investigations,” Advances in Synergetics, Belarusian State University Press, Minsk, Vol. 1, pp. 110–120, 1994. [16] I. M. Irurzun, P. Bergero, M. C. Cordero, M. M. Defeo, J. L. Vicente, and E. E. Mola, “Non-linear properties of R-R distributions as a measure of heart rate variability,” Chaos Solitons and Fractal, No. 16, pp. 699–708, 2003. [17] P. Pascolo, F. Barazza, and R. Carniel, “Considerations on the application of the chaos paradigm to describe the postural sway,” Chaos Solitons and Fractal, No. 27, pp. 1339–1346, 2006. [18] G. Mayer-Kress, S. P. layne, S. H. Koslow, A. J. Mandell, and M. F. shlesinger, “Perspectives in biomedical dynam- ics and theoretical medicine,” Annals of the New York Academy of Sciences, New York, USA, pp. 62–87, 1987. [19] R. C. Watt and S. R. Hameroff, “Phase space electroe- ncephalography (EEG): A new mode of intraoperative EEG analysis,” Journal of Clinical Monitoring and Com- putting, No. 5, pp. 3–13, 1988. [20] G. Widman, T. Schreiber, B. Rehberg, A. Hoerof, and C. E. Elger, “Quantification of depth of anesthesia by nonlinear time series analysis of brain electrical activity,” Physical Review E, No. 62, pp. 4898–4903, 2000. [21] M. G. Lee, E. J. Park, J. M. Choi, and M. H. Yoon, “Elec- troencephalographic correlation dimension changes with depth of halothane,” Korean Journal of Physiology and Pharmacology, No. 3, pp. 491–499, 1999. [22] R. Bender, B. Schultz, and U. Grouven, “Classification of EEG signals into general stages of anesthesia in real time using autoregressive models,” Conference Proceedings of the 16th Annual Conference of the Gesellschaft fur Klas- sifikatione, University of Dortmund, 1992 [23] S. Hagihira, M. Takashina, T. Mori, T. Mashimo, and I. Yoshiya, “Practical issues in bispectral analysis of elec- troencephalographic signals,” Anesthesia and Analgesia, Vol. 93, pp. 966–970, 2001. [24] W. A. Brock, “Distiguishing random and determining the minimum embededding dimension of scalar time series,” Physica D, No. 110, pp. 43–50, 1986. [25] F. Takens, “Detecting strange attractors in fluid turbu- lence,” In Rand D. A., Young L. S. (Eds), Dynamical System and Turbulence, Lecture Notes in Mathematics, Springer Verlag, Berlin, pp. 366–381, 1981. [26] J. Theiler, “Efficient algorithm for etimating the correla- tion dimension from a set of discrete point,” Physical Re- view A, Vol. 36, No. 9, pp. 4456–4462. [27] J. Theiler, “Spurious dimension from correlation algo- rithms applied to limited time series data,” Physical Re- view A, Vol. 34, No. 3, pp. 2427–2432. [28] A. M. Fraser, et al., “Independent coordinate for strange attractors from mutual information,” Physical Review, 1986. [29] C. D. Cutler, “Some results on the behavior and estima- tion of fractal dimension of distribuations on attractors,” Journal of Statistical Physics, Vol. 62, No. 3–4, pp. 651, 1991. [30] R. M. Rangayyan, “Biomedical signal analysis: A case- study approach,” IEEE Press, NJ, pp. 405–416, 2001. [31] W. D. Smith, R. C. Dutton, and N. T. Smith, “Measuring the performance of anesthetic depth indicators,” Anesthe- siology, Vol. 84, No. 1, pp. 38–51, 1996. |