Paper Menu >>
Journal Menu >>
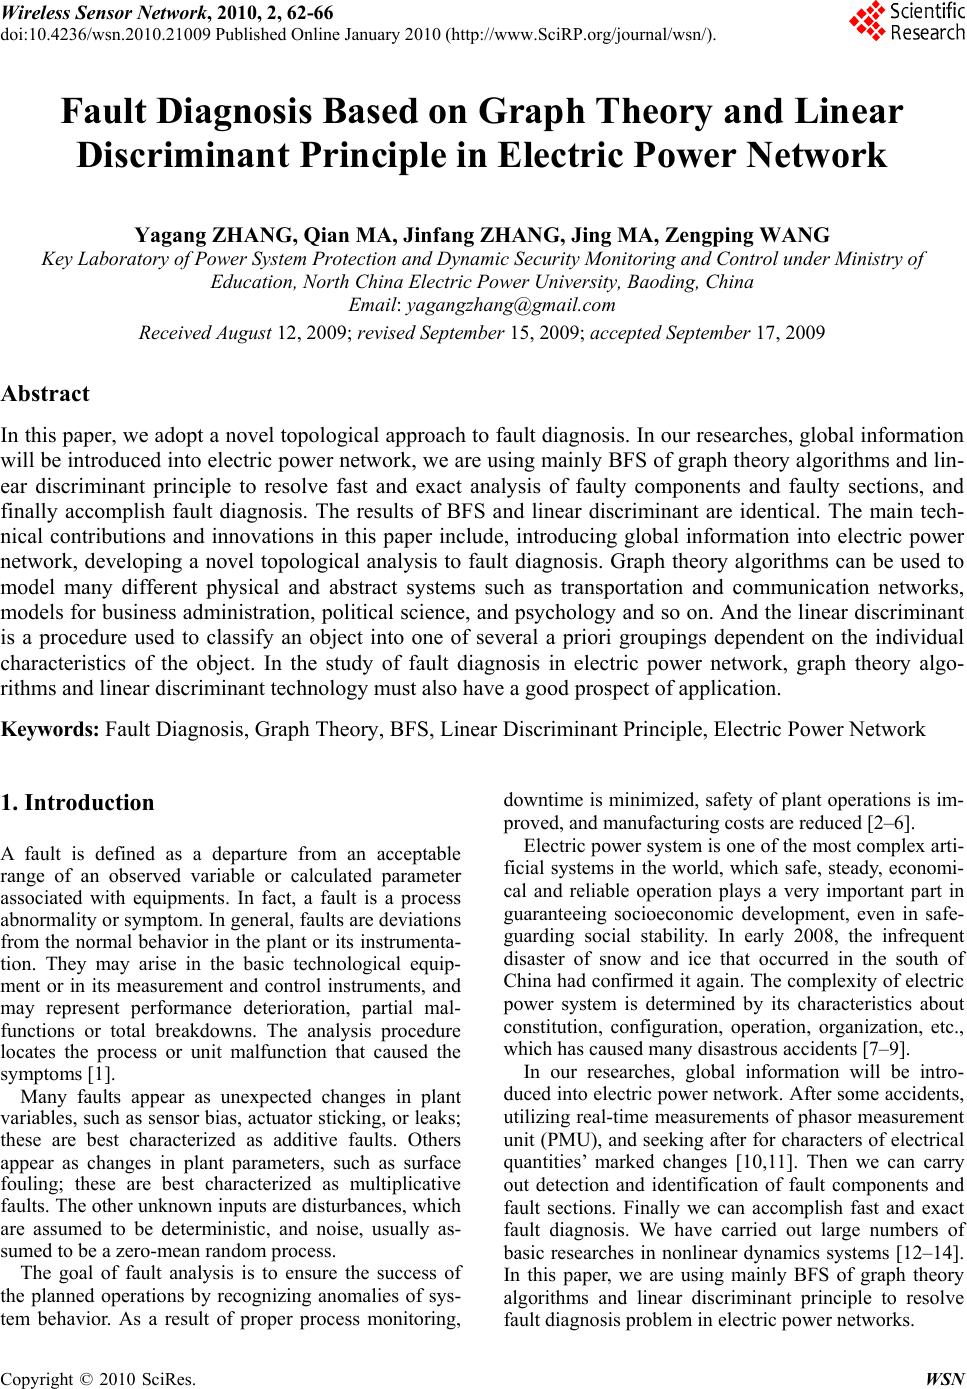 Wireless Sensor Network, 2010, 2, 62-66 doi:10.4236/wsn.2010.21009 anuary 2010 (http://www.SciRP.org/journal/wsn/). Copyright © 2010 SciRes. WSN Published Online J Fault Diagnosis Based on Graph Theory and Linear Discriminant Principle in Electric Power Network Yagang ZHANG, Qian MA, Jinfang ZHANG, Jing MA, Zengping WANG Key Laboratory of Power System Protection and Dynamic Security Monitoring and Control under Ministry of Education, North China Electric Power University, Baoding, China Email: yagangzhang@gmail.com Received August 12, 2009; revised S eptember 15, 2009; accepted Septem b e r 17, 2009 Abstract In this paper, we adopt a novel topological approach to fault diagnosis. In our researches, global information will be introduced into electric power network, we are using mainly BFS of graph theory algorithms and lin- ear discriminant principle to resolve fast and exact analysis of faulty components and faulty sections, and finally accomplish fault diagnosis. The results of BFS and linear discriminant are identical. The main tech- nical contributions and innovations in this paper include, introducing global information into electric power network, developing a novel topological analysis to fault diagnosis. Graph theory algorithms can be used to model many different physical and abstract systems such as transportation and communication networks, models for business administration, political science, and psychology and so on. And the linear discriminant is a procedure used to classify an object into one of several a priori groupings dependent on the individual characteristics of the object. In the study of fault diagnosis in electric power network, graph theory algo- rithms and linear discriminant technology must also have a good prospect of application. Keywords: Fault Diagnosis, Graph Theory, BFS, Linear Discriminant Principle, Electric Power Network 1. Introduction A fault is defined as a departure from an acceptable range of an observed variable or calculated parameter associated with equipments. In fact, a fault is a process abnormality or symptom. In general, faults are deviations from the normal behavior in the plant or its instrumenta- tion. They may arise in the basic technological equip- ment or in its measurement and control instruments, and may represent performance deterioration, partial mal- functions or total breakdowns. The analysis procedure locates the process or unit malfunction that caused the symptoms [1]. Many faults appear as unexpected changes in plant variables, such as sensor bias, actuator sticking, or leaks; these are best characterized as additive faults. Others appear as changes in plant parameters, such as surface fouling; these are best characterized as multiplicative faults. The other unknown inputs are disturbances, which are assumed to be deterministic, and noise, usually as- sumed to be a zero-mean random process. The goal of fault analysis is to ensure the success of the planned operations by recognizing anomalies of sys- tem behavior. As a result of proper process monitoring, downtime is minimized, safety of plant operations is im- proved, and manufacturing costs are reduced [2–6]. Electric power system is one of the most complex arti- ficial systems in the world, which safe, steady, economi- cal and reliable operation plays a very important part in guaranteeing socioeconomic development, even in safe- guarding social stability. In early 2008, the infrequent disaster of snow and ice that occurred in the south of China had confirmed it again. The complexity of electric power system is determined by its characteristics about constitution, configuration, operation, organization, etc., which has caused many disastrous accidents [7–9]. In our researches, global information will be intro- duced into electric power network. After some accidents, utilizing real-time measurements of phasor measurement unit (PMU), and seeking after for characters of electrical quantities’ marked changes [10,11]. Then we can carry out detection and identification of fault components and fault sections. Finally we can accomplish fast and exact fault diagnosis. We have carried out large numbers of basic researches in nonlinear dynamics systems [12–14]. In this paper, we are using mainly BFS of graph theory algorithms and linear discriminant principle to resolve fault diagnosis problem in electric power networks. 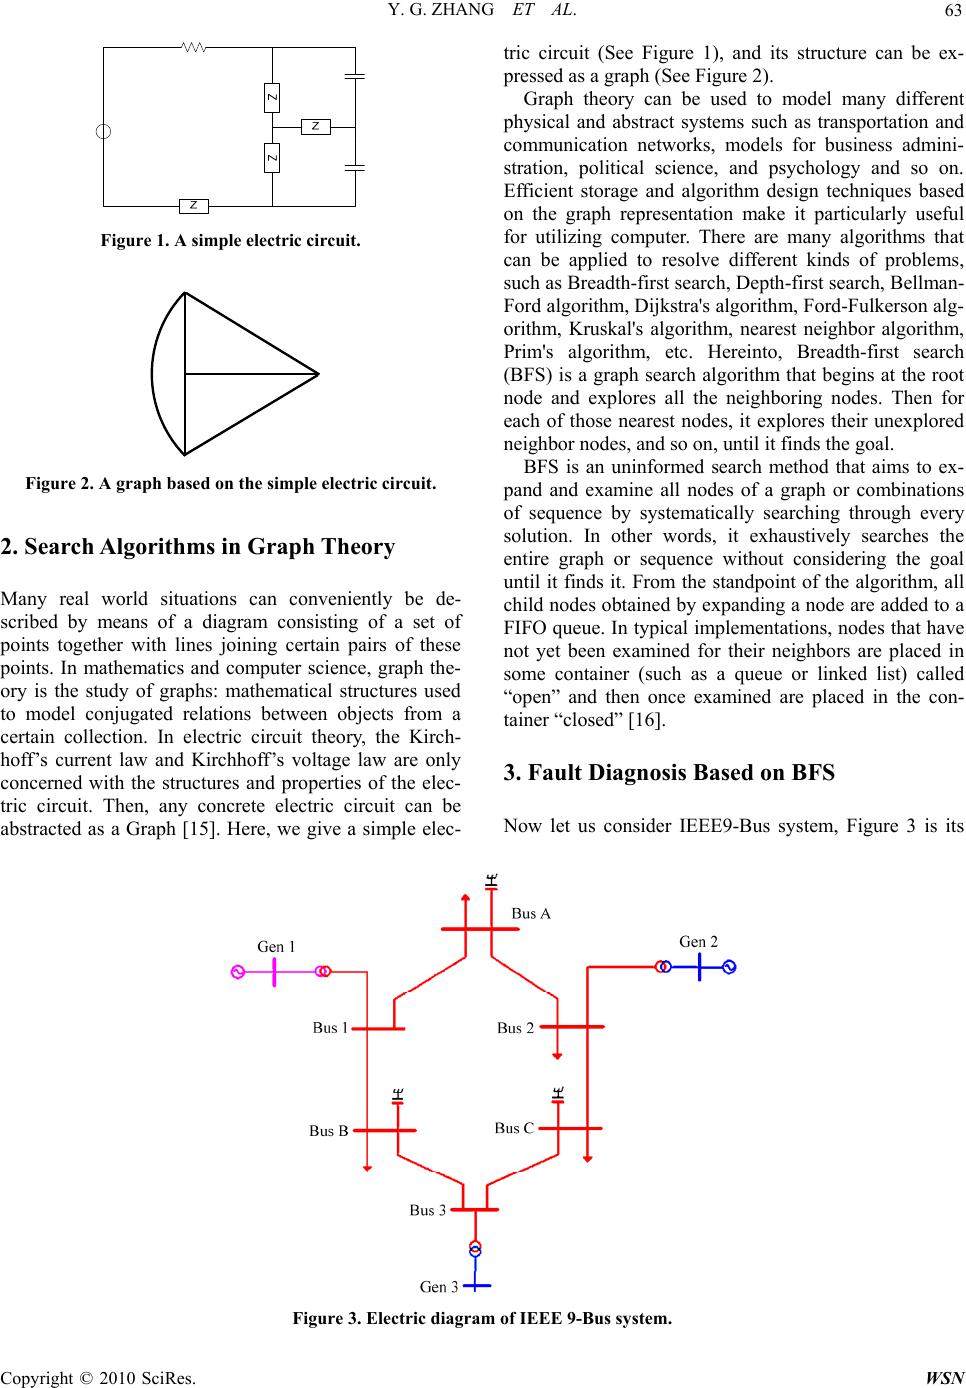 Y. G. ZHANG ET AL. 63 Figure 1. A simple electric circuit. Figure 2. A graph based on the simple electric circuit. 2. Search Algorithms in Graph Theory Many real world situations can conveniently be de- scribed by means of a diagram consisting of a set of points together with lines joining certain pairs of these points. In mathematics and computer science, graph the- ory is the study of graphs: mathematical structures used to model conjugated relations between objects from a certain collection. In electric circuit theory, the Kirch- hoff’s current law and Kirchhoff’s voltage law are only concerned with the structures and properties of the elec- tric circuit. Then, any concrete electric circuit can be abstracted as a Graph [15]. Here, we give a simple elec- tric circuit (See Figure 1), and its structure can be ex- pressed as a graph (See Figure 2). Graph theory can be used to model many different physical and abstract systems such as transportation and communication networks, models for business admini- stration, political science, and psychology and so on. Efficient storage and algorithm design techniques based on the graph representation make it particularly useful for utilizing computer. There are many algorithms that can be applied to resolve different kinds of problems, such as Breadth-first search, Depth-first search, Bellman- Ford algorithm, Dijkstra's algorithm, Ford-Fulkerson alg- orithm, Kruskal's algorithm, nearest neighbor algorithm, Prim's algorithm, etc. Hereinto, Breadth-first search (BFS) is a graph search algorithm that begins at the root node and explores all the neighboring nodes. Then for each of those nearest nodes, it explores their unexplored neighbor nodes, and so on, until it finds the goal. BFS is an uninformed search method that aims to ex- pand and examine all nodes of a graph or combinations of sequence by systematically searching through every solution. In other words, it exhaustively searches the entire graph or sequence without considering the goal until it finds it. From the standpoint of the algorithm, all child nodes obtained by expanding a node are added to a FIFO queue. In typical implementations, nodes that have not yet been examined for their neighbors are placed in some container (such as a queue or linked list) called “open” and then once examined are placed in the con- tainer “closed” [16]. 3. Fault Diagnosis Based on BFS Now let us consider IEEE9-Bus system, Figure 3 is its Figure 3. Electric diagram of IEEE 9-Bus system. C opyright © 2010 SciRes. WSN 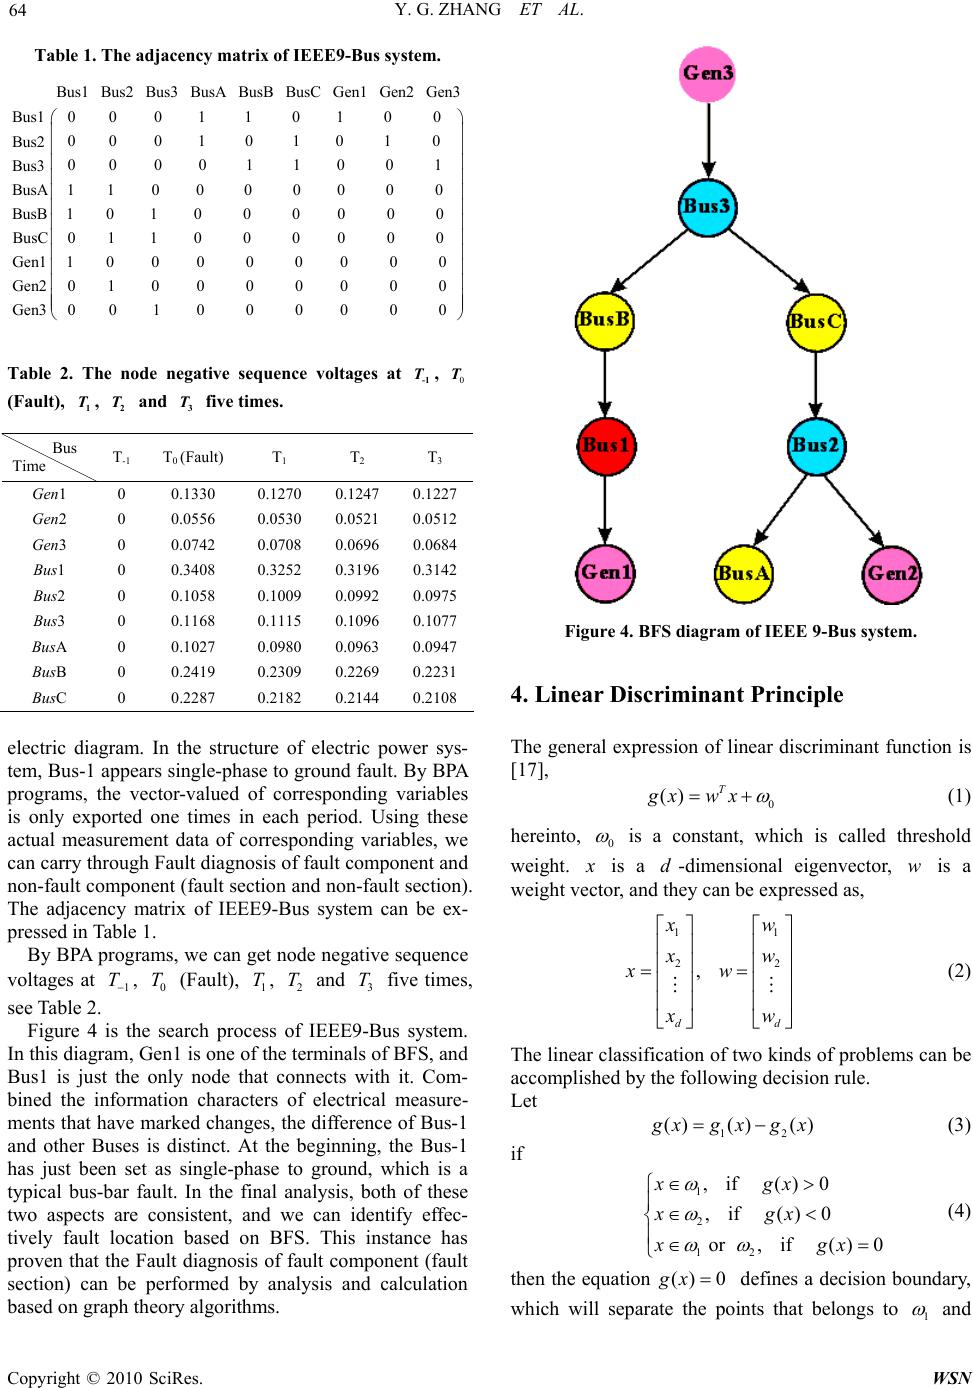 Y. G. ZHANG ET AL. 64 Table 1. The adjacency matrix of IEEE9-Bus system. Bus1 Bus2 Bus3 BusA BusB BusC Gen1 Gen2 Gen3 0 0 0 1 1 0 1 0 0 Bus1 0 Bus2 Bus3 BusA BusB BusC Gen1 Gen2 Gen3 0 0 1 0 1 0 1 0 0 0 0 0 1 1 0 0 1 1 1 0 0 0 0 0 0 0 1 0 1 0 0 0 0 0 0 0 1 1 0 0 0 0 0 0 1 0 0 0 0 0 0 0 0 0 1 0 0 0 0 0 0 0 0 0 1 0 0 0 0 0 0 Table 2. The node negative sequence voltages at , (Fault), , and five times. -1 T0 T 1 T2 T3 T Bus Time T-1 T 0 (Fault) T1 T 2 T 3 Gen1 0 0.1330 0.1270 0.1247 0.1227 Gen2 0 0.0556 0.0530 0.0521 0.0512 Gen3 0 0.0742 0.0708 0.0696 0.0684 Bus1 0 0.3408 0.3252 0.3196 0.3142 Bus2 0 0.1058 0.1009 0.0992 0.0975 Bus3 0 0.1168 0.1115 0.1096 0.1077 BusA 0 0.1027 0.0980 0.0963 0.0947 BusB 0 0.2419 0.2309 0.2269 0.2231 BusC 0 0.2287 0.2182 0.2144 0.2108 Copyright © 2010 SciRes. WSN electric diagram. In the structure of electric power sys- tem, Bus-1 appears single-phase to ground fault. By BPA programs, the vector-valued of corresponding variables is only exported one times in each period. Using these actual measurement data of corresponding variables, we can carry through Fault diagnosis of fault component and non-fault component (fault section and non-fault section). The adjacency matrix of IEEE9-Bus system can be ex- pressed in Table 1. By BPA programs, we can get node negative sequence voltages at , (Fault), , and five times, see Table 2. 1 T0 T1 T2 T3 T Figure 4 is the search process of IEEE9-Bus system. In this diagram, Gen1 is one of the terminals of BFS, and Bus1 is just the only node that connects with it. Com- bined the information characters of electrical measure- ments that have marked changes, the difference of Bus-1 and other Buses is distinct. At the beginning, the Bus-1 has just been set as single-phase to ground, which is a typical bus-bar fault. In the final analysis, both of these two aspects are consistent, and we can identify effec- tively fault location based on BFS. This instance has proven that the Fault diagnosis of fault component (fault section) can be performed by analysis and calculation based on graph theory algorithms. Figure 4. BFS diagram of IEEE 9-Bus system. 4. Linear Discriminant Principle The general expression of linear discriminant function is [17], 0 () T gx wx (1) hereinto, 0 is a constant, which is called threshold weight. x is a -dimensional eigenvector, is a weight vector, and they can be expressed as, dw 11 2 , dd 2 x w x w xw x w (2) The linear classification of two kinds of problems can be accomplished by the following decision rule. Let 12 ()() () g xgxgx (3) if 1 2 12 , if ()0 , if ()0 or , if ()0 xgx xgx xgx (4) then the equation() 0gx defines a decision boundary, which will separate the points that belongs to 1 and 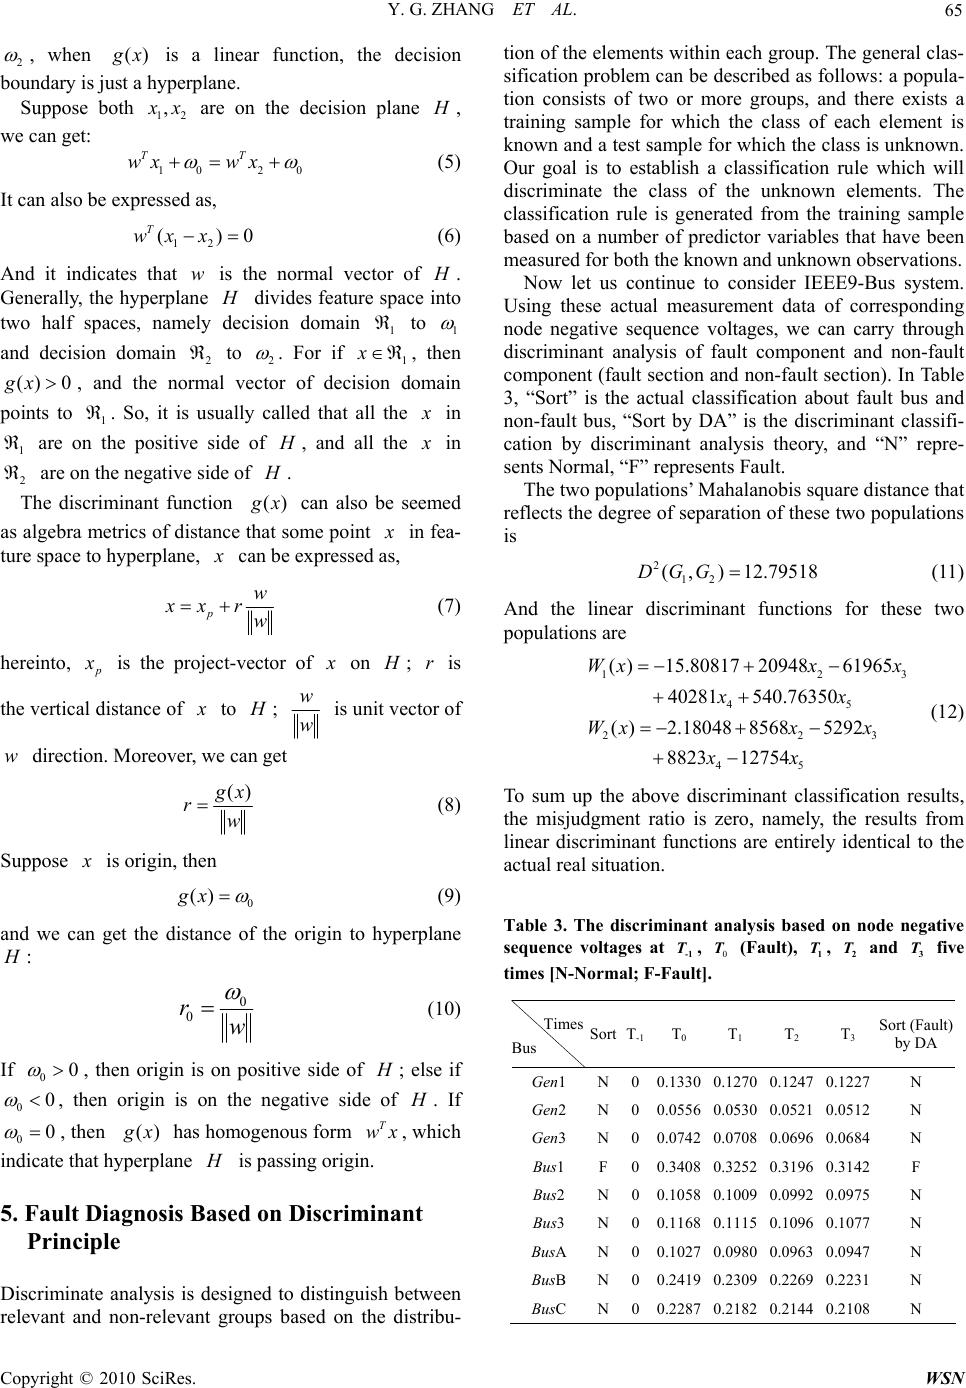 Y. G. ZHANG ET AL. 65 2 , when () g x is a linear function, the decision boundary is just a hyperplane. Suppose both 12 , x x are on the decision plane H , we can get: 10 2 TT wxwx 0 (5) It can also be expressed as, 12 ()wx x T0 (6) And it indicates that w is the normal vector of H . Generally, the hyperplane H divides feature space into two half spaces, namely decision domain to 1 1 and decision domain to 2 2 . For if , then , and the normal vector of decision domain points to . So, it is usually called that all the 1 x () 0gx 1 x in are on the positive side of 1 H , and all the x in are on the negative side of 2 H . The discriminant function () g x can also be seemed as algebra metrics of distance that some point x in fea- ture space to hyperplane, x can be expressed as, p w xx r w (7) hereinto, p x is the project-vector of x on H ; is the vertical distance of r x to H ; w w is unit vector of direction. Moreover, we can get w () g x rw (8) Suppose x is origin, then 0 ()gx (9) and we can get the distance of the origin to hyperplane H : 0 0 rw (10) If 00 , then origin is on positive side of H ; else if 00 , then origin is on the negative side of H . If 00 , then () g x has homogenous form , which indicate that hyperplane T wx H is passing origin. 5. Fault Diagnosis Based on Discriminant Principle Discriminate analysis is designed to distinguish between relevant and non-relevant groups based on the distribu- tion of the elements within each group. The general clas- sification problem can be described as follows: a popula- tion consists of two or more groups, and there exists a training sample for which the class of each element is known and a test sample for which the class is unknown. Our goal is to establish a classification rule which will discriminate the class of the unknown elements. The classification rule is generated from the training sample based on a number of predictor variables that have been measured for both the known and unknown observations. Now let us continue to consider IEEE9-Bus system. Using these actual measurement data of corresponding node negative sequence voltages, we can carry through discriminant analysis of fault component and non-fault component (fault section and non-fault section). In Table 3, “Sort” is the actual classification about fault bus and non-fault bus, “Sort by DA” is the discriminant classifi- cation by discriminant analysis theory, and “N” repre- sents Normal, “F” represents Fault. The two populations’ Mahalanobis square distance that reflects the degree of separation of these two populations is 2 12 (,) 12.79518DGG (11) And the linear discriminant functions for these two populations are 12 45 22 45 ( )15.808172094861965 40281540.76350 ( )2.1804885685292 882312754 Wxx x xx Wxx x xx 3 3 (12) To sum up the above discriminant classification results, the misjudgment ratio is zero, namely, the results from linear discriminant functions are entirely identical to the actual real situation. Table 3. The discriminant analysis based on node negative sequence voltages at , (Fault), , and five times [N-Normal; F-Fault]. -1 T0 T1 T2 T3 T Times Bus Sort T-1 T0 T 1 T 2 T 3 Sort (Fault) by DA Gen1 N00.13300.1270 0.1247 0.1227N Gen2 N00.0556 0.0530 0.0521 0.0512N Gen3 N00.0742 0.0708 0.0696 0.0684N Bus1 F00.3408 0.3252 0.3196 0.3142F Bus2 N00.1058 0.1009 0.0992 0.0975N Bus3 N00.1168 0.1115 0.1096 0.1077N BusA N00.1027 0.0980 0.0963 0.0947N BusB N00.2419 0.2309 0.2269 0.2231N BusC N00.2287 0.2182 0.2144 0.2108N C opyright © 2010 SciRes. WSN  Y. G. ZHANG ET AL. Copyright © 2010 SciRes. WSN 66 So, the diagnosis of fault component (fault section) can also be performed by linear discriminant analysis and calculation. 6. Conclusions and Discussions In the control of electric power networks, especially in the wide area backup protection of electric power sys- tems, the prerequisite of protection device’s accurate, fast and reliable performance is its corresponding fault type and fault location can be diagnosed quickly and defined exactly. In our researches, global information has been introduced into the backup protection system, basing on graph theory algorithms and linear discriminant principle, we have found out the data characteristics of electrical quantities’ marked changes by analyzing and computing real-time PMU measurements, thereby we carry out fast and exact diagnosis of fault components and fault sec- tions. The results of BFS and linear discriminant are identical. The main technical contributions and innova- tions in this paper include, introducing global informa- tion into electric power network, developing a novel topological analysis to fault diagnosis. Graph theory algorithms can be used to model many different physical and abstract systems such as transpor- tation and communication networks, models for business administration, political science, and psychology and so on. In the study of fault diagnosis in electric power net- works, graph theory algorithms must also have a good prospect of application. Linear discriminant is a procedure used to classify an object into one of several a priori groupings dependent on the individual characteristics of the object. After the groups are established, data are collected for the objects in the groups. Then the linear discriminant functions de- rive a linear combination of these characteristics between the groups. Linear discriminant analysis technique has the advantage of considering an entire profile of charac- teristics common to the relevant objects, as well as the interaction of these properties. 7. Acknowledgments This research was supported partly by Key Program of National Natural Science Foundation of China (5083 7002) and the Science Foundation for the Doctors of NCEPU. 8. References [1] J. Cao, “Principal component analysis based fault detection and isolation,” Ph.D. Thesis of George Mason University, 2004. [2] M. Marseguerra and E. Zio, “Monte Carlo simulation for model-based fault diagnosis in dynamic systems,” Reliability Engineering & System Safety, Vol. 94, No. 2, pp. 180–186, 2009. [3] Y. G. Lei, Z. J. He, and Y. Y. Zi, “A new approach to intelligent fault diagnosis of rotating machinery,” Expert Systems with Applications, Vol. 35, No. 4, pp. 1593– 1600, 2008. [4] X. Q. Xiang, J. Z. Zhou, X. L. An, B. Peng, and J. J. Yang, “Fault diagnosis based on Walsh transform and support vector machine,” Mechanical Systems and Signal Processing, Vol. 22, No. 7, pp. 1685–1693, 2008. [5] A. M. Pertew, H. J. Marquez, and Q. Zhao, “LMI-based sensor fault diagnosis for nonlinear lipschitz systems,” Automatica, Vol. 43, No. 8, pp. 1464–1469, 2007. [6] A. G. Rehorn, E. Sejdić, and J. Jiang, “Fault diagnosis in machine tools using selective regional correlation,” Mechanical Systems and Signal Processing, Vol. 20, No. 5, pp. 1221–1238, 2006. [7] J. X. Yuan, “Wide area protection and emergency control to prevent large scale blackout,” China Electric Power Press, Beijing, 2007. [8] L. Ye, “Study on sustainable development strategy of electric power in China in 2020,” Electric Power, Vol. 36, No. 10, pp. 1–7, 2003. [9] Y. S. Xue, “Interactions between power market stability and power system stability,” Automation of Electric Power Systems, Vol. 26, No. 21–22, pp. 1–6, pp. 1–4, 2002. [10] Q. X. Yang, “A review of the application of WAMS information in electric power system protective relaying,” Modern Electric Power, No. 3, pp. 1, 2006. [11] J. Yi and X. X. Zhou, “A survey on power system wide- area protection and control,” Power System Technology, Vol. 30, pp. 7–13, 2006. [12] Y. G. Zhang, P. Zhang and H. F. Shi, “Statistic character in nonlinear systems,” Proceedings of the Sixth Inter- national Conference on Machine Learning and Cyber- netics (ICMLC), Hong Kong, Vol. 5, pp. 2598– 2602, August 2007. [13] Y. G. Zhang, C. J. Wang and Z. Zhou, “Inherent randomicity in 4-symbolic dynamics,” Chaos, Solitons and Fractals, Vol. 28, No. 1, pp. 236–243, 2006. [14] Y. G. Zhang and C. J. Wang, “Multiformity of inherent randomicity and visitation density in n-symbolic dyna- mics,” Chaos, Solitons and Fractals, Vol. 33, No. 2, pp. 685–694, 2007. [15] J. A. Bondy and U. S. R. Murth, “Graph theory with applications,” Elsevier Science Publishing Co.,Inc., New York, 1976. [16] D. E. Knuth, “The art Of computer programming,” Third Edition, Addison-Wesley, Boston, 1997. [17] Z. Q. Bian and X. G. Zhang, “Pattern recognition,” Se- cond Edition, Tsinghua University Press, Beijing, 2000. |