Paper Menu >>
Journal Menu >>
 Wireless Sensor Network, 2010, 2, 1-6 doi:10.4236/wsn.2010.21001 anuary 2010 (http://www.SciRP.org/journal/wsn/). Copyright © 2010 SciRes. WSN Published Online J Evaluation of Downlink Performance of a Multiple-Cell, Rake Receiver Assisted CDMA Mobile System Ayodeji J. BAMISAYE, Michael O. KOLAWOLE Department of Electrical and Electronics Engineering, The Federal University of Technology, Akure, Nigeria Email: {ayobamisaye, kolawolm}@yahoo.com Received August 15, 2009; revised September 7, 2009; accepted September 10, 2009 Abstract In wireless Code Division Multiple Access (CDMA) system, the use of power control is indispensable to combat near-far and fading problems. Signals transmitted over a multipath propagation channel which exhib- its inter-path interference and fading. The receiver has to employ measures to mitigate these effects or it will incur severe performance degradation. A classic approach in CDMA communications is the rake receiver. In this paper, the downlink performance is estimated for a CDMA mobile system at the vertex of multiple ad- jacent cells. At the base station the received signal is coherently dispread and demodulated using a rake re- ceiver. The effects of power control, error correction and rake receiver were also investigated on the as- sumption that the received signals undergo Rayleigh fading, lognormal shadowing, and frequency selective fading. The evaluation of performance measures of base to mobile link (downlink) of a multiple-cell CDMA mobile system is presented. This study demonstrates that significant performance improvements are achiev- able with combined use of power control, rake receiver and error correction scheme. Keywords: DS-CDMA, Power Control, Rake Receiver, Error Correction, Probability Density Function 1. Introduction In wireless communication, fading is one of the prob- lems that cause the signal fluctuation so it may cause degradation of signal level at the receiver. CDMA as one of the wireless communication types also experiences fading. Although downlink channels in CDMA are tran- smitted with codes that are orthogonal to one another; that is, they are encoded for minimal mutual interference, multipath propagation causes the downlink signal to be “smeared” in time, destroying some of this orthogonality [1]. Another problem that CDMA suffers is signal inter- ference from other users because all users in CDMA system use the same frequency. One of the solutions to mitigate fading is diversity. In a fading environment, the principal means for a direct-sequence (DS-CDMA) sys- tem to obtain the benefits of diversity combining is by using rake receiver—by coherently combining resolvable fading. Diversity can improve the quality of the received signal at the receiver. To combat other users’ interfer- ence, power control is used to improve the CDMA sys- tem performance because power control can minimize the interference between users. Spread-spectrum signals inherently exhibit frequency diversity. Due to the in- creased bandwidth, a spectral null is less likely to affect the entire signal spectrum. For the same reason, however, the radio channel is likely dispersive. In order to exploit frequency diversity, the receiver has to collect signal energy from several multi-paths. For this purpose, a rake receiver allocates so-called fingers to multi-paths; in which each finger dispreads the receive signal synchro- nized to the corresponding path delay, while the receiver subsequently computes a weighted sum of the rake re- ceiver fingers’ output. The signal-to-interference ratio (SIR) in fading chan- nels varies according to the channels’ response, and the required SIR to achieve a certain bit-error rate (BER) depends on the distribution of SIR. To keep the SIR nearly constant at the desired level, power control can be used [2]. The reverse link of a CDMA system employs both open loop and closed loop power control. The open loop power control is performed at the mobile station based on the measurement of the downlink signals and therefore, it can only compensate for the near far dis- tance problem. The closed loop power control is per- formed at the base station based on measurements of the SIR experienced at the base station and therefore re- quires information to be fed back from the base station to 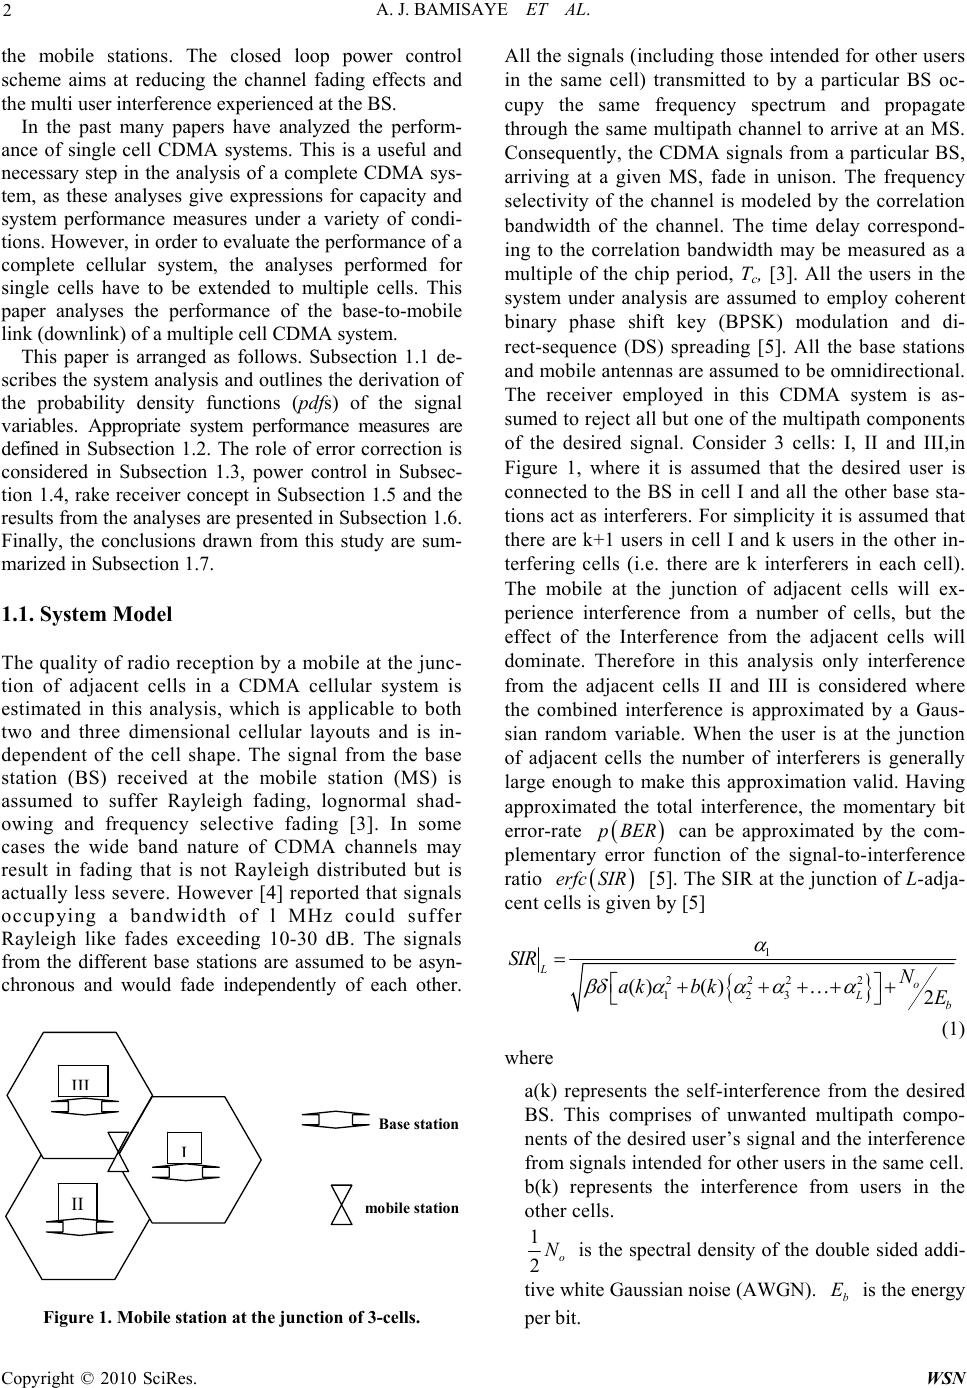 A. J. BAMISAYE ET AL. 2 the mobile stations. The closed loop power control scheme aims at reducing the channel fading effects and the multi user interference experienced at the BS. In the past many papers have analyzed the perform- ance of single cell CDMA systems. This is a useful and necessary step in the analysis of a complete CDMA sys- tem, as these analyses give expressions for capacity and system performance measures under a variety of condi- tions. However, in order to evaluate the performance of a complete cellular system, the analyses performed for single cells have to be extended to multiple cells. This paper analyses the performance of the base-to-mobile link (downlink) of a multiple cell CDMA system. This paper is arranged as follows. Subsection 1.1 de- scribes the system analysis and outlines the derivation of the probability density functions (pdfs) of the signal variables. Appropriate system performance measures are defined in Subsection 1.2. The role of error correction is considered in Subsection 1.3, power control in Subsec- tion 1.4, rake receiver concept in Subsection 1.5 and the results from the analyses are presented in Subsection 1.6. Finally, the conclusions drawn from this study are sum- marized in Subsection 1.7. 1.1. System Model The quality of radio reception by a mobile at the junc- tion of adjacent cells in a CDMA cellular system is estimated in this analysis, which is applicable to both two and three dimensional cellular layouts and is in- dependent of the cell shape. The signal from the base station (BS) received at the mobile station (MS) is assumed to suffer Rayleigh fading, lognormal shad- owing and frequency selective fading [3]. In some cases the wide band nature of CDMA channels may result in fading that is not Rayleigh distributed but is actually less severe. However [4] reported that signals occupying a bandwidth of l MHz could suffer Rayleigh like fades exceeding 10-30 dB. The signals from the different base stations are assumed to be asyn- chronous and would fade independently of each other. II I III Base station mobile station Figure 1. Mobile station at the junction of 3-cells. All the signals (including those intended for other users in the same cell) transmitted to by a particular BS oc- cupy the same frequency spectrum and propagate through the same multipath channel to arrive at an MS. Consequently, the CDMA signals from a particular BS, arriving at a given MS, fade in unison. The frequency selectivity of the channel is modeled by the correlation bandwidth of the channel. The time delay correspond- ing to the correlation bandwidth may be measured as a multiple of the chip period, Tc, [3]. All the users in the system under analysis are assumed to employ coherent binary phase shift key (BPSK) modulation and di- rect-sequence (DS) spreading [5]. All the base stations and mobile antennas are assumed to be omnidirectional. The receiver employed in this CDMA system is as- sumed to reject all but one of the multipath components of the desired signal. Consider 3 cells: I, II and III,in Figure 1, where it is assumed that the desired user is connected to the BS in cell I and all the other base sta- tions act as interferers. For simplicity it is assumed that there are k+1 users in cell I and k users in the other in- terfering cells (i.e. there are k interferers in each cell). The mobile at the junction of adjacent cells will ex- perience interference from a number of cells, but the effect of the Interference from the adjacent cells will dominate. Therefore in this analysis only interference from the adjacent cells II and III is considered where the combined interference is approximated by a Gaus- sian random variable. When the user is at the junction of adjacent cells the number of interferers is generally large enough to make this approximation valid. Having approximated the total interference, the momentary bit error-rate pBER can be approximated by the com- plementary error function of the signal-to-interference ratio erfc SIR [5]. The SIR at the junction of L-adja- cent cells is given by [5] 1 2222 123 () ()2 L o Lb SIR N ak bkE (1) where a(k) represents the self-interference from the desired BS. This comprises of unwanted multipath compo- nents of the desired user’s signal and the interference from signals intended for other users in the same cell. b(k) represents the interference from users in the other cells. 1 2o N b E is the spectral density of the double sided addi- tive white Gaussian noise (AWGN). is the energy per bit. Copyright © 2010 SciRes. WSN 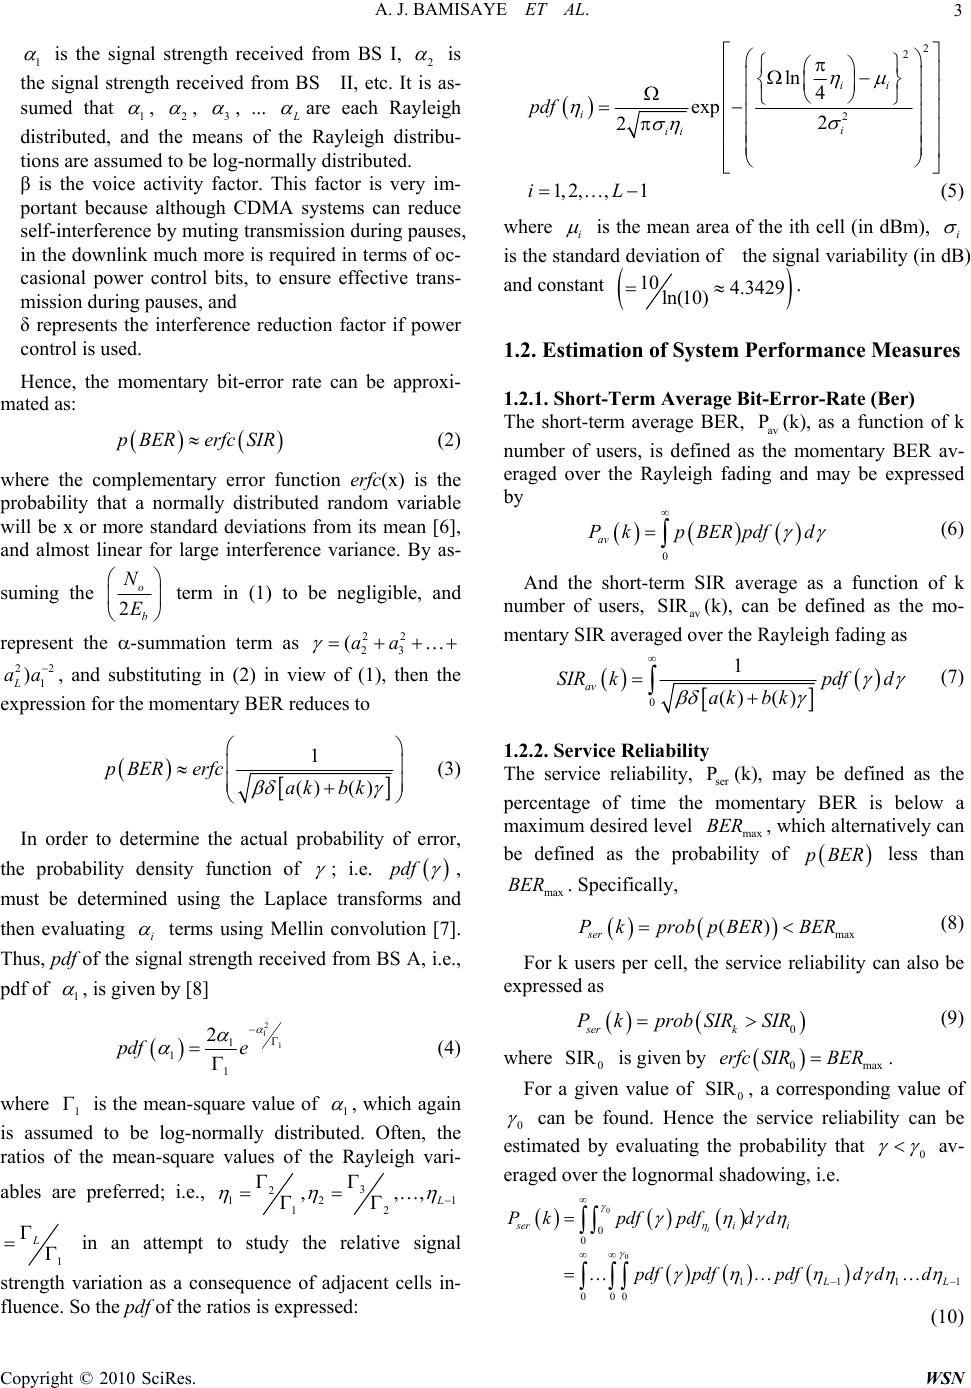 A. J. BAMISAYE ET AL. 3 1 is the signal strength received from BS I, 2 is the signal strength received from BS II, etc. It is as- sumed that 1 , 2 , 3 , ... L are each Rayleigh distributed, and the means of the Rayleigh distribu- tions are assumed to be log-normally distributed. β is the voice activity factor. This factor is very im- portant because although CDMA systems can reduce self-interference by muting transmission during pauses, in the downlink much more is required in terms of oc- casional power control bits, to ensure effective trans- mission during pauses, and δ represents the interference reduction factor if power control is used. Hence, the momentary bit-error rate can be approxi- mated as: erfcSIRpBER (2) where the complementary error function erfc(x) is the probability that a normally distributed random variable will be x or more standard deviations from its mean [6], and almost linear for large interference variance. By as- suming the 2 o b N E 22 23 aa 2 term in (1) to be negligible, and represent the -summation term as , and substituting in (2) in view of (1), then the expression for the momentary BER reduces to ( 2 1 ) L aa 1 () ()akbk pBER erfc (3) In order to determine the actual probability of error, the probability density function of ; i.e. pdf , must be determined using the Laplace transforms and then evaluating i terms using Mellin convolution [7]. Thus, pdf of the signal strength received from BS A, i.e., pdf of 1 , is given by [8] 2 1 1 1 1 2e 1 1 1 pdf (4) where is the mean-square value of , which again is assumed to be log-normally distributed. Often, the ratios of the mean-square values of the Rayleigh vari- ables are preferred; i.e., 31 12 ,,, L 2 12 1 L in an attempt to study the relative signal strength variation as a consequence of adjacent cells in- fluence. So the pdf of the ratios is expressed: 2 2 2 ln 4 exp 2 2 ii i i ii pdf 1, 2,,1iL i (5) where is the mean area of the ith cell (in dBm), i is the standard deviation of the signal variability (in dB) and constant 10 4.3429 ln(10) av P 0 av PkpBERpdf d . 1.2. Estimation o f S y stem Pe rformance Me asures 1.2.1. Short-Term Average Bit-Error-Rate (Ber) The short-term average BER, (k), as a function of k number of users, is defined as the momentary BER av- eraged over the Rayleigh fading and may be expressed by av SIR (6) And the short-term SIR average as a function of k number of users, (k), can be defined as the mo- mentary SIR averaged over the Rayleigh fading as 0 1 () () av SIR kpdfd ak bk ser P max BER (7) 1.2.2. Service Reliability The service reliability, (k), may be defined as the percentage of time the momentary BER is below a maximum desired level , which alternatively can be defined as the probability of pBER max BER less than . Specifically, max () (8) s er Pk probpBERBER For k users per cell, the service reliability can also be expressed as 0ser k P kprobSIRSIR 0 SIR 0max erfc SIRBER 0 SIR 0 (9) where is given by . For a given value of , a corresponding value of can be found. Hence the service reliability can be estimated by evaluating the probability that 0 av- eraged over the lognormal shadowing, i.e. 0 0 0 0 1111 000 i seri i L L Pkpdfpdfdd pdfpdfpdfd dd (10) C opyright © 2010 SciRes. WSN 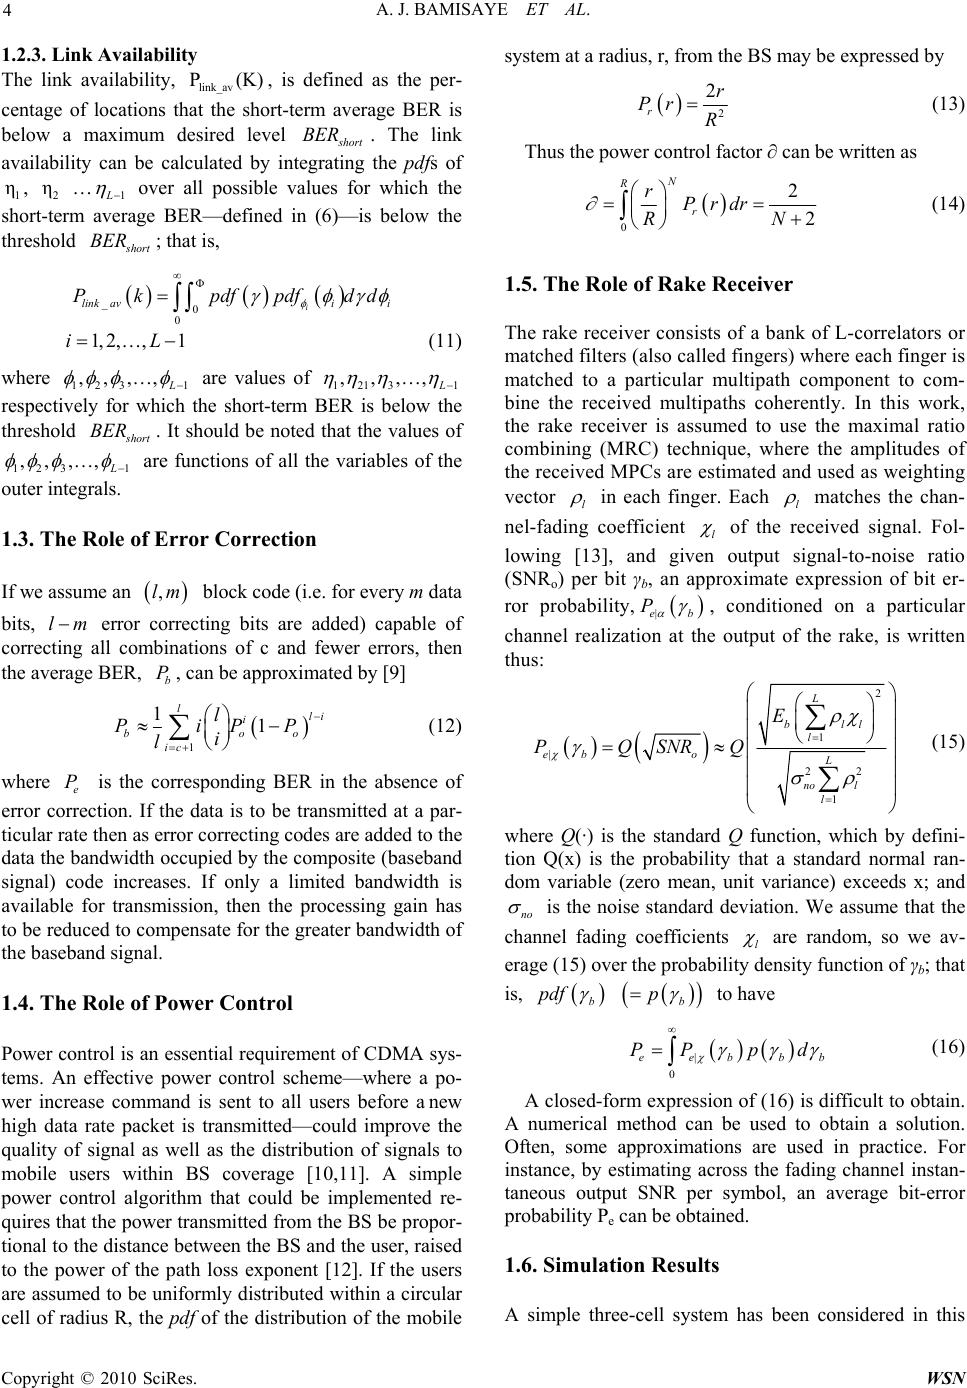 A. J. BAMISAYE ET AL. 4 v(K) 1.2.3. Link Availability The link availability, , is defined as the per- centage of locations that the short-term average BER is below a maximum desired level link_a P s hort BER . The link availability can be calculated by integrating the pdfs of , … 1 η2 η1 L over all possible values for which the short-term average BER—defined in (6)—is below the threshold s hort BER ; that is, _0 0 link av Pkpdf p ii i dfd d 1, 2,,1iL 123 1 ,,,, (11) where L 1213 1 ,,,, are values of L respectively for which the short-term BER is below the threshold s ho BER 1 , rt . It should be noted that the values of 123 ,,, L are functions of all the variables of the outer integrals. 1.3. The Role of Error Correction If we assume an block code (i.e. for every m data bits, error correcting bits are added) capable of correcting all combinations of c and fewer errors, then the average BER, , can be approximated by [9] ,lm m P l b 1li i o o PP e P 1 1l b ic l Pi i l (12) where is the corresponding BER in the absence of error correction. If the data is to be transmitted at a par- ticular rate then as error correcting codes are added to the data the bandwidth occupied by the composite (baseband signal) code increases. If only a limited bandwidth is available for transmission, then the processing gain has to be reduced to compensate for the greater bandwidth of the baseband signal. 1.4. The Role of Power Control Power control is an essential requirement of CDMA sys- tems. An effective power control scheme—where a po- wer increase command is sent to all users before a new high data rate packet is transmitted—could improve the quality of signal as well as the distribution of signals to mobile users within BS coverage [10,11]. A simple power control algorithm that could be implemented re- quires that the power transmitted from the BS be propor- tional to the distance between the BS and the user, raised to the power of the path loss exponent [12]. If the users are assumed to be uniformly distributed within a circular cell of radius R, the pdf of the distribution of the mobile system at a radius, r, from the BS may be expressed by 2 2 r r Pr R (13) Thus the power control factor ∂ can be written as 0 2 2 N R r rPrdr RN l (14) 1.5. The Role of Rake Receiver The rake receiver consists of a bank of L-correlators or matched filters (also called fingers) where each finger is matched to a particular multipath component to com- bine the received multipaths coherently. In this work, the rake receiver is assumed to use the maximal ratio combining (MRC) technique, where the amplitudes of the received MPCs are estimated and used as weighting vector in each finger. Each l matches the chan- nel-fading coefficient l of the received signal. Fol- lowing [13], and given output signal-to-noise ratio (SNRo) per bit γb, an approximate expression of bit er- ror probability, |eb P , conditioned on a particular channel realization at the output of the rake, is written thus: 2 1 | 22 1 L bll l eb oL no l l E PQSNRQ no (15) where Q(·) is the standard Q function, which by defini- tion Q(x) is the probability that a standard normal ran- dom variable (zero mean, unit variance) exceeds x; and is the noise standard deviation. We assume that the channel fading coefficients l are random, so we av- erage (15) over the probability density function of γb; that is, b p b pdf | 0 eebbb PP pd to have (16) A closed-form expression of (16) is difficult to obtain. A numerical method can be used to obtain a solution. Often, some approximations are used in practice. For instance, by estimating across the fading channel instan- taneous output SNR per symbol, an average bit-error probability Pe can be obtained. 1.6. Simulation Results A simple three-cell system has been considered in this Copyright © 2010 SciRes. WSN 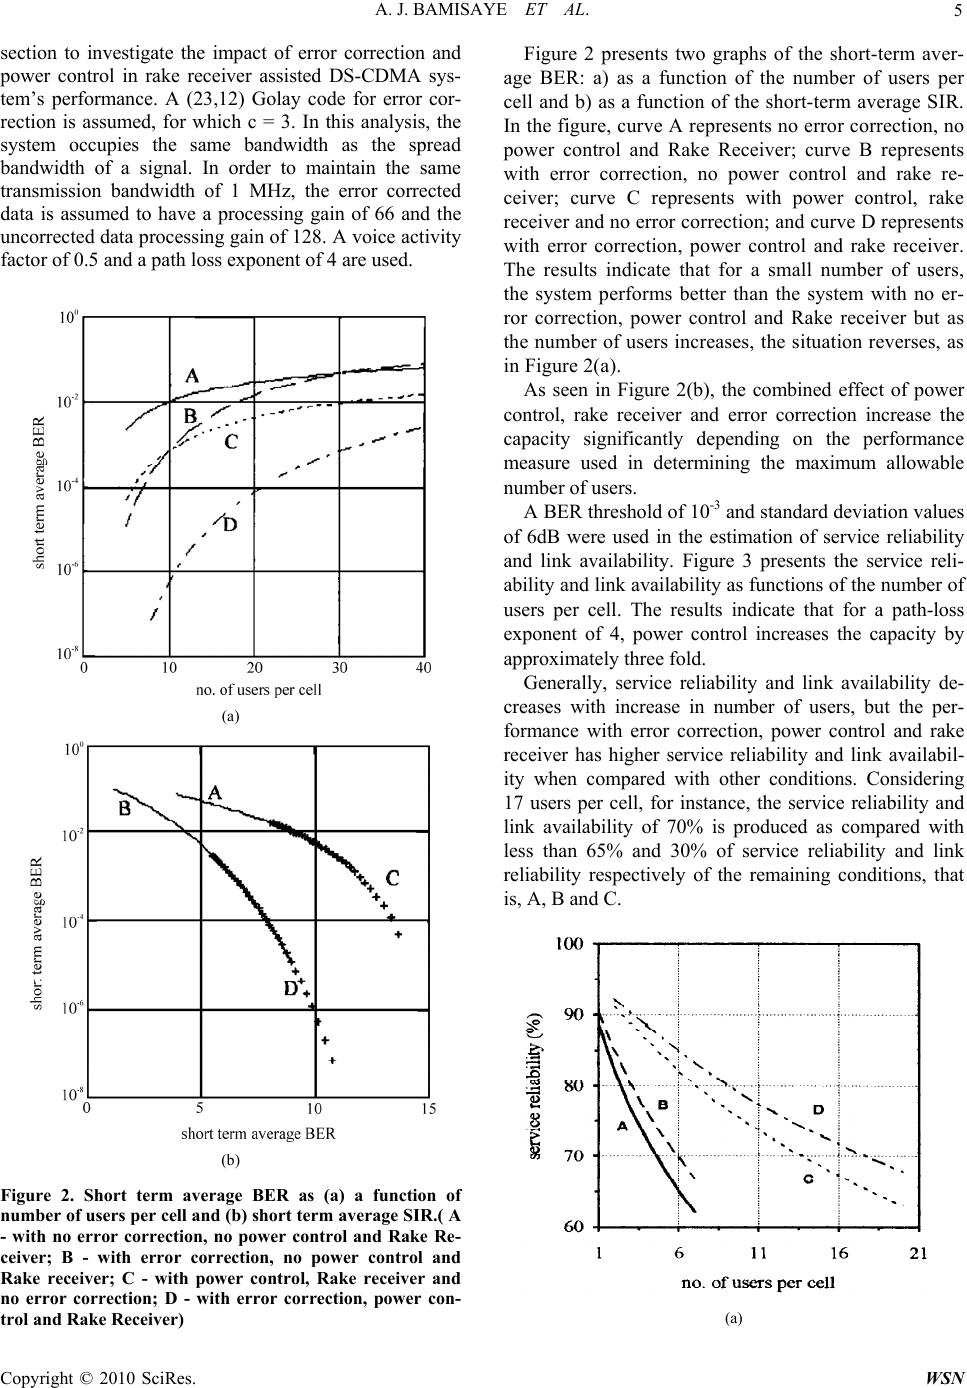 A. J. BAMISAYE ET AL. 5 section to investigate the impact of error correction and power control in rake receiver assisted DS-CDMA sys- tem’s performance. A (23,12) Golay code for error cor- rection is assumed, for which c = 3. In this analysis, the system occupies the same bandwidth as the spread bandwidth of a signal. In order to maintain the same transmission bandwidth of 1 MHz, the error corrected data is assumed to have a processing gain of 66 and the uncorrected data processing gain of 128. A voice activity factor of 0.5 and a path loss exponent of 4 are used. (a) (b) Figure 2. Short term average BER as (a) a function of number of users per cell and (b) short term average SIR.( A - with no error correction, no power control and Rake Re- ceiver; B - with error correction, no power control and Rake receiver; C - with power control, Rake receiver and no error correction; D - with error correction, power con- trol and Rake Receiver) Figure 2 presents two graphs of the short-term aver- age BER: a) as a function of the number of users per cell and b) as a function of the short-term average SIR. In the figure, curve A represents no error correction, no power control and Rake Receiver; curve B represents with error correction, no power control and rake re- ceiver; curve C represents with power control, rake receiver and no error correction; and curve D represents with error correction, power control and rake receiver. The results indicate that for a small number of users, the system performs better than the system with no er- ror correction, power control and Rake receiver but as the number of users increases, the situation reverses, as in Figure 2(a). As seen in Figure 2(b), the combined effect of power control, rake receiver and error correction increase the capacity significantly depending on the performance measure used in determining the maximum allowable number of users. A BER threshold of 10-3 and standard deviation values of 6dB were used in the estimation of service reliability and link availability. Figure 3 presents the service reli- ability and link availability as functions of the number of users per cell. The results indicate that for a path-loss exponent of 4, power control increases the capacity by approximately three fold. Generally, service reliability and link availability de- creases with increase in number of users, but the per- formance with error correction, power control and rake receiver has higher service reliability and link availabil- ity when compared with other conditions. Considering 17 users per cell, for instance, the service reliability and link availability of 70% is produced as compared with less than 65% and 30% of service reliability and link reliability respectively of the remaining conditions, that is, A, B and C. (a) C opyright © 2010 SciRes. WSN  A. J. BAMISAYE ET AL. Copyright © 2010 SciRes. WSN 6 [2] K. S. Gilhousen, “On the capacity of a cellular CDMA system,” IEEE Transactions on Vehicular Technology, Vol. 40, pp. 303–312, 1991. [3] D. E. Borth and M. B. Pursley, “Analysis of direct- sequence spread spectrum multiple-access communica- tion over Rician fading channels,” IEEE Transactions of Communications, Vol. COM-27, pp. 1566–1577, 1979. [4] D. L. Schilling, L. B. Milstein, R. L. Pickholtz, F. Bruno, E. Kanterakis, M. Kullback, V. Erceg, W. Biederman, D. Fishman, and D. Salerno, “Broadband CDMA for per- sonal communications system,” IEEE Communications Magazine, pp. 86–93, 1991. [5] I. B. Milstein, T. S. Rappaport, and R. Barghouti, “Per- formance evaluation for cellular CDMA,” IEEE Journal on Selected Areas in Communications, Vol. 10, No. 4, pp. 680–689, 1992. (b) [6] A. N. Rosenberg and S. Kemp, “CDMA capacity and quality optimization,” McGraw-Hill, 2003 Figure 3. (a) Service reliability as a function of number of users per cell and (b) link availability as a function of num- ber of users per cell. [7] M. D. Springer, “The algebra of random variables,” Wiley, New York, 1979. [8] K. W. Sowerby and A. G. Williamson “Outage probabil- ity calculations for a mobile radio systems with multiple interferers,” Electronic Letters, Vol. 24, No. 24, pp. 1511– 1513, 1988. 1.7. Conclusions Techniques and expressions for estimating the short term average Bit-error-rate (BER), service reliability and link availability are developed. The downlink performance is estimated for a CDMA mobile system at the vertex of multiple adjacent cells. The performance of rake receiver assisted multiple-cell CDMA mobile system undergoing Rayleigh fading, lognormal shadowing, and frequency selective fading was investigated where the system oc- cupies the same bandwidth as the spread bandwidth of a signal. This study demonstrates that for rake receiver assisted CDMA-system significant performance im- provements are achievable with combined use of power control and error correction scheme. [9] D. J. Torrieri, “The information bit-error-rate for block codes,” Transactions of Communications, Vol. COM-32, pp. 474–476, 1984. [10] Y. Hara, K. Suzuki, K. Kaneko, and T. Sekiguchi, Radio Resource Management and Power Control for W-CDMA Uplink with High Data Rate Packet Transmission, IEICE Transactions on Communications, E88-B(5), pp. 2102–2109, 2005. [11] A. J. Bamisaye and M. O. Kolawole, “Capacity and qual- ity optimization in CDMA 3G networks,” Journal of Communication and Information Systems, 2009, (ac- cepted for publication). [12] R. R. Gejji, “Forward-link-power control in CDMA cel- lular systems,” IEEE Transactions on Vehicular Tech- nology, Vol. 4, pp. 532–536, 1992. 2. References [1] ADC, CDMA Capacity and Coverage, White Paper, http://www.adc.com, 2006. [13] J. G. Proakis, “Digital communications,” McGraw Hill, 1995. |