 J. Biomedical Science and Engineering, 2010, 3, 39-46 doi:10.4236/jbise.2010.31006 Published Online January 2010 (http://www.SciRP.org/journal/jbise/ JBiSE ). Published Online January 2010 in SciRes. http://www.scirp.org/journal/jbise Evaluation of EEG 2 /θ -ratio and channel locations in measuring anesthesia depth Zhi-Bin Tan1, Le-Yi Wang1, George McKelvey2, Aliaksei Pustavoitau2, Guang-Xiang Yu2, Harold Michael Marsh2, Hong Wang2 1Department of Electrical and Computer Engineering, Wayne State University, Detroit, USA; 2Department of Anesthesiology, Wayne State University, Detroit, USA. Email: au6063@wayne.edu; lywang@wayne.edu; gmckelve@med.wayne.edu; yuguangxiang@gmail.com; hmarsh@med.wayne.edu; howang@med.wayne.edu Received 25 June 2009; revised 25 November 2009; accepted 30 November 2009. ABSTRACT In this paper, the ratio of powers in the frequency bands of 2 and waves in EEG signals (termed as the 2 /θ-ratio) was introduced as a potential enhancem- ent in measuring anesthesia depth. The 2 /θ-ratio was compared to the relative -ratio which had been commercially used in the BIS monitor. Sensitivity and reliability of the 2 /θ-ratio and EEG measurement locations were analyzed for their effectiveness in measuring anesthesia depth during different stages of propofol induced anesthesia (awake, induction, maintenance, and emergence). The analysis indicated that 1) the relative -ratio and 2 /θ-ratio derived from the prefrontal, frontal, and the central cortex EEG signals were of substantial sensitivity for capturing anesthesia depth changes. 2) Certain channel positions in the frontal part of the cortex, such as , had the combined benefits of substantial sensitivity and noise resistance. 3) The F4 2 /θ-ratio captured the initial excitation, while the relative -ratio did not. 4) In the maintenance and emergence stages, the 2 /θ -ratio showed improved reliability. Implications: The ratio of powers in EEG frequency bands 2 and derived from the frontal cortex EEG channels has combined benefits of substantial sensitivity and noise resistance in measuring anesthesia depth. Keywords: Anesthesia Depth; EEG (Electroencephalogram); EEG Channels; / 2-Ratio; Relative -Ratio 1. INTRODUCTION In this paper, the ratio of powers in the frequency bands of 2 and waves in EEG signals (termed as the / 2-ratio) was introduced and evaluated as a potential enhancement in measuring anesthesia depth, in comparison to the relative -ratio which had been commercially used in the BIS (Bi-spectrum Index) monitor (Aspect Medical Systems). Sensitivity and reliability of the / 2-ratio and EEG measurement locations were analyzed for their effectiveness in measuring anesthesia depth during four stages of propofol induced anesthesia (awake, induction, maintenance, and emergence). Since the physiologic effects of anesthetic agents in ether anesthesia were observed by John Snow in 1847 [1], characterizing, measuring, and continuously moni- toring anesthesia depth have been pursued extensively. Accurate monitoring of anesthesia depth can help to avoid overdose of anesthetic agents, prevent intrao- perative awareness, and assist the anesthesiologist in anesthesia decisions and management. Case studies have also indicated that objective monitoring of the anesthesia depth can guide more precise administration of anesthesia agents, and consequently can potentially reduce drug costs, expedite post-anesthesia recovery, and shorten hospital stay [2,3]. With the central nervous system (CNS) being the target of anesthesia drugs, the electroencephalogram (EEG) signal processing has naturally become the focus for anesthesia depth monitoring [4,5]. The goal of all these EEG processing methods was to generate some parameters or scales, collectively called quantitative EEG “indices,” that were clinically reliable as indicators for anesthesia depth. It was widely believed that anesthetics had effects on the EEG in multiple aspects: such as amplitude, frequency, phase relation, frequency band power transition, etc., [14]. Individual indicators, such as spectral edge frequency, median frequency, band power ratio, etc., demonstrated different levels of capability, but individually did not provide completely reliable descriptors of anesthesia depth [8]. In addition, their sensitivity and reliability were influenced sig- nificantly by the EEG signal channels and anesthesia 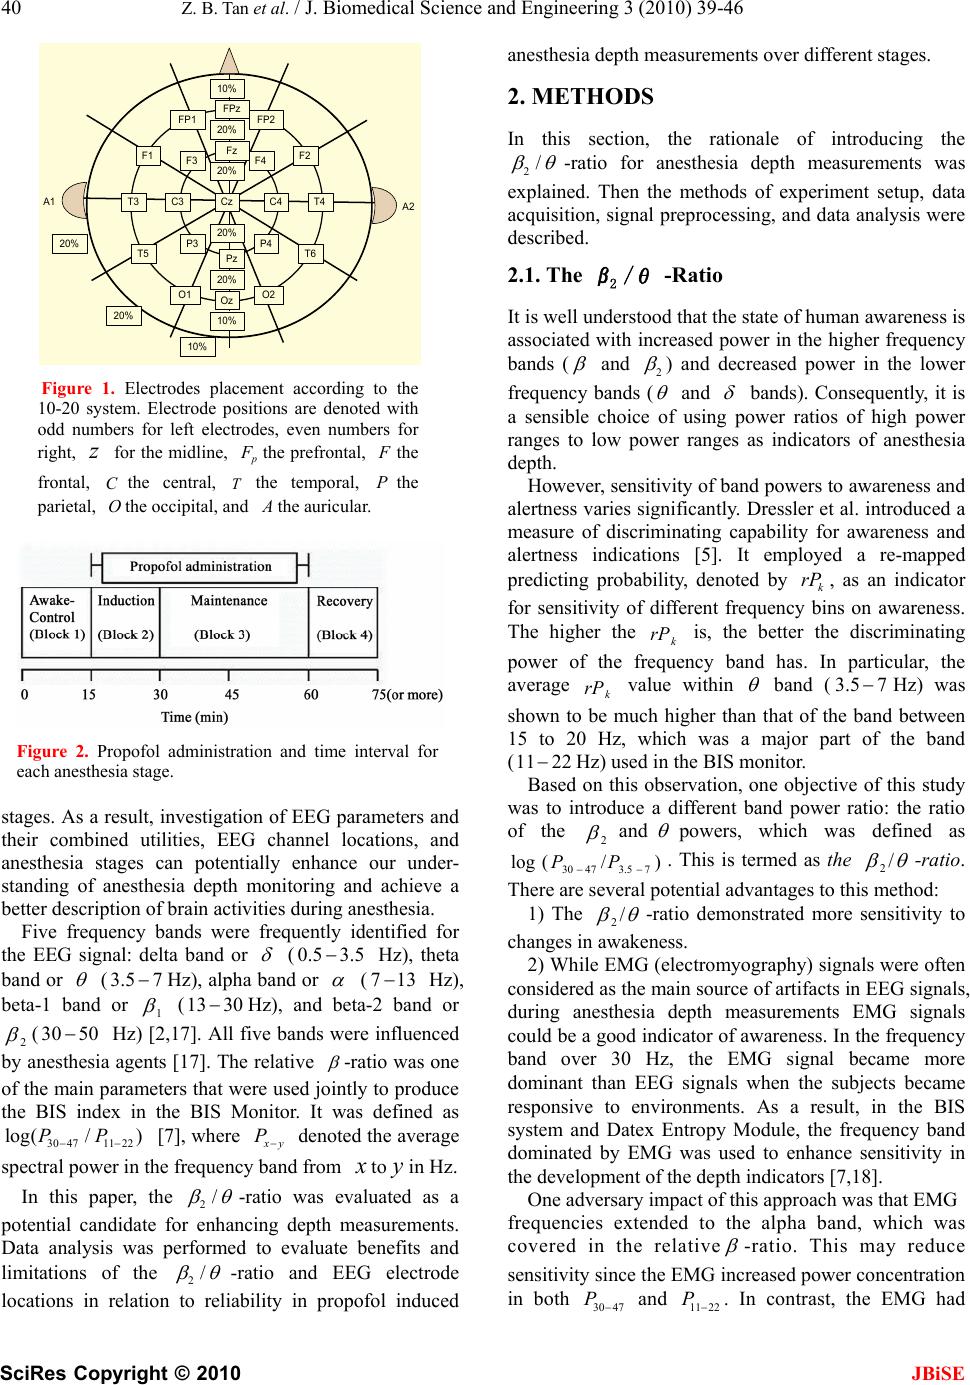 40 Z. B. Tan et al. / J. Biomedical Science and Engineering 3 (2010) 39-46 SciRes Copyright © 2010 JBiSE T4 F4 Cz FP2 A2 10% A1 FPz Fz FP1 F3 F2F1 C4C3T3 T6T5 O1 Pz P4 Oz P3 O2 20% 20% 10% 20% 20% 10% 20% 20% Figure 1. Electrodes placement according to the 10-20 system. Electrode positions are denoted with odd numbers for left electrodes, even numbers for right, for the midline, z Fthe prefrontal, the frontal, the central, C the temporal, the parietal, the occipital, and P O the auricular. Figure 2. Propofol administration and time interval for each anesthesia stage. stages. As a result, investigation of EEG parameters and their combined utilities, EEG channel locations, and anesthesia stages can potentially enhance our under- standing of anesthesia depth monitoring and achieve a better description of brain activities during anesthesia. Five frequency bands were frequently identified for the EEG signal: delta band or (0. Hz), theta band or 5 3.5 (3.5 Hz), alpha band or 7 (713 Hz), beta-1 band or 1 (13 Hz), and beta-2 band or 2 30 (30 Hz) [2,17]. All five bands were influenced by anesthesia agents [17]. The relative 50 -ratio was one of the main parameters that were used jointly to produce the BIS index in the BIS Monitor. It was defined as [7], where 3047 /P 1122)P log( y P denoted the average spectral power in the frequency band from to in Hz. In this paper, the 2/ 2/ -ratio was evaluated as a potential candidate for enhancing depth measurements. Data analysis was performed to evaluate benefits and limitations of the -ratio and EEG electrode locations in relation to reliability in propofol induced anesthesia depth measurements over different stages. 2. METHODS In this section, the rationale of introducing the 2/ -ratio for anesthesia depth measurements was explained. Then the methods of experiment setup, data acquisition, signal preprocessing, and data analysis were described. 2.1. The 2 /θ -Ratio It is well understood that the state of human awareness is associated with increased power in the higher frequency bands ( and 2 ) and decreased power in the lower frequency bands ( and bands). Consequently, it is a sensible choice of using power ratios of high power ranges to low power ranges as indicators of anesthesia depth. However, sensitivity of band powers to awareness and alertness varies significantly. Dressler et al. introduced a measure of discriminating capability for awareness and alertness indications [5]. It employed a re-mapped predicting probability, denoted by , as an indicator for sensitivity of different frequency bins on awareness. The higher the is, the better the discriminating power of the frequency band has. In particular, the average value within k rP k rP k rP band (Hz) was shown to be much higher than that of the band between 15 to 20 Hz, which was a major part of the band (11 3.5 7 22 Hz) used in the BIS monitor. Based on this observation, one objective of this study was to introduce a different band power ratio: the ratio of the 2 and powers, which was defined as . This is termed as the )/ 47P(log 73.530 P / 2-ratio. There are several potential advantages to this method: 1) The / 2-ratio demonstrated more sensitivity to changes in awakeness. 2) While EMG (electromyography) signals were often considered as the main source of artifacts in EEG signals, during anesthesia depth measurements EMG signals could be a good indicator of awareness. In the frequency band over 30 Hz, the EMG signal became more dominant than EEG signals when the subjects became responsive to environments. As a result, in the BIS system and Datex Entropy Module, the frequency band dominated by EMG was used to enhance sensitivity in the development of the depth indicators [7,18]. One adversary impact of this approach was that EMG frequencies extended to the alpha band, which was covered in the relative -ratio. This may reduce sensitivity since the EMG increased power concentration in both 30 47 P and 11 22 P . In contrast, the EMG had 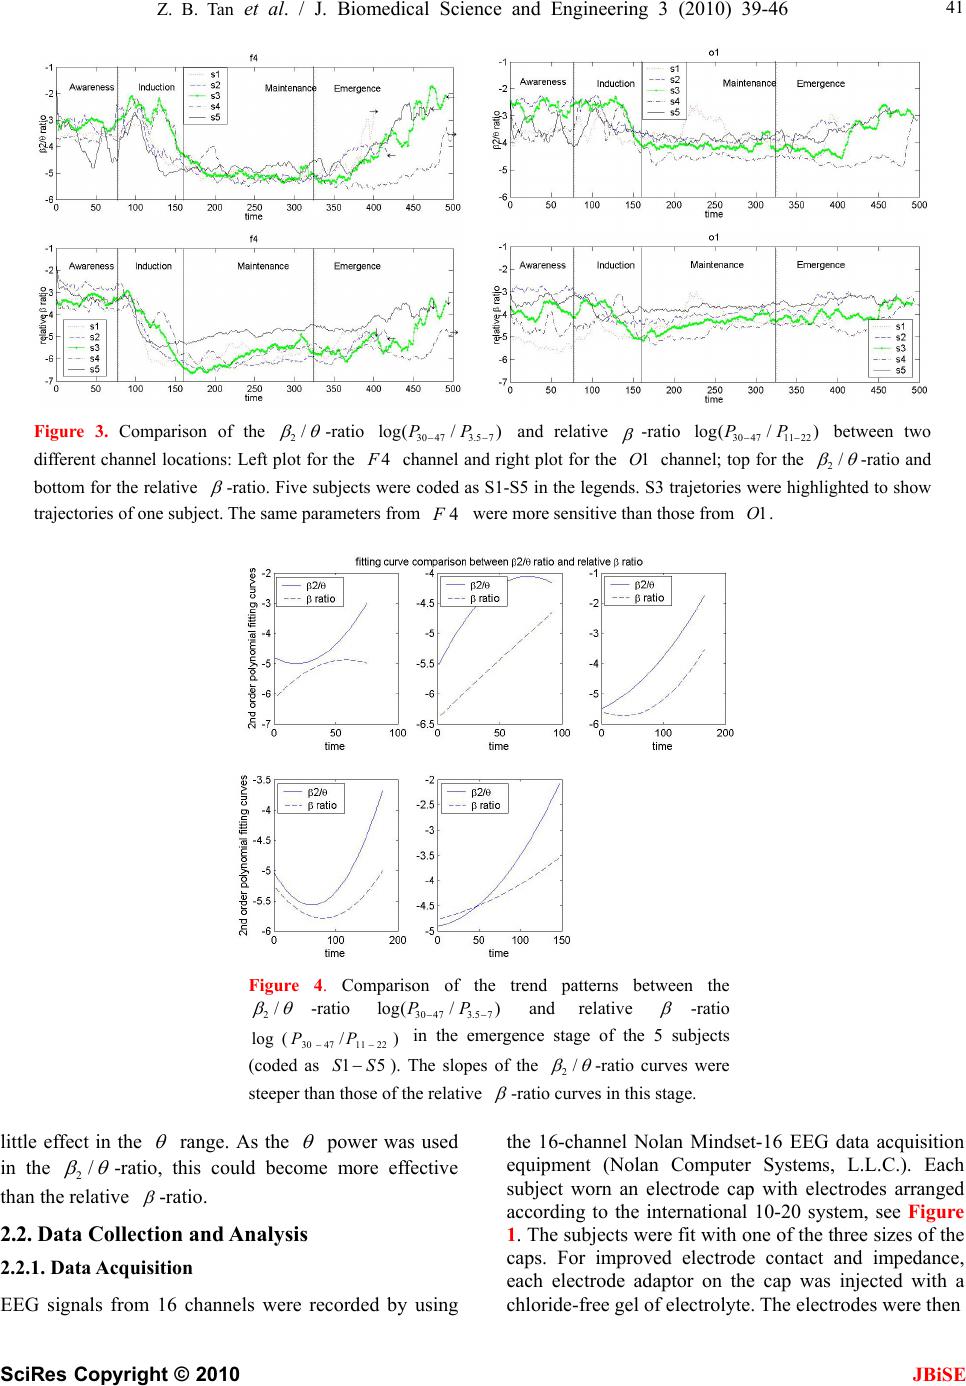 Z. B. Tan et al. / J. Biomedical Science and Engineering 3 (2010) 39-46 SciRes Copyright © 2010 JBiSE 41 Figure 3. Comparison of the 2/ -ratio and relative 30 473.5 7 log(/ )PP -ratio between two different channel locations: Left plot for the channel and right plot for the channel; top for the 304711 22 log(/ )PP 4F1O2/ -ratio and bottom for the relative -ratio. Five subjects were coded as S1-S5 in the legends. S3 trajetories were highlighted to show trajectories of one subject. The same parameters from were more sensitive than those from . 4F1O Figure 4. Comparison of the trend patterns between the 2/ -ratio and relative 30 473.5 7 log(/ )PP -ratio in the emergence stage of the 5 subjects (coded as ). The slopes of the ) 22 5 S /114730P 1 S (log P 2/ -ratio curves were steeper than those of the relative -ratio curves in this stage. little effect in the range. As the power was used in the 2/ -ratio, this could become more effective than the relative -ratio. 2.2. Data Collection and Analysis 2.2.1. Data Acquisition EEG signals from 16 channels were recorded by using the 16-channel Nolan Mindset-16 EEG data acquisition equipment (Nolan Computer Systems, L.L.C.). Each subject worn an electrode cap with electrodes arranged according to the international 10-20 system, see Figure 1. The subjects were fit with one of the three sizes of the caps. For improved electrode contact and impedance, each electrode adaptor on the cap was injected with a chloride-free gel of electrolyte. The electrodes were then  42 Z. B. Tan et al. / J. Biomedical Science and Engineering 3 (2010) 39-46 SciRes Copyright © 2010 JBiSE Table 1. Averaged parameter ranges of different channels during the induction and emergence stages. induction emergence Fp1 226.09 129.19 Fp2 213.42 126.26 F7 134.28 75.81 F3 102.62 149.19 F4 289.76 153.22 F8 208.33 116.68 T3 40.27 16.55 C3 120.97 46.85 C4 115.19 47.81 T4 52.45 22.97 T5 22.85 15.97 P3 61.25 27.79 P4 68.13 27.67 T6 39.20 23.54 O1 62.88 26.32 O2 54.83 27.35 Table 2. Averaged SNRs(dB) of different channels in different stages. awake induc- tion mainte- nance emer- gence Fp1 6.45 14.03 31.90 22.51 Fp2 8.19 14.41 33.64 19.17 F7 10.32 14.01 30.41 17.14 F3 10.74 13.79 33.38 23.54 F4 14.54 16.44 31.36 27.86 F8 10.83 15.86 30.71 18.03 T3 13.71 11.94 29.09 11.52 C3 13.47 14.06 30.32 18.50 C4 16.07 15.42 31.42 18.73 T4 13.29 13.24 33.88 12.43 T5 15.92 12.29 29.07 9.77 P3 17.09 13.87 31.53 15.68 P4 19.68 14.96 31.43 15.15 T6 17.81 13.05 29.78 11.72 O1 16.98 11.20 29.05 11.17 O2 17.53 12.09 27.10 11.10 connected to the adaptor. The machine performed an impedance test first and was ready for recording after the test. Nolan Mindset was connected to a host computer system. The Nolan software runed on the host computer and recorded simultaneously the 16 channel EEG signals with a time reference. Although the Nolan software was capable of performing limited data analysis and display, our data analysis was performed with special programed algorithms. The 16 channels were divided equally for the left side (1 p, , , , , , , ) and the right side (, 3F7F Fp 3C 4 3T5T3P1O 2 , , , , , , ). The reference montage was used. As a result, the additional reference electrodes were placed with 8F4C4T6T4P 1 2O (near the left ear) as the reference for the left-side electrodes and 2 (near the right ear) as the reference for the right-side electrodes. 2.2.2. Subjects and Anesthesia The results presented in this paper were based on the EEG recordings from 5 young healthy male volunteers. As a pilot study, the sample size was small. The study was conducted in the Receiving Hospital, Detroit, Michigan, USA, and received institutional approval. All subjects were explained of the nature of the study and consenting participants. The BIS values were monitored by the BIS monitor. Other physiological vital signs (blood pressures, heart rate, oxygen saturation, etc.) were continuously mo- nitored by the anesthesia monitor (S-5 Anesthesia Monitor by Datex-Ohmeda, Inc.) during the entire process. Propofol infusion rates ranged from170200 minkgg // . The data collection procedure was divided into four separated stages, which are shown in Figure 2: 1) Awake Stage1 (15 minutes): The subject was conscious and instructed to close their eyes and be calm and inactive. Facial and body move- ments were observed in this stage. No anesthesia drugs were administered. 2) Induction Stage (15 minutes): Propofol infusion started at the beginning of the induction stage. During this stage, propofol infusion rates were adjusted to achieve a BIS value to the desired levels (between 30 and 50). Towards the end of this 15-minute period, the BIS values of all the subjects became stable. This stage was characterized by sub- stantial changes of anesthesia depth towards its steady- state values. Occasional facial and body movements occurred. 3) Maintenance Stage (30 minutes): Propofol infusion was maintained for 30 minutes to sustain the desired BIS level and depth of anesthesia. This stage was characterized by relatively stable BIS values, no drug rate adjustment, and no body move- ments. 4) Emergence Stage (15 minutes or longer): This stage started when propofol administration ceased with the subject gradually recovering to become awake. Due to differences in recovery speed, the duration 1It was sometimes called the control stage. For terminology consistenc it was called awake stage throughout this paper, as shown in Figure 2.  Z. B. Tan et al. / J. Biomedical Science and Engineering 3 (2010) 39-46 SciRes Copyright © 2010 JBiSE 43 Figure 5. Variances of powers in the original EEG epochs in the Fp1 channel. Variance spikes due to artifact contamination in some epochs are indicated in rectangular frames. varied. Body movements became gradually apparent in the recovery process of this stage. 2.2.3. Signal Preprocessing The raw EEG signals were digitized with sampling frequency 256 Hz. The 60 Hz power contamination was visible in the recorded EEG signals. To reduce noise effects, the original EEG data were manually cleared of highly visible artifacts (eye movements, body move- ments, equipment disturbance, cable movements, etc.). Then, a low-pass filter with cutoff frequency of 47 Hz was designed to filter out the 60 Hz power line disturbances before data analysis. 2.2.4. Data Analysis EEG epochs of 2560 data points (10 sec.) were used for generating one parameter point of the / 2-ratio (and the relative -ratio) as follows: the 10-second interval was divided into 4 overlapping segments of 4 seconds each:[0,4],. The spectrum of each seg- ment was estimated by Welch's method [19]. The resulting spectra of the four segments were averaged to generate one spectrum. This approach reduced zero-mean independent random sensor noises. [6,10][4,8],[2,6], Then, the powers of , and were extracted from the resulting spectra to form a value point of the 4730 P73.5 P2211 P / 2-ratio (and similarly the relative -ratio) for the EEG epoch. This process was repeated for the entire EEG recording, except for epochs that were removed due to visible artifacts. To further reduce random fluctuations, the / 2-ratios and relative -ratios over a moving window of length 10 parameter points were averaged to produce the final data points for analysis. 3. RESULTS The trajectories of the / 2-ratio and the relative )/(log 73.54730PP -ratio from the )/ 221147 P(log 30 P 4 EEG electrode for 5 patients were plotted in Figure 3, where a patient was only indexed by a code h as 1S, with data from one patt (code 3S) highlighted with green color. B) 75 ) 2211 were negative values, as shown in the suc and ien /(log 3.4730PP oth /P(30 Plog 47 -axis of the plots. While the awake, induction, and maintenance stages had fixed lengths, the duration of the emergence stage was variable, with an arrow showing the time when the subject became fully tage was slighan its designated m the data. aw in ake. The trajectories were divided by the four stages marked by “awareness (for awake stage),” “induction,” “maintenance,” and “emergence.” Due to the removal of the corrupted and other unusable data points, the length of each stly shorter th terval. The following results were derived fro 3.1. Initial Depth Surge Detection It was common that a patient responded to initial  44 Z. B. Tan et al. / J. Biomedical Science and Engineering 3 (2010) 39-46 SciRes Copyright © 2010 JBiSE rame anesthesia infusion with a surge of excitement for a short time. Capturing this initial phase of response was an indication of causal dependence of the pater on anesthesia depth. Figure 3 showed that the / 2- ratio demonstrated an initial su in each patient in indurgection, while neither the relative -ratio nor the B 3.2. Sensitivity of EEG Parameters to Anesthesia -orde . IS did. Depth Changes For the induction and emergence stages in which anesthesia depth changed greatly, the sensitivity of a parameter to depth change was evaluated by either the difference between its maximum and minimum values or by the slope of the parameter trajectory during the stage. This was accomplished by extracting the trend patterns using the least-squares curve fitting with a secondr polynomial modelThe trend patterns of the 2/ - ratio and relative -ratio in the emergence stage were d in Figure 4. The larger s of the showe slope / 2-ratio curves implied that the / 2-ratio was more sensitive to the dep changeth due ring threcovery process than the relative -ratio. Sensitivity of EEG Signals from Different 3.3. Channels to Anesthesia Depth Changes It was visually apparentfrom Figure 3 that the parameters derived from 4 responded tdepth chan- ges more pronounced than those from 1O. This was further verified by comparing the sensitivity of EEG parameters from the frontal region to that of the posterior region. Table 1 listed the parameter ranges in the induction and emergence stages (the awake and maintenance stages are irrelevant since they have nearly constant depths) in all 16 table were calculated by =rangemaximumminimum of o nels. Thtries of the chane en / 2-ratio in the respective stages. Then the ranges were averaged over the five subjects. In both stages, the highest sensites occurrediviti at tht channels,e fron especially the 4 channel. 3.4. Noise Resistance of EEG Channels The amplitudes of EEG signals were noticeably lower than noises. When an epoch of the EEG signal was contaminated by artifacts, the variance of the power in this epoch changed markedly from the average of recent previous ones. This artifact detection method was used in the Narcotrend monitor of anesthesia depth [20]. Figure 5 illustrated the variance spikes caused by arti- fa cording channels, the signal-to-noise ratio was used cts, from one subject and channel 1Fp . To quantify the noise resistance capability of different EEG re N =N oise Free SignalPower SNR oise Power in which the powers were calculated over one given stage. The larger the SNR, the stronger the ability of the channel was to resist noise. Table 2 detailed the SNRs of the 16 channels in each stage, averaged over the five subjects. In the awake stage, patients were alert with eye and facial movements, leading to very small SNRs. In the maintenance stage (in deep anesthesia), SNRs were high across all recording channels. These two stages were not essential in comparison. In the induction and emergence stages, in which anesthesia depth changed most dra- matically, the SNRs in the frontal channels, especially the 4 channel, had the highest value of all the 16 channels monitored. 4. DISCUSSIONS A variety of methods and commercial devices for measuring the depth of anesthesia based on EEG signals have been developed [6,7,8,9,10,11,12,13]. At present, the underlying mechanism of effects of anesthesia agents on the CNS is not well understood. The main approaches of EEG signal processing utilized empirical methods to relate EEG parameters to the drug effects by experi- ments and statistical analysis. Currently, there are a few anesthesia depth monitors in the market, such as the BIS monitor (Aspect Medical Systems, Inc.) and the Entropy Module (GE Medical Systems, Inc.) [14]. Both monitors used Pre-frontal EEG signals. These monitors provided quite reliable monitoring capability in deep anesthesia. On the other hand, due to disturbances from facial and body movements, their reliability during induction and recovery stages and in ICU (intensive care units) applications remained to be enhanced [15,16]. 4.1. Summary of Main Findings This study was focused on potential utility of the / 2-ratio in improvement of anesthesia depth monitoring. Due to its close similarity to the relative -ratio which was commercially used in the BIS monitor, our study was focused on characteristic comparison between the / 2-ratio and the relative -ratio. In particular, it highlighted the following preliminary findings: 1) The relative -ratio and / 2-ratio derived from the prefrontal, frontal, and the central cortex EEG signals were of substantial sensitivity in capturing anesthesia depth changes. However, these parameters from posterior area EEG signals did not provide sufficient sensitivity to measure anesthesia depth variations. 2) Certain channel positions in the frontal part of the cortex had the combined benefits of substantial sensitivity and noise resistance, particularly 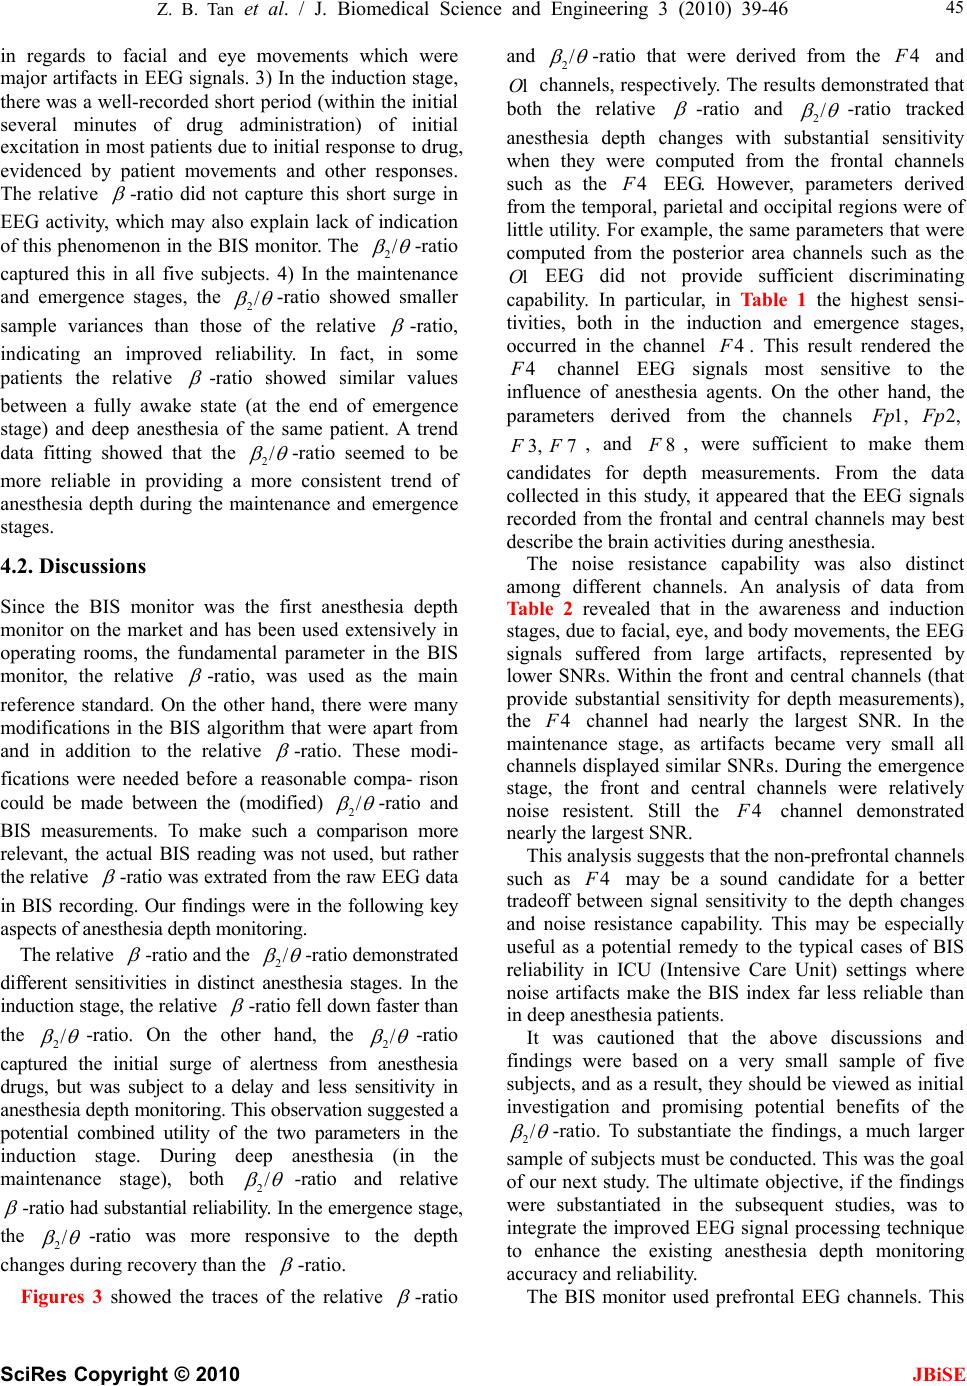 Z. B. Tan et al. / J. Biomedical Science and Engineering 3 (2010) 39-46 SciRes Copyright © 2010 JBiSE 45 in regards to facial and eye movements which were major artifacts in EEG signals. 3) In the induction stage, there was a well-recorded short period (within the initial several minutes of drug administration) of initial excitation in most patients due to initial response to drug, evidenced by patient movements and other responses. The relative -ratio did not capture this short surge in EEG activity, which may also explain lack of indication of this phenomenon in the BIS monitor. The / 2-ratio captured this in all five subjects. 4) In the maintenance and emergence stages, the / 2-ratio showed smaller sample variances than those of the relative -ratio, indicating an improved reliability. In fact, in some patients the relative -ratio showed similar values between a fully awake state (at the end of emergence stage) and deep anesthesia of the same patient. A trend data fitting showed that the / 2-ratio seemed to be more reliable in providing a more consistent trend of anesthesia depth during the maintenance and emergence stages. 4.2. Discussions Since the BIS monitor was the first anesthesia depth monitor on the market and has been used extensively in operating rooms, the fundamental parameter in the BIS monitor, the relative -ratio, was used as the main reference standard. On the other hand, there were many modifications in the BIS algorithm that were apart from and in addition to the relative -ratio. These modi- fications were needed before a reasonable compa- rison could be made between the (modified) / 2-ratio and BIS measurements. To make such a comparison more relevant, the actual BIS reading was not used, but rather the relative -ratio was extrated from the raw EEG data in BIS recording. Our findings were in the following key aspects of anesthesia depth monitoring. The relative -ratio and the / 2-ratio demonstrated different sensitivities in distinct anesthesia stages. In the induction stage, the relative -ratio fell down faster than the / 2-ratio. On the other hand, the / 2-ratio captured the initial surge of alertness from anesthesia drugs, but was subject to a delay and less sensitivity in anesthesia depth monitoring. This observation suggested a potential combined utility of the two parameters in the induction stage. During deep anesthesia (in the maintenance stage), both / 2-ratio and relative -ratio had substantial reliability. In the emergence stage, the / 2-ratio was more responsive to the depth changes during recovery than the -ratio. Figures 3 showed the traces of the relative -ratio and / 2-ratio that were derived from the 4 and channels, respectively. The results demonstrated that both the relative 1O -ratio and / 2-ratio tracked anesthesia depth changes with substantial sensitivity when they were computed from the frontal channels such as the 4 EEG. However, parameters derived from the temporal, parietal and occipital regions were of little utility. For example, the same parameters that were computed from the posterior area channels such as the EEG did not provide sufficient discriminating capability. In particular, in Table 1 the highest sensi- tivities, both in the induction and emergence stages, occurred in the channel 1O 4 . This result rendered the 4 channel EEG signals most sensitive to the influence of anesthesia agents. On the other hand, the parameters derived from the channels 1, p2, p , and , were sufficient to make them candidates for depth measurements. From the data collected in this study, it appeared that the EEG signals recorded from the frontal and central channels may best describe the brain activities during anesthesia. 7F 4 3,F8F The noise resistance capability was also distinct among different channels. An analysis of data from Table 2 revealed that in the awareness and induction stages, due to facial, eye, and body movements, the EEG signals suffered from large artifacts, represented by lower SNRs. Within the front and central channels (that provide substantial sensitivity for depth measurements), the channel had nearly the largest SNR. In the maintenance stage, as artifacts became very small all channels displayed similar SNRs. During the emergence stage, the front and central channels were relatively noise resistent. Still the 4 channel demonstrated nearly the largest SNR. This analysis suggests that the non-prefrontal channels such as 4 may be a sound candidate for a better tradeoff between signal sensitivity to the depth changes and noise resistance capability. This may be especially useful as a potential remedy to the typical cases of BIS reliability in ICU (Intensive Care Unit) settings where noise artifacts make the BIS index far less reliable than in deep anesthesia patients. It was cautioned that the above discussions and findings were based on a very small sample of five subjects, and as a result, they should be viewed as initial investigation and promising potential benefits of the / 2-ratio. To substantiate the findings, a much larger sample of subjects must be conducted. This was the goal of our next study. The ultimate objective, if the findings were substantiated in the subsequent studies, was to integrate the improved EEG signal processing technique to enhance the existing anesthesia depth monitoring accuracy and reliability. The BIS monitor used prefrontal EEG channels. This 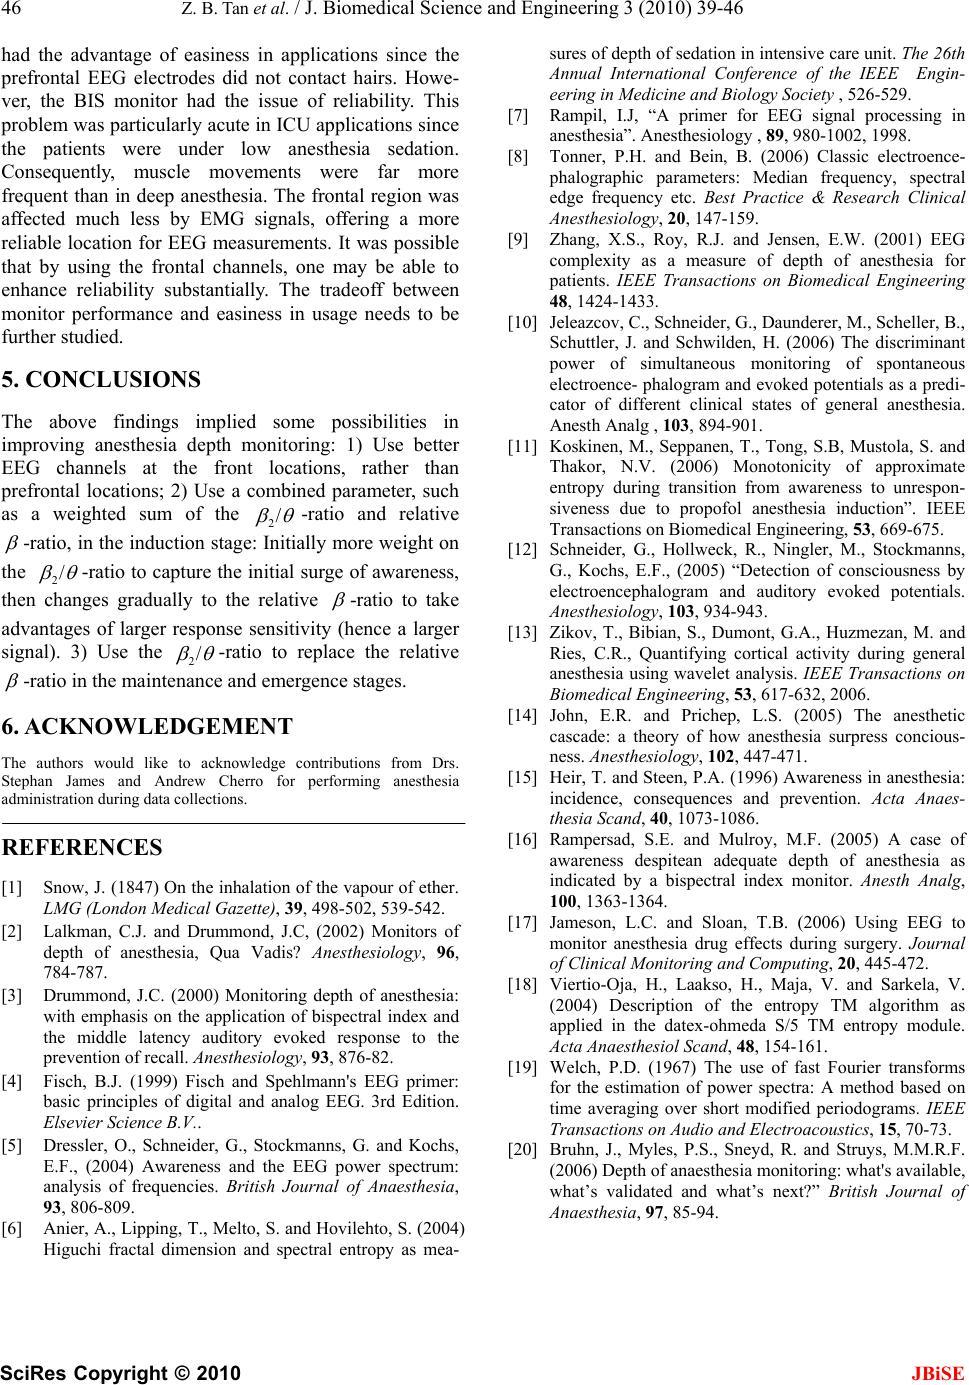 46 Z. B. Tan et al. / J. Biomedical Science and Engineering 3 (2010) 39-46 SciRes Copyright © 2010 had the advantage of easiness in applications since the prefrontal EEG electrodes did not contact hairs. Howe- ver, the BIS monitor had the issue of reliability. This problem was particularly acute in ICU applications since the patients were under low anesthesia sedation. Consequently, muscle movements were far more frequent than in deep anesthesia. The frontal region was affected much less by EMG signals, offering a more reliable location for EEG measurements. It was possible that by using the frontal channels, one may be able to enhance reliability substantially. The tradeoff between monitor performance and easiness in usage needs to be further studied. JBiSE 5. CONCLUSIONS The above findings implied some possibilities in improving anesthesia depth monitoring: 1) Use better EEG channels at the front locations, rather than prefrontal locations; 2) Use a combined parameter, such as a weighted sum of the / 2-ratio and relative -ratio, in the induction stage: Initially more weight on the / 2-ratio to capture the initial surge of awareness, then changes gradually to the relative -ratio to take advantages of larger response sensitivity (hence a larger signal). 3) Use the / 2-ratio to replace the relative -ratio in the maintenance and emergence stages. 6. ACKNOWLEDGEMENT The authors would like to acknowledge contributions from Drs. Stephan James and Andrew Cherro for performing anesthesia administration during data collections. REFERENCES [1] Snow, J. (1847) On the inhalation of the vapour of ether. LMG (London Medical Gazette), 39, 498-502, 539-542. [2] Lalkman, C.J. and Drummond, J.C, (2002) Monitors of depth of anesthesia, Qua Vadis? Anesthesiology, 96, 784-787. [3] Drummond, J.C. (2000) Monitoring depth of anesthesia: with emphasis on the application of bispectral index and the middle latency auditory evoked response to the prevention of recall. Anesthesiology, 93, 876-82. [4] Fisch, B.J. (1999) Fisch and Spehlmann's EEG primer: basic principles of digital and analog EEG. 3rd Edition. Elsevier Science B.V.. [5] Dressler, O., Schneider, G., Stockmanns, G. and Kochs, E.F., (2004) Awareness and the EEG power spectrum: analysis of frequencies. British Journal of Anaesthesia, 93, 806-809. [6] Anier, A., Lipping, T., Melto, S. and Hovilehto, S. (2004) Higuchi fractal dimension and spectral entropy as mea- sures of depth of sedation in intensive care unit. The 26th Annual International Conference of the IEEE Engin- eering in Medicine and Biology Society , 526-529. [7] Rampil, I.J, “A primer for EEG signal processing in anesthesia”. Anesthesiology , 89, 980-1002, 1998. [8] Tonner, P.H. and Bein, B. (2006) Classic electroence- phalographic parameters: Median frequency, spectral edge frequency etc. Best Practice & Research Clinical Anesthesiology, 20, 147-159. [9] Zhang, X.S., Roy, R.J. and Jensen, E.W. (2001) EEG complexity as a measure of depth of anesthesia for patients. IEEE Transactions on Biomedical Engineering 48, 1424-1433. [10] Jeleazcov, C., Schneider, G., Daunderer, M., Scheller, B., Schuttler, J. and Schwilden, H. (2006) The discriminant power of simultaneous monitoring of spontaneous electroence- phalogram and evoked potentials as a predi- cator of different clinical states of general anesthesia. Anesth Analg , 103, 894-901. [11] Koskinen, M., Seppanen, T., Tong, S.B, Mustola, S. and Thakor, N.V. (2006) Monotonicity of approximate entropy during transition from awareness to unrespon- siveness due to propofol anesthesia induction”. IEEE Transactions on Biomedical Engineering, 53, 669-675. [12] Schneider, G., Hollweck, R., Ningler, M., Stockmanns, G., Kochs, E.F., (2005) “Detection of consciousness by electroencephalogram and auditory evoked potentials. Anesthesiology, 103, 934-943. [13] Zikov, T., Bibian, S., Dumont, G.A., Huzmezan, M. and Ries, C.R., Quantifying cortical activity during general anesthesia using wavelet analysis. IEEE Transactions on Biomedical Engineering, 53, 617-632, 2006. [14] John, E.R. and Prichep, L.S. (2005) The anesthetic cascade: a theory of how anesthesia surpress concious- ness. Anesthesiology, 102, 447-471. [15] Heir, T. and Steen, P.A. (1996) Awareness in anesthesia: incidence, consequences and prevention. Acta Anaes- thesia Scand, 40, 1073-1086. [16] Rampersad, S.E. and Mulroy, M.F. (2005) A case of awareness despitean adequate depth of anesthesia as indicated by a bispectral index monitor. Anesth Analg, 100, 1363-1364. [17] Jameson, L.C. and Sloan, T.B. (2006) Using EEG to monitor anesthesia drug effects during surgery. Journal of Clinical Monitoring and Computing, 20, 445-472. [18] Viertio-Oja, H., Laakso, H., Maja, V. and Sarkela, V. (2004) Description of the entropy TM algorithm as applied in the datex-ohmeda S/5 TM entropy module. Acta Anaesthesiol Scand, 48, 154-161. [19] Welch, P.D. (1967) The use of fast Fourier transforms for the estimation of power spectra: A method based on time averaging over short modified periodograms. IEEE Transactions on Audio and Electroacoustics, 15, 70-73. [20] Bruhn, J., Myles, P.S., Sneyd, R. and Struys, M.M.R.F. (2006) Depth of anaesthesia monitoring: what's available, what’s validated and what’s next?” British Journal of Anaesthesia, 97, 85-94.
|