Paper Menu >>
Journal Menu >>
 Vol.1, No.4, 330-331 (2009) Health doi:10.4236/health.2009.14054 SciRes Copyright © 2009 Openly accessible at http://www.scirp.org/journal/HEALTH/ Airborne particles and asthma: a biophysical model Ming Yang, Yixing Wang Department of Botany, Oklahoma State University, 104 Life Sciences East, Stillwater, Oklahoma 74078, USA; ming.yang@okstate.edu Received 9 October 2009 revised 10 November 2009; accepted 12 November 2009. ABSTRACT Airborne particles can trigger asthma when reaching certain threshold concentrations that vary by a few to several thousand times among different particles. The underlying mechanism for the variation is unknown. Here, based on common knowledge and observations, we pro- pose that the potency of an airborne particle in causing asthma correlates positively with the weight of the particle and inversely with the friction coefficient between the particle and the airway epithelium. This model may lead to new approaches for investigating the asthma phe- nomenon, and to practical applications for re- ducing the prevalence of asthma. Keywords: Pollen; Spores, Allergens; Surface roughness; Environment 1. INTRODUCTION It is known that different species of pollens and mold spores differ greatly in their ability to trigger asthma, as profoundly represented by the scale of pollen and mold spore count developed by the National Allergy Bureau (hereafter referred to as the NAB scale) [1]. Given that pollens and mold spores, at least within their own re- spective categories, are similar in chemical composition, it remains unexplained why such variation occurs. Induction of asthma by airborne particles involves both biophysical and biochemical responses. The earliest response is that the ciliated airway epithelial cells physically move the particles out of the respiration sys- tem upon the particle invasion. The lateral motion of the particles relative to the epithelium can be envisioned as a physical process relying on friction between two solid surfaces separated by a layer of liquid (also called lubri- cated friction). Of two particles having the same friction coefficient with the airway epithelium, the heavier one is expected to be less efficiently removed than the lighter one. Extending from this argument, a particle with a larger friction coefficient will be more efficiently re- moved than a particle of the same weight but with a smaller friction coefficient. In other words, a particle with smooth surface may tend to slip off the cilia of the epithelium. 2. THE MODEL It is proposed that the physical (excluding chemical) potency (P) of an airborne particle in inducing asthma is a function of the particle count (n) in a unit space, the weight of the particle (w), and the friction coefficient (µ) between the airway epithelial cells and the particle, which can be expressed by the following equation. P = nw/µ (1) 3. EVIDENCE SUPPORTING THE MODEL The NAB scale indicates that, for mold spores to be a significant trouble-maker, the count should be about 13,000-49,999 per cubic meter, whereas it is about 20-199, 50-499, and 90-1499 per cubic meter for grass pollens, weed pollens, and tree pollens, respectively. These numbers suggest that the abilities of these parti- cles in causing allergy and asthma vary by several to about 10 times within a class and several to several thousand times between classes. It is known that mold spores are usually about 3-5 µm in diameter and airborne pollens are usually about 20-90 µm in diameter, which can be translated into a few dozens to several thousand times differences in weight between mold spores and pollens, a range consistent with the range of variations in the ability to cause allergy and asthma between mold spores and pollens. Moreover, within each class of the particles, the diameter variation is estimated to be typi- cally in the range of one to several times, which are translated into single to double-digit fold differences in weight. Therefore, the differences in particle size could, to a large extent, account for the variation in the ability to cause allergy and asthma within each class of parti- cles. To estimate the ranges of pollen size in different plant 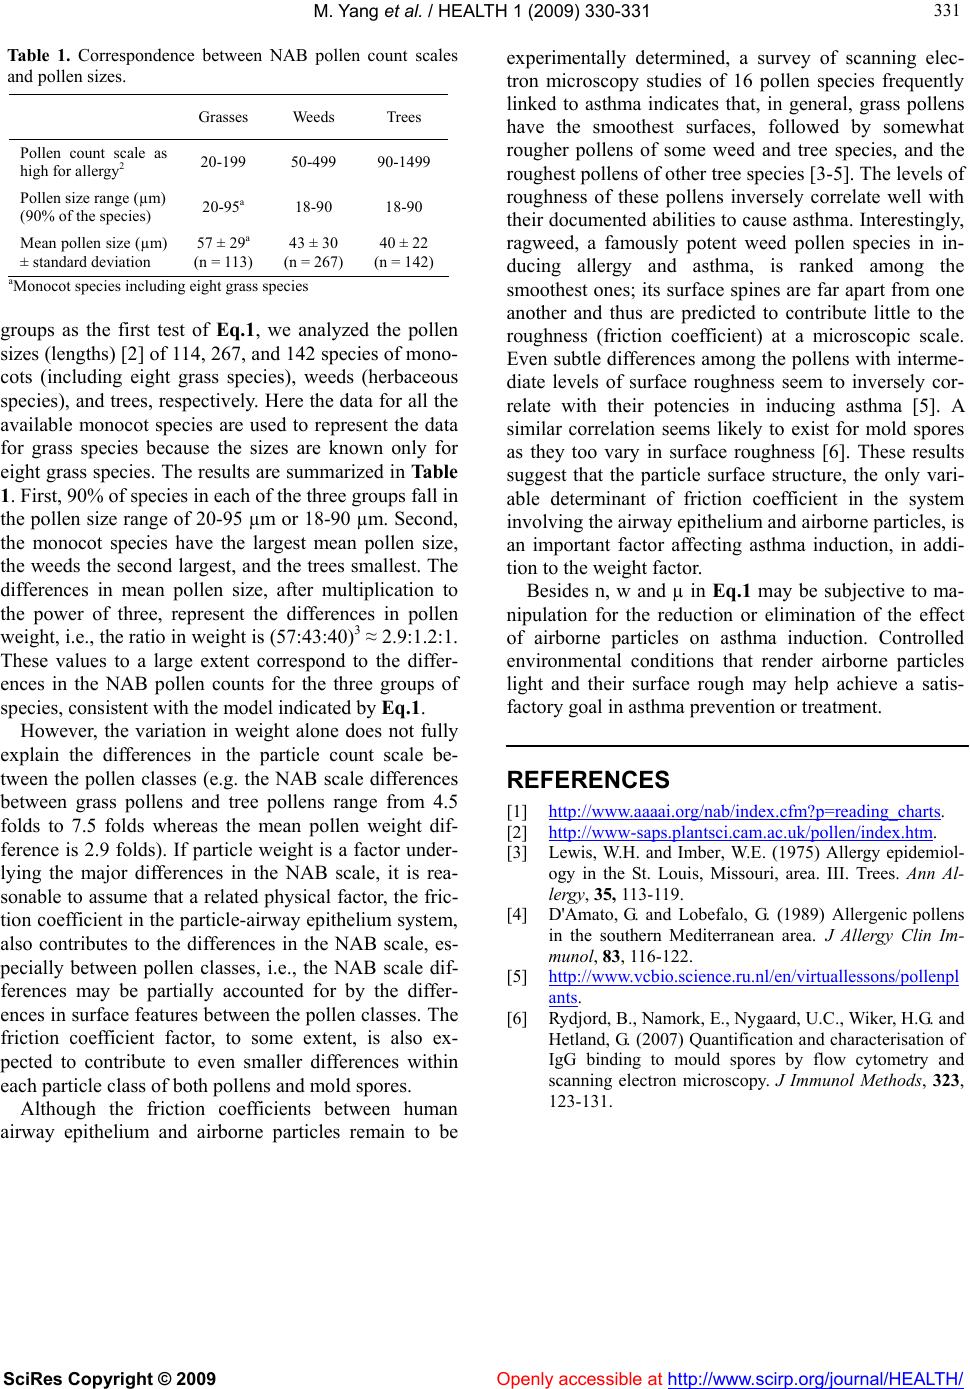 M. Yang et al. / HEALTH 1 (2009) 330-331 SciRes Copyright © 2009 Openly accessible at http://www.scirp.org/journal/HEALTH/ 331 331 Table 1. Correspondence between NAB pollen count scales and pollen sizes. Grasses Weeds Trees Pollen count scale as high for allergy2 20-199 50-499 90-1499 Pollen size range (µm) (90% of the species) 20-95a 18-90 18-90 Mean pollen size (µm) ± standard deviation 57 ± 29a (n = 113) 43 ± 30 (n = 267) 40 ± 22 (n = 142) aMonocot species including eight grass species groups as the first test of Eq.1, we analyzed the pollen sizes (lengths) [2] of 114, 267, and 142 species of mono- cots (including eight grass species), weeds (herbaceous species), and trees, respectively. Here the data for all the available monocot species are used to represent the data for grass species because the sizes are known only for eight grass species. The results are summarized in Table 1. First, 90% of species in each of the three groups fall in the pollen size range of 20-95 µm or 18-90 µm. Second, the monocot species have the largest mean pollen size, the weeds the second largest, and the trees smallest. The differences in mean pollen size, after multiplication to the power of three, represent the differences in pollen weight, i.e., the ratio in weight is (57:43:40)3 ≈ 2.9:1.2:1. These values to a large extent correspond to the differ- ences in the NAB pollen counts for the three groups of species, consistent with the model indicated by Eq.1. However, the variation in weight alone does not fully explain the differences in the particle count scale be- tween the pollen classes (e.g. the NAB scale differences between grass pollens and tree pollens range from 4.5 folds to 7.5 folds whereas the mean pollen weight dif- ference is 2.9 folds). If particle weight is a factor under- lying the major differences in the NAB scale, it is rea- sonable to assume that a related physical factor, the fric- tion coefficient in the particle-airway epithelium system, also contributes to the differences in the NAB scale, es- pecially between pollen classes, i.e., the NAB scale dif- ferences may be partially accounted for by the differ- ences in surface features between the pollen classes. The friction coefficient factor, to some extent, is also ex- pected to contribute to even smaller differences within each particle class of both pollens and mold spores. Although the friction coefficients between human airway epithelium and airborne particles remain to be experimentally determined, a survey of scanning elec- tron microscopy studies of 16 pollen species frequently linked to asthma indicates that, in general, grass pollens have the smoothest surfaces, followed by somewhat rougher pollens of some weed and tree species, and the roughest pollens of other tree species [3-5]. The levels of roughness of these pollens inversely correlate well with their documented abilities to cause asthma. Interestingly, ragweed, a famously potent weed pollen species in in- ducing allergy and asthma, is ranked among the smoothest ones; its surface spines are far apart from one another and thus are predicted to contribute little to the roughness (friction coefficient) at a microscopic scale. Even subtle differences among the pollens with interme- diate levels of surface roughness seem to inversely cor- relate with their potencies in inducing asthma [5]. A similar correlation seems likely to exist for mold spores as they too vary in surface roughness [6]. These results suggest that the particle surface structure, the only vari- able determinant of friction coefficient in the system involving the airway epithelium and airborne particles, is an important factor affecting asthma induction, in addi- tion to the weight factor. Besides n, w and µ in Eq.1 may be subjective to ma- nipulation for the reduction or elimination of the effect of airborne particles on asthma induction. Controlled environmental conditions that render airborne particles light and their surface rough may help achieve a satis- factory goal in asthma prevention or treatment. REFERENCES [1] http://www.aaaai.org/nab/index.cfm?p=reading_charts. [2] http://www-saps.plantsci.cam.ac.uk/pollen/index.htm. [3] Lewis, W.H. and Imber, W.E. (1975) Allergy epidemiol- ogy in the St. Louis, Missouri, area. III. Trees. Ann Al- lergy, 35, 113-119. [4] D'Amato, G. and Lobefalo, G. (1989) Allergenic pollens in the southern Mediterranean area. J Allergy Clin Im- munol, 83, 116-122. [5] http://www.vcbio.science.ru.nl/en/virtuallessons/pollenpl ants. [6] Rydjord, B., Namork, E., Nygaard, U.C., Wiker, H.G. and Hetland, G. (2007) Quantification and characterisation of IgG binding to mould spores by flow cytometry and scanning electron microscopy. J Immunol Methods, 323, 123-131. |