Paper Menu >>
Journal Menu >>
 Vol.1, No.4, 304-312 (2009) doi:10.4236/health.2009.14050 SciRes Copyright © 2009 Openly accessible at http://www.scirp.org/journal/HEALTH/ HEALTH Cost-benefit analysis of screening for diabetic retinopathy among Chinese type 2 diabetes: decision from different perspectives of a p opulation-based study in Kinmen, Taiwan Ching-Ching Peng1, Pesus Chou2, Tao-Hsin Tung1,3, Wu-Hsiung Chien1, Fenq-Lih Lee4, Shih-Jen Chen4, Shih-Tzer Tsai5, Chi-Ming Liu1,2, Jorn-Hon Liu1,6* 1Cheng Hsin General Hospital, Taipei, Taiwan, China; ch2876@chgh.org.tw 2Community Medicine Research Center & Institute of Public Health, National Yang-Ming University, Taipei, Taiwan, China 3Faculty of Public Health, School of Medicine, Fu-Jen Catholic University, Taipei, Taiwan, China 4Department of O p hthalmology, Ve terans General Hospital, Taipei, Taiwan, China 5Department of Medicine, Veterans General Hospital, Taipei, Taiwan, China 6Faculty of Medicine, School of Medicine, National Ya ng-Ming University, Taipei, Taiwan, China *Corresponding author Received 3 September 2009; revised 14 September 2009; accepted 15 September 2009. ABSTRACT The purpose of this study is to explore whether it is worthwhile to launch a routine diabetic retinopathy (DR) screening for blindness pre- vention among Chinese type 2 diabetes from different perspective based on the popula- tion-based study in Kinmen, Taiwan. A total of 971 community dwelling adults previously di- agnosed with type 2 diabetes in 1991-1993 un- derwent DR screening in 1999-2002 by a panel of ophthalmologists using on-site indirect oph- thalmoscopy and 45-degree color fundus retinal photographs. The cost-benefit analysis is used to evaluate the DR screening. In terms of bene- fit-cost ratio, the different screening programs for DR could save New Taiwan Dollars (NTD) from 14.38 to 36.83 in discounted costs for each dollar incurred in different screening years from the societal viewpoint for Taiwan and save NTD from 0.81 to 1.80 in different screening years from health care payer’s perspective. The av- erage estimate of willingness-to-pay to translate into benefit yields NTD from 937.8 to 4,689 be- nefits per case due to DR screening in different screening years during 10-year follow-up. The net present value of the DR screening w ere NTD from -167,318 to -307,251.2 in different screening years. In conclusion, it is worthwhile to initial a routine DR screening of Chinese type 2 d iabetes for blindness prevention from the societal per- spective but not from consumer decision based on the willingness-to-pay perspective. Keywords: Type 2 Diabetes; Diabetic Retinopathy; Cost-Benefit Analysis; Population-Based Study 1. INTRODUCTION In developed countries, diabetic retinopathy (DR) is a major microvascular disease and is associated with in- creased visual impairment in type 2 diabetics [1]. In Taiwan, previous community-based studies showed that the prevalence and annual incidence density of DR were an estimated 15% to 45% and 6.62x10⁻²/year (95%CI: 5.36x10⁻²/year—8.06x10-2/year), respectively [2,3]. Since the average time from development of no DR to blind- ness is approximately 26.5 years in persons with type 2 diabetes, assessing the progression of DR by screening is a worthwhile preventive measure [4]. Whether screening for DR is worthwhile is also con- tingent on whether subjects are willing to pay the eye screening program that would decrease the risk of blindness. Benefit due to the reduction of severe com- plication in cost-benefit analysis is often measured by the human capital approach for which the value of eye screening program is measured by its effect on the pa- tient’s sight-time earning. According to welfare eco- nomic theory, the benefit to an individual of a service or an intervention is defined as that individual’s maximum willingness to pay (WTP) for the service or intervention [5]. WTP is a contingent valuation and involves using a hypothetical survey to directly ask individuals the maximum amount they are willing to pay for the com- modity in question [6,7]. Due to the medical resources are limited, the government is in a dilemma about  C. C. Peng et al. / HEALTH 1 (2009) 304-312 SciRes Copyright © 2009 Openly accessible at http://www.scirp.org/journal/HEALTH/ 305 305 whether it is necessary to popularize the eye screening programs among type 2 diabetes into a nationwide pro- gram. Our previous study have showed that degree of DR was the independent factor affecting WTP values in DR screening among community-dwelling adults with type 2 diabetes [8]. The purpose of this study is further to conduct a cost-benefit analysis to determine whether it is worthwhile to launch eye screening program for blindness prevention among population-based adults diagnosed with type 2 diabetes in Kinmen, Taiwan. 2. METHODS 2.1. Study Design and Subjects The pro cedu r es fo r co st - b en ef it analysis of DR screening among community dwelling patients with type 2 diabe- tes in 1999-2003 showed in Figure 1. Data used in this study were derived from a population-based screening for type 2 diabetes targeted to subjects aged 30 years or more in Kinmen, Taiwan, between January 1991 and December 1993. Details of the study design and execu- tion have been described in full elsewhere [9]. Identifi- cation for type 2 diabetes was based on the WHO 1999 definition [10], that is, su bjects with FPG 126mg/dl or 2-hr postload glucose concentration ≥ 200mg/dl were defined as having type 2 diabetes. Subjects with a his- tory of type 2 diabetes and who received medication were defined as known cases. A total of 1,123 cases of type 2 diabetes aged 30 and over were found based on the population survey carried out by the Yang-Ming Crusade, which was organized from the medical students of the National Yang-Ming University, Taipei, Taiwan. The screened diabetic subjects then were referred to the region hospital for further treatment and follow-up rou- tinely. Of 1,123 subjects with type 2 diabetes, 152 emi- grated or died between 1994 and 1998. After excluding these subjects, the remaining 971 had the uptake of fun- dus check-up annually since 1999. A panel of popula- tion-based follow-up screening of DR was then con- ducted annually from 1999 to 2002. These 971 partici- pants were invited to receive eye screening by invitation letter or calls. Based on the eye screening results, differ- ent treatment strategies were used, that is, routine fol- low-up for patients with mild or moderate DR and laser photocoagulation for patients with severe DR. In addi- tion, informed consent was obtained from all participan ts before the investigation began. Access to personal re- cords was approved by the hospital human subjects re- view board at Cheng-Hsin General Hospital, Taipei, Taiwan. We initiated a DR screening program after six years of mass screening because Kinmen is an offshore island from Taiwan lacking medical resources. Here, DR screening requires mobilizing manpower and equipment, coordinating between clinical personnel and field work, and transporting to the island. By 1999, a team for DR screening was successfully organized, including 4 well- trained senior ophthalmologists from Veterans General Hospital, Taipei, 4 clinical nurses, and 20 medical stu- dents from the Yang-Ming Crusade. 2.2. Screening and Diagnosis for Diabetic Retinopathy The diagnosis of DR was based on the on-site direct and indirect ophthalmoscopic examination and the sin- gle-field fundus photographs that analyzed later. On-site screening was conducted by two ophthalmologists using direct and indirect ophthalmoscopy after pupil dilatation with topical 0.5% mydriacyl. The graders wrote down the diagnosis and marked the findings in the record. Then the subj ects were taken on e 45-d egree color fu ndus photography with Polaroid 600 films (Polaroid, Nether- land) centered at macula in each eye using Topcon fun- dus camera (TRC-50VT, Tokyo, Japan). The single-field photographs were then printed out and filed. Grading of the photographs was done by two well-trained senior ophthalmologists beginning no later than one month after the screening. The final grading of the DR depends on the summed interpretation of the photographs and the recorded ophthalmoscopic gradings. From the Reti- nopathy Disease Severity Scale, diabetic subjects were classified according to the most severe changes in the worse eye [11]. In addition, legal blindness was defined as a best-corrected visual acuity of 0.1 (6/60) or worse in the better eye [8]. A pilot study was performed in 50 randomly selected type 2 diabetic patients to set up the consistent diagnosis of DR among ophthalmologists. The kappa statistic of 0.73 (95%CI: 0.48—0.98) between the observers re- vealed a good interobs erver reliability. 2.3. Cost-Benefit Analysis of Screening for Diabetic Retinopathy 2.3.1. Markov Decision Model of Screening for Diabetic Ret inopathy In this study, the cost-benefit analysis tool of screening for DR among subjects with type 2 diabetes was based on TreeAge software (DATA 3.5, Tree-Age, Inc., Wil- liamstown MA) for medical decision analysis. A deci- sion analysis using the Markov Decision Model was constructed to compare different screening regimes for DR with no screening group (see Figure 2). The as- sumption of no screening group was that except eye screening, diabetic patients still received routine medical care until they become blind. Accord ing to the theory of stochastic process, the Markov chain model is deter- mined by both the initial state and the transition matrix. The model starts from the decision to screen or not to screen and the overall expected value is based on ex- pected values of end nodes rather than all nodes. For each decision, there are six states of disease natural his 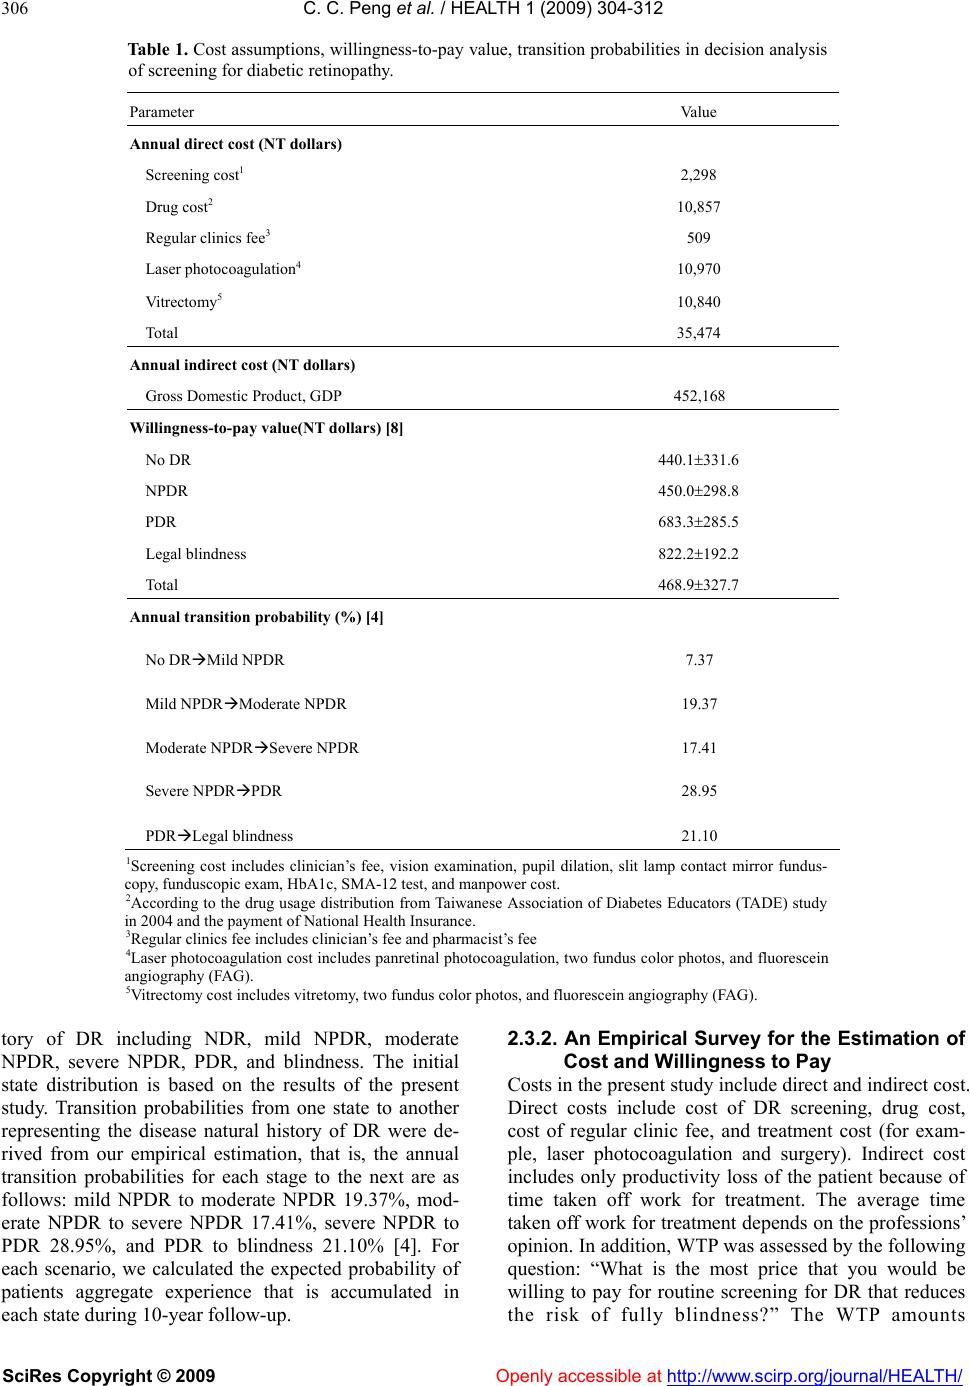 C. C. Peng et al. / HEALTH 1 (2009) 304-312 SciRes Copyright © 2009 Openly accessible at http://www.scirp.org/journal/HEALTH/ 306 Table 1. Cost assumptions, willingness-to-pay value, transition probabilities in decision analysis of screening for diabetic retinopathy. Parameter Value Annual direct cost (NT dollars) Screening cost1 2,298 Drug cost2 10,857 Regular clinics fee3 509 Laser photocoagulation4 10,970 Vitrectomy5 10,840 Total 35,474 Annual indirect cost (NT dollars) Gross Domestic Product, GDP 452,168 Willingness-to-pay value(NT dollars) [8] No DR 440.1331.6 NPDR 450.0298.8 PDR 683.3285.5 Legal blindness 822.2192.2 Total 468.9327.7 Annual transition probability (%) [4] No DRMild NPDR 7.37 Mild NPDRModerate NPDR 19.37 Moderate NPDRSevere NPDR 17.41 Severe NPDRPDR 28.95 PDRLegal blindness 21.10 1Screening cost includes clinician’s fee, vision examination, pupil dilation, slit lamp contact mirror fundus- copy, funduscopic exam, HbA1c, SMA-12 test , and manpower cost. 2According to the drug usage distribution from Taiwanese Association of Diabetes Educators (TADE) study in 2004 and the payment of N atio nal Heal th Insurance. 3Regular clinics fee includes clinician’s fee and pharmacist’s fee 4Laser photocoagulation cost includes panretinal photocoagulation, two fundus color photos, and fluorescein angiography (FAG). 5Vitrectomy cost includes vitretomy, two fundus color photos, and fluorescein angiography (FAG). tory of DR including NDR, mild NPDR, moderate NPDR, severe NPDR, PDR, and blindness. The initial state distribution is based on the results of the present study. Transition probabilities from one state to another representing the disease natural history of DR were de- rived from our empirical estimation, that is, the annual transition probabilities for each stage to the next are as follows: mild NPDR to moderate NPDR 19.37%, mod- erate NPDR to severe NPDR 17.41%, severe NPDR to PDR 28.95%, and PDR to blindness 21.10% [4]. For each scenario, we calculated the expected probability of patients aggregate experience that is accumulated in each state during 10-year foll ow-up. 2.3.2. An Empirical Survey for the Estimation of Cost and Willingness to Pay Costs in the present study include direct and indirect cost. Direct costs include cost of DR screening, drug cost, cost of regular clinic fee, and treatment cost (for exam- ple, laser photocoagulation and surgery). Indirect cost includes only productivity loss of the patient because of time taken off work for treatment. The average time taken off work for treatment depends on the professions’ opinion. In addition, WTP was assessed by the following question: “What is the most price that you would be willing to pay for routine screening for DR that reduces the risk of fully blindness?” The WTP amounts 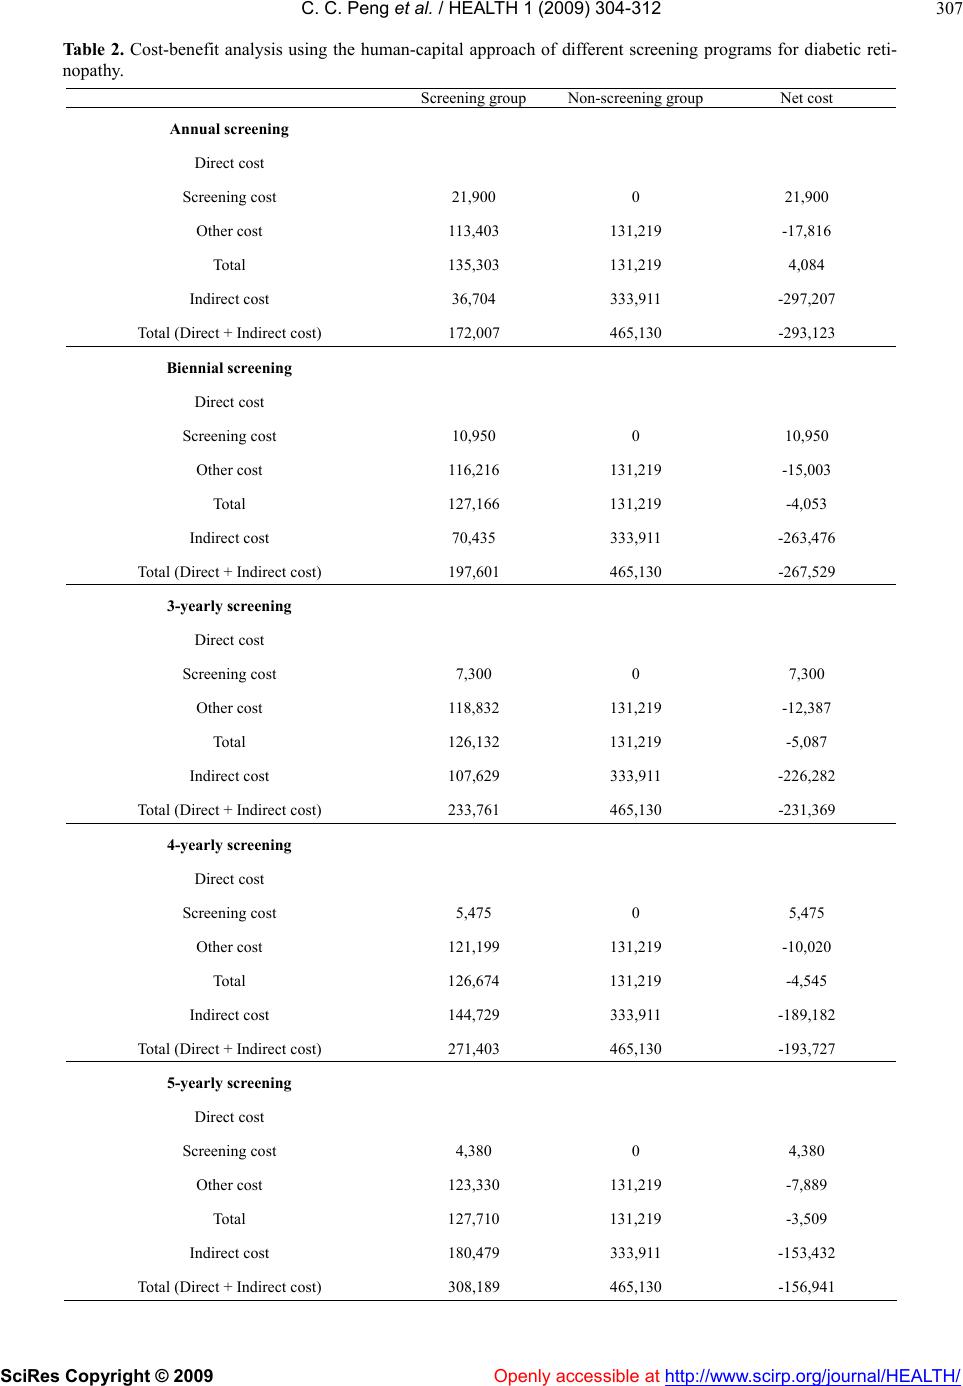 C. C. Peng et al. / HEALTH 1 (2009) 304-312 SciRes Copyright © 2009 Openly accessible at http://www.scirp.org/journal/HEALTH/ 307 Table 2 . Cost-benefit analysis using the human-capital approach of different screening programs for diabetic reti- nopathy. Screening group Non-screening groupNet cost Annual screening Direct cost Screening cost 21,900 0 21,900 Other cost 113,403 131,219 -17,816 Total 135,303 131,219 4,084 Indirect cost 36,704 333,911 -297,207 Total (Direct + Indirect cost) 172,007 465,130 -293,123 Biennial screening Direct cost Screening cost 10,950 0 10,950 Other cost 116,216 131,219 -15,003 Total 127,166 131,219 -4,053 Indirect cost 70,435 333,911 -263,476 Total (Direct + Indirect cost) 197,601 465,130 -267,529 3-yearly screening Direct cost Screening cost 7,300 0 7,300 Other cost 118,832 131,219 -12,387 Total 126,132 131,219 -5,087 Indirect cost 107,629 333,911 -226,282 Total (Direct + Indirect cost) 233,761 465,130 -231,369 4-yearly screening Direct cost Screening cost 5,475 0 5,475 Other cost 121,199 131,219 -10,020 Total 126,674 131,219 -4,545 Indirect cost 144,729 333,911 -189,182 Total (Direct + Indirect cost) 271,403 465,130 -193,727 5-yearly screening Direct cost Screening cost 4,380 0 4,380 Other cost 123,330 131,219 -7,889 Total 127,710 131,219 -3,509 Indirect cost 180,479 333,911 -153,432 Total (Direct + Indirect cost) 308,189 465,130 -156,941  C. C. Peng et al. / HEALTH 1 (2009) 304-312 SciRes Copyright © 2009 Openly accessible at http://www.scirp.org/journal/HEALTH/ 308 Table 3. The benefit-cost ratio estimates of different screening programs for diabetic retinopathy. Benefit-cost ratio Payer’s perspective Society perspective Annual screening 0.81 (17,816/21,900) 14.38 ((17,816+297,207)/21,900) Biennial screening 1.37 (15,003/10,950) 25.43 ((15,003+263,476)/10,950) 3-yearly screening 1.70 (12,387/7,300) 32.69 ((12,387+226,282)/7,300) 4-yearly screening 1.83 (10,020/5,475) 36.38 ((10,020+189,182)/5,475) 5-yearly screening 1.80 (7,889/4,380) 36.83 ((7,889+153,432)/4,380) Figure 1. The procedure of cost-benefit analysis of screening for diabetic retinopathy among type 2 diabetics in Kinmen. Cost-benefit analysis Cost-benefit analysis of diabetic retinopathy screening Laser photocoagulation patients with severe DR Routine follow up for patients with mild or moderate DR 725 Type 2 diabetes received DR screening Screening for diabeti retin opathy (1999-2002) DR screening for Type 2 diabetics in 1999-2002 (n=97 1) Loss to follow-up (n=246) Routine treatment and follow up by region hosp ital Type 2 diabetes (n=1,123) WHO (1999) criteria 1994-1998 Migrated out or death (n=152) Screening for type 2 diabetes (1991-1993) 1991-1993 A community-based screening regime f or type 2 diabetes (n=12,489)  C. C. Peng et al. / HEALTH 1 (2009) 304-312 SciRes Copyright © 2009 http://www.scirp.org/journal/HEALTH/ 309 309 mildNPDR N D R NDR others others others others ot hers others others others others others others others others others others others others others others others PDR PDR PDR PDR PDR PDR PDR PDR PDR PDR PDR PDR PDR PDR PDR PDR PDR N onNDR N onNDR N onNDR N onNDR N onND R N onNDR Blindness Blindness Blindness Blindness Blindness Blindness Blindness Blindness Blindness Blindness Blindness Blindness Blindness Blindness Blindness Blindness Blindness severeNPDR ModerateNPDR severeNPDR ModerateNPDR severeNPDR ModerateNPDR severeNPDR MildNPDR moderateNPDR MildNPDR moderateNPDR MildNPDR moderateNPD R MildNPDR moderateNPDR MildNPDR moderateNPDR MildNPDR moderateNPD R MildNPDR moderateNPD R N D R mildNPD R N D R mildNPDR N DR N DR N DR mildNPDR Moderate N PDR Severe N PD R PDR PDR PDR Blindness Blindness Blindness N DR N D R N DR N D R N D R N DR N D R N DR N DR Severe N PD R Moderate N PDR mildNPDR mildNPDR mildNPDR mildNPDR mildNPDR others others PDR Blindness PDR Blindness severeNPDR severeNPDR severeNPDR severeNPDR severeNPDR severeNPDR severeNPDR N on- Screening Group Screening Group Scr eening for Retinopathy in Type ІІ DM patients mildNPDR moderateNPDR NDR others N onND R others N onNDR mildNPDR N D R ModerateNPDR sever eNPDR ModerateNPDR severeNP DR severeNPDR ModerateNPDR ModerateNPDR severeNPDR sever eNPDR ModerateNPDR Figure 2. Markov decision model for two options, screening and non-screening for diabetic retinopathy. for a routine screening for DR were elicited by dis- crete-choice, that is, subjects were presented a single price for a screening program that would yield a speci- fied health change. Subjects either accept or reject the price. By randomly varying the price across a number of different subsamples, the mean WTP could be estimated [8]. To maintain consistency of interview quality, all information on WTP measurements was also collected by one well-trained interviewer. All costs are expressed as New Taiwan Dollars (NTD). 2.3.3. Cost-Benefit Analysis and Discount Rate Using the human-capital approach, net cost (saving) for different screening programs of DR, taking direct cost and indirect cost into account, was calculated. Bene- fit-cost ratios were calculated as the reduction blindness costs divided by the cost of the screening programs. Us- ing WTP approach, net present value (NPV) was also calculated on the basis of the total benefit (calculated by the WTP method) minus screening cost of DR. To take time preference into account, that is, receiving benefit Openly accessible at  C. C. Peng et al. / HEALTH 1 (2009) 304-312 SciRes Copyright © 2009 Openly accessible at http://www.scirp.org/journal/HEALTH/ 310 earlier and incurring cost later, we discounted all costs and benefits to the present value at 5% annually. 3. RESULTS The annual direct cost, annual indirect cost, WTP value, and annual transition probability in decision analysis of DR screening are shown in Table 1. Direct costs include screening cost, drug cost, regular clinics’ fees, laser photocoagulation, and vitrectomy. Indirect cost repre- sents lost productivity according to patient’s disease state, estimated using the Gross Domestic Product (GDP) value in 2004. Table 2 shows total discounted direct costs and indirect costs using the human capital approach. Annual screening, biennial screening, 3-yearly screening, 4-yearly screening, and 5-yearly screening regimens could save NTD17,816, NTD15,003, NTD12,387, NTD10,020, and NTD7,889 per case in discounted direct costs (except screening cost), res p e ct iv e l y. From payer’s perspective, the discounted net total direct costs for DR screening program were NTD 4,084, NTD-4,053, NTD-5,087, NTD-4,545, and NTD- 3,509 for annual screening, biennial screening, 3-yearly screening, 4-yearly screening, and 5-yearly screening, re- spectively. The discounted indirect costs saved per case by DR screening program were NTD297,207, NTD 263,476, NTD226,282, NTD189,182, and NTD153,432 for annual screening, biennial screening, 3-yearly screening, 4-yearly screening, and 5-yearly screening, respectively. Thi s yi el d NTD293,123 (annual screening), NTD267,529 (biennial screening), NTD231,369 (3-yearly screening), NTD 193,727 (4-y e a r l y s c ree ning ) , an d NTD156,941 (5-yea r l y screening) net saving per case due to DR screening pro- gram from the societal perspective. As Table 3 shows, DR screening programs could save NTD14.38 (annual screening), NTD25.43 (biennial screening), NTD32.69 (3-yearly screening), NTD36.38 (4-yearly screening), and NTD36.83 (5-yearly screening) from the societal viewpoint and save NTD0.81 (annual screening), NTD1.37 (biennial screening), NTD1.70 (3- yearly screening), NTD1.83 (4-yearly screening), and NTD1.80 (5-yearly screening) in discounted costs for each NTD dollar incurred in DR screening programs from health care payer’s perspective. The average estimate of WTP in order to reduce blindness as shown in Table 1 is NTD468.9. Translating this figure into benefit yields NTD4,689 (annual screen- ing), NTD2,344.5 (biennial screening), NTD1,406.7 (3- yearly screening), NTD1,172.3 (4-yearly screening), and NTD 937.8 (5-yearly screening) benefit per case due to DR screening during 10-year follow-up. The NPV of the screening programs, taking indirect cost into account, were NTD-167,318, NTD-195,256.5, NTD-232,354.3, NTD-270,230.7, and NTD-307,251.2 of annual screen- ing, biennial screening, 3-yearly screening, 4-yearly screening, and 5-yearly screening, respectively. 4. DISCUSSION 4.1. Implications of Cost-Benefit Analysis for Diabetic Retinopathy Screening In Taiwan, few population-based studies have attempted to quantify the cost and benefit of DR screening pro- grams. The present study uses cost-benefit analysis to assess whether a DR screening program against non- screening group is worthwhile in Taiwan from different perspectives. The results indicate that indirect costs play an important role in the evaluation of the DR screening program. Annual screening program could save the most (NTD297,207) per case in discounted indirect costs compared with non-screening group. From health care payer’s perspective, the discounted net cost for annual screening was NTD4,084 per case. This indicates that the benefit from the annual screening program of DR can not outweigh the cost incurred in the DR screening program from health care payer’s perspective. Taking indirect cost into account, the NTD293,123 net saving per case suggest the annual screening program is rather worthwhile from the societal perspective. In addition, using the WTP approach, the present study shows it is not worthwhile to have screening for DR from the perspective of WTP due to the negative result of NPV value. It should be noted that the WTP approach is a contingent-valuation method that reflects consume surplus of getting DR screening. Since the mean estimate of WTP (NTD468.9) for the DR screen- ing program was far below the current expense for di- rect costs of DR screening (NTD2,190) per case. This suggests that they could not get any surplus from the purchase of screening program. This accounts for why the results of NPV are negative. If the estimate of WTP is raised to NTD2,500, this means that if people have to pay only NTD2,190 for benefits they value at NTD2,500 then they get a surplus of NTD310 from the purchase of screening for DR. Results from the WTP suggest that the amount diabetics in Kinmen are willing to pay for the screening program is lower than th e bene- fit they value. In terms of consumer decision based on the perspective of WTP, it may not be worthwhile to launch a DR screening program. 4.2. The Efficiency and Advantage for Routine Diabetic Retinopath y Screening The surveillance and treatment of diabetes-related com- plications should be part of routine care in all type 2 diabetes [4]. The benefits of DR screening rest on the additional time patients have to obtain treatment. If one wishes to reduce the loss of vision associated with DR,  C. C. Peng et al. / HEALTH 1 (2009) 304-312 SciRes Copyright © 2009 Openly accessible at http://www.scirp.org/journal/HEALTH/ 311 311 then performing the screening is more important than the type of screening used [12,13]. During the first year of DR screening, savings associated with preventing one single case of blindness could cover the cost of the screening program [12]. The threat of blindness is less severe in type 2 diabetes because DR progresses more slowly than in type 1 diabetes. Although the eye care program saved 21 sight-years [14], it was less efficient in patients with type 2 diabetes. The optimal screening interval is determined by the disease natural history with regard to the screening pol- icy [4]. Many evidence-based studies have showed that screening for and treating DR is extremely efficiency and cost-effective. From the health insurer’s viewpoint, routine screening and treatment of eye disease in dia- betic patients cost USD 3190 per QALY saved [15]. Duration of blin dness drops by 0.48 and 0.13 years with increase in year of onset of the disease whereas effec- tiveness decreases in type 2 diabetic patients [16]. Pre- vention screening programs aimed at improving eye care for type 2 diabetic patients results in both highly cost-effective health care and substantial federal budg- etary savings [15,17]. In addition, our previous studies have demonstrated that annual DR screening is the most effective and efficient screening schedule for reducing blindness compared to other screening intervals [4,17]. To take both cost and efficacy into consideration, many organizations such as the National Committee for Qual- ity Assurance, through Health Employer Data and In- formation Set (HEDIS) measures also recommends that annual eye examinations be used not only as a general guideline, but also as a quality standard in all patients with diabetes [18]. Better diabetes management such more strict adherence by diabetic patients and ophthal- mologists to best practice guidelines could have enor- mous protective impacts in cases of visual loss caused by DR [19]. 4.3. Methodological Considerations From the methodological viewpoint, although using a population-based follow-up study design could reduce selection bias and increase statistical power, using pri- mary information and calculating both direct and indi- rect costs help us estimate the true benefit of DR screening more closely than which has been possible before. There are still some critiques raised from this study. First, only three-year follow-up period, we could not have enough sample size to predict all of the effects of DR screening on disease variations. Second, we did not explicitly consider the sensitivity and specificity of the DR screening tests. Previous studies demonstrated that indirect ophthalmoscopy performed by ophthal- mologists has a sensitivity of approximately 85% [20], but this may approach 100% with newer slit lamp biomicroscopic techniques [21]. Retinal photography, an alternative detection method for DR among diabetic patients, has an overall sensitivity of approximately 85% [20]. That means the accuracy of DR diagnosis could be accepted. Third, although the Kappa value for the agreement of interobserver reliability seemed ac- ceptable [22], non-differential misclassification-bias identification still could have occurred. Fourth, we did not estimate the influence of covariates such as duration of type 2 diabetes or HbA1c level . Because severe and very severe NPDR without macular edema is associated with high risk of progression to PDR, 10—50% of those with type 2 diabetes and this level of NPDR will de- velop PDR within 1 year [23]. Further long-term studies should be conducted to clarify whether patients with better glycemic control or in an early stage of DR could benefit from less frequent screening intervals. Finally, it should be noted that the estimates used in this analysis were based on relatively small samples, that is, the ag- gregate estimates may reflect a reasonable population, but not all Chinese with type 2 diabetes. Further study of those inadequ ately represented is needed. 5. CONCLUSIONS In conclusion, this study revealed that it is worthwhile to launch a routine DR screening program of Chinese type 2 diabetes for blindness prevention from the societal perspective but not from consumer decision based on the perspective of WTP. 6. ACKNOWLEDGEMENTS This study was also supported by the grants from the National Science Council (NSC-95-2314-B-350-002-MY3) and (NSC-98-2314-B-350- 002-MY3). REFERENCES [1] Sanchez-Thorin, J.C. (1998) The epidemiology of diabetes mellitus and diabetic retinopathy. Intern Ophthalmol Clin, 38(2), 11-18. [2] Chen, M.S., Kao, C.S., Chang, C.J., Wu, T.J., Fu, C.C. and Chen, C.J. (1992) Prevalence and risk factors of dia- betic retinopathy among non-insulin-dependent diabetic subjects. Am J Op h t h a lm o l, 114(6), 723-730. [3] Tung, T.H., Chen, S.J., Liu, J.H., et al. (2005) A commu- nity-based follow-up study on diabetic retinopathy among type 2 diabetics in Kinmen. Eur J Epidemiol, 20(4), 317-323. [4] Tung, T.H., Chen, S.J., Shih, H.C., et al. (2006) Assess- ing the natural course of diabetic retinopathy: A popula- tion-based study in Kinmen. Taiwan, Ophthalmic Epide- miol, 13(5), 327-333. [5] Bala, M.V., Mauskopf, J.A. and Wood, L.L. (1999) Will- ingness to pay as a measure of health benefits. Pharma- coeconomics, 15(1), 9-18.  C. C. Peng et al. / HEALTH 1 (2009) 304-312 SciRes Copyright © 2009 http://www.scirp.org/journal/HEALTH/Openly accessible at 312 [6] Jampel, H.D., Schwartz, G.F., Robin, A.L., Abrams, D.A., Johnson, E. and Miller, R.B. (2003) Patient preferences for eye drop characteristics: A willingness-to-pay analy- sis. Arch Ophthalmol, 121(4), 540-546. [7] Olsen, J.A. and Smith, R.D. (2001) Theory versus prac- tice: A review of “willingness-to-pay” in health and health care. Health Econ, 10(1), 39-52. [8] Shih, H.C., Chou, P., Chen, S.J., et al. (2007) A commu- nity-based study of the willingness to pay associated with screening for diabetic retinopathy among type 2 diabetes in Kinmen, Taiwan. J Epidemio l , 17(6), 186-193. [9] Chou, P., Liao, M.J., Kuo, H.S., Hsiao, K.J. and Tsai, S.T. (1994) A population survey on the prevalence of diabetes in Kin-Hu, Kinmen. Diabetes Care, 17(9), 1055-1058. [10] World Health Organization (1999) Definition, diagnosis and classification of diabetes mellitus and its complica- tions: Report of a WHO consultation. Part 1. Diagnosis and classification of diabetes mellitus. Geneva, World Health Organization. [11] Wilkinson, C.P., Ferris 3rd, F.L., Klei n, R.E., et al. (2003) Proposed international clinical diabetic retinopathy and diabetic macular edema disease severity scales. Oph- thalmology, 110(9), 1677-1682. [12] García-Serrano, J.L., Serrano-Laborda, D., López-Pozas, M., Cabello-Aparicio, C. and Castro-Rosales, L. (2007) The Granada diabetic retinopathy study: Direct screening of 8,244 patients. I Arch Soc Esp Oftalmol, 82(11), 681-689. [13] Harvey, J.N., Craney, L., Nagendran, S. and Ng, C.S. (2006) Towards comprehensive population-based screening for diabetic retinopathy: Operation of the North Wales diabetic retinopathy screening programme using a central patient register and various screening methods. J Med Screen, 13(2), 87-92. [14] Ackerman, S.J. (1992) Benefits of preventive programs in eye care are visible on the bottom line. A new nation- wide effort to improve eye care for people with diabetes gets backing from a study on the cost-effectiveness of screening for retinopathy. Diabetes Care, 15(4), 580-581. [15] Javitt, J.C. and Aiello, L.P. (1996) Cost-effectiveness of detecting and treating diabetic retinopathy. Ann Intern Med, 124(1 Pt 2), 164-169. [16] Polak, B.C., Crijns, H., Casparie, A.F., et al. (2003) Cost-effectiveness of glycemic control and ophthal- mological care in diabetic retinopathy. Health Policy, 64(1), 89-97. [17] Tung, T.H., Shih, H.C., Chen, S.J., et al. (2008) Eco- nomic evaluation of screening for diabetic retinopathy among Chinese type 2 diabetics: A community-based study in Kinmen, Taiwan. J Epidemiol, 18(5), 225-233. [18] Health Employer Data and Information Set (1997) Ver- sion 3.0. Washington, DC: National Committee for Qual- ity Assurance, 2. [19] Sloan, F.A., Grossman, D.S. and Lee, P.P. (2009) Effects of receipt of guideline recommended care on onset of diabetic retinopathy and its progression. Ophthalmology, 116(8), 1515-1521. [20] Klein, R., Klein, B.E, Neider, M.W., Hubbard, L.D., Meuer, S.M. and Brothers, R.J. (1985) Diabetic reti- nopathy as detected using ophthalmoscopy, a nonmydri- atic camera and a standard fundus camera. Ophthalmol- ogy, 92(4), 485-491. [21] Ekoe, J.M., Zimmet, P. and Williams, R. (2001) The epi- demiology of diabetes mellitus: An international perspec- tive. John Wiley & Sons, Inc. [22] Byrt, T. (1996) How good is that agreement. Epidemiol- ogy, 7(5), 561. [23] Aiello, L.P., Gardner, T.W., King, G.L., et al. (1998) Dia- betes retinopathy. Diabetes Care, 21(1), 143-156. |