Paper Menu >>
Journal Menu >>
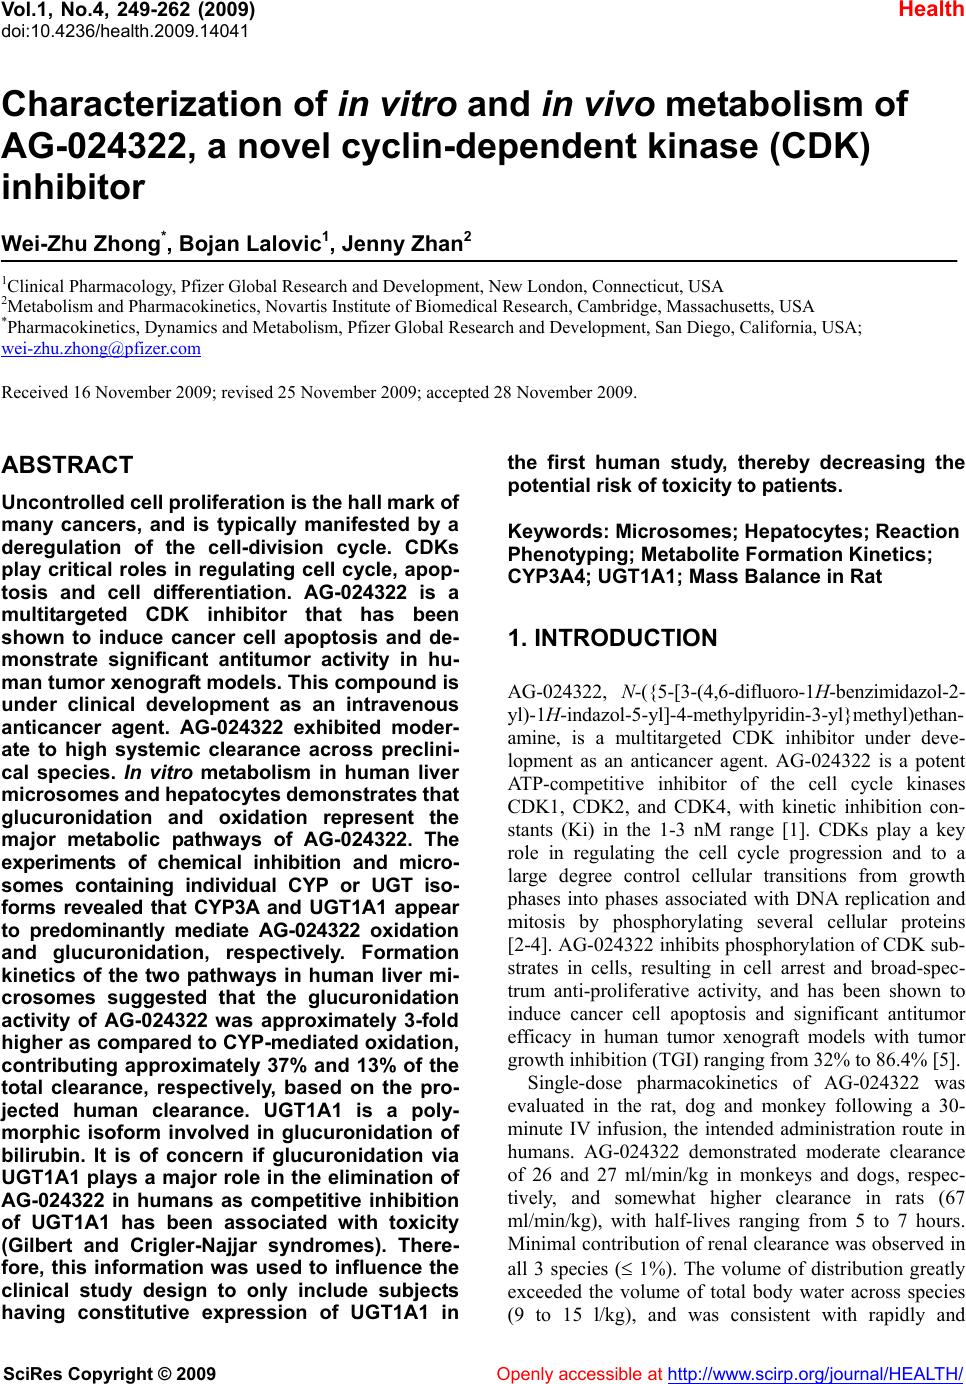 Vol.1, No.4, 249-262 (2009) doi:10.4236/health.2009.14041 SciRes Copyright © 2009 Openly accessible at http://www.scirp.org/journal/HEALTH/ Health Characterization of in vitro and in vivo metabolism of AG-024322, a novel cyclin-dependent kinase (CDK) inhibitor Wei-Zhu Zhong*, Bojan Lalovic1, Jenny Zhan2 1Clinical Pharmacology, Pfizer Global Research and Development, New London, Connecticut, USA 2Metabolism and Pharmacokinetics, Novartis Institute of Biomedical Research, Cambridge, Massachusetts, USA *Pharmacokinetics, Dynamics and Metabolism, Pfizer Global Research and Development, San Diego, California, USA; wei-zhu.zhong@pfizer.com Received 16 November 2009; revised 25 November 2009; accepted 28 November 2009. ABSTRACT Uncontrolled cell proliferation is the hall mark of many cancers, and is typically manifested by a deregulation of the cell-division cycle. CDKs play critical roles in regulating cell cycle, apop- tosis and cell differentiation. AG-024322 is a multitargeted CDK inhibitor that has been shown to induce cancer cell apoptosis and de- monstrate significant antitumor activity in hu- man tumor xenograft models. This compound is under clinical development as an intravenous anticancer agent. AG-024322 exhibited moder- ate to high systemic clearance across preclini- cal species. In vitro metabolism in human liver microsomes and hepatocytes demonstrates that glucuronidation and oxidation represent the major metabolic pathways of AG-024322. The experiments of chemical inhibition and micro- somes containing individual CYP or UGT iso- forms revealed that CYP3A and UGT1A1 appear to predominantly mediate AG-024322 oxidation and glucuronidation, respectively. Formation kinetics of the two pathways in human liver mi- crosomes suggested that the glucuronidation activity of AG-024322 was approximately 3-fold higher as compared to CYP-mediated oxidation, contributing approximately 37% and 13% of the total clearance, respectively, based on the pro- jected human clearance. UGT1A1 is a poly- morphic isoform involved in glucuronidation of bilirubin. It is of concern if glucuronidation via UGT1A1 plays a major role in the elimination of AG-024322 in humans as competitive inhibition of UGT1A1 has been associated with toxicity (Gilbert and Crigler-Najjar syndromes). There- fore, this information was used to influence the clinical study design to only include subjects having constitutive expression of UGT1A1 in the first human study, thereby decreasing the potential risk of toxicity to patients. Keywords: Microsomes; Hepatocytes; Reaction Phenotyping; Metabolite Formation Kinetics; CYP3A4; UGT1A1; Mass Balance in Rat 1. INTRODUCTION AG-024322, N-({5-[3-(4,6-difluoro-1H-benzimidazol-2- yl)-1H-indazol-5-yl]-4-methylpyridin-3-yl}methyl)ethan- amine, is a multitargeted CDK inhibitor under deve- lopment as an anticancer agent. AG-024322 is a potent ATP-competitive inhibitor of the cell cycle kinases CDK1, CDK2, and CDK4, with kinetic inhibition con- stants (Ki) in the 1-3 nM range [1]. CDKs play a key role in regulating the cell cycle progression and to a large degree control cellular transitions from growth phases into phases associated with DNA replication and mitosis by phosphorylating several cellular proteins [2-4]. AG-024322 inhibits phosphorylation of CDK sub- strates in cells, resulting in cell arrest and broad-spec- trum anti-proliferative activity, and has been shown to induce cancer cell apoptosis and significant antitumor efficacy in human tumor xenograft models with tumor growth inhibition (TGI) ranging from 32% to 86.4% [5]. Single-dose pharmacokinetics of AG-024322 was evaluated in the rat, dog and monkey following a 30- minute IV infusion, the intended administration route in humans. AG-024322 demonstrated moderate clearance of 26 and 27 ml/min/kg in monkeys and dogs, respec- tively, and somewhat higher clearance in rats (67 ml/min/kg), with half-lives ranging from 5 to 7 hours. Minimal contribution of renal clearance was observed in all 3 species ( 1%). The volume of distribution greatly exceeded the volume of total body water across species (9 to 15 l/kg), and was consistent with rapidly and  W. Z. Zhong et al. / HEALTH 1 (2009) 249-262 SciRes Copyright © 2009 Openly accessible at http://www.scirp.org/journal/HEALTH/ 250 widely tissue distribution observed in Long Evans rats by quantitative whole body autoradiography (QWBA) using [14C]AG-024322. The plasma protein binding of AG-024322 was in the range of 85 to 95% across species. In view of the predominant metabolic pathway of glu- curonidation observed in human hepatocytes and the generally low metabolic turnover in in vitro incubations, the prediction of pharmacokinetics in human was per- formed using interspecies allometric scaling of single- dose animal pharmacokinetics data. This approach lead to a reasonable prediction of human clearance (12.5 ml/ min/kg), which was similar to the clearance actually observed in humans with IV doses from 20 to 340 mg. Detailed nonclinical pharmacokinetics and the prediction of human pharmacokinetics of AG-024322 will be re- ported elsewhere. To support the development of AG-024322, a series of nonclinical in vitro and in vivo studies were conducted to identify AG-024322 metabolites, and to characterize the disposition of AG-024322. These studies involved with either using animal and human liver microsomes and hepatocytes incubated with C-14 labeled AG-024322 ([14C]AG-024322) or using urine, plasma, bile, and fecal samples from rats administered [14C]AG-024322. Fur- ther studies to assess the two principal pathways of AG- 024322 biotransformation, CYP-mediated oxidative and UGT-mediated glucuronidation, and to identify the ma- jor enzymes involved in these metabolic pathways were also carried out. In the present paper, discussion was emphasized on the in vitro and in vivo characterization of AG-024322 me- tabolism and the relative importance of CYP3A4 and UGT1A1 in the biotransformation of AG-024322 in HLM, as well as the relative contributions of the two metabolic pathways in the overall clearance of AG-024322. 2. MATERIALS AND METHODS 2.1. Materials AG-024322 was synthesized at Pfizer Global Research & Development (PGRD), La Jolla, CA. [14C]AG- 024322 (Specific activity 53.1 mCi/mmol) was synthe- sized by the Radiosynthesis Group at PGRD (Groton, CT), and the label was located in the C-1 position of the benzimidazol ring (Scheme 1). Rat, dog, monkey and human liver microsomes were obtained from Gentest Corporation. (Woburn, MA). Human liver microsome preparation (HL-Mix 14, 21.7 mg protein/ml, 0.3 nmol CYP/mg protein) and microsomes from insect cells stably expressing human cDNA CYPs and UGTs (su- persomes) were also purchased from Gentest Corpora- tion. Cryopreserved hepatocytes for dogs, monkeys and humans, and the thawing media were obtained from In Vitro Technologies (Baltimore, MD). Sprague-Dawley rat hepatocytes and Hepatocyte Isolation Kit were pur- Scheme 1. Chemical structure of AG-024322 (asterisk indicates the site of radiolabel). chased from XenoTech LLC (Lenexa, KS). Ketocona- zole, quindine, quercetin, furafyline, dibasic and mono- basic potassium phosphate, NADPH, UDPGA, and WEM were purchased from Sigma-Aldrich Co. (St. Louis, MO). HEPES (4-(2-hydroxyethyl)-1-piperazi- neethanesulfonic acid) buffer was purchased from Invi- trogen (Carlsbad, CA). Commercially obtained chemi- cals and solvents were of HPLC or the highest grade available. 2.2. Liver Microsomal Incubations Liver microsomes were preincubated with AG-024322 and [14C]AG-024322 in 100 mM potassium phosphate buffer (pH 7.4) for 5 minutes in a 37ºC shaking water bath. The reaction was initiated by the addition of NADPH with a final incubation volume of 0.5 ml con- taining 10 µM AG-024322, 0.87 µM [14C]AG-024322, 1 mM NADPH, 0.75 mg/ml microsomal protein and 100 mM potassium phosphate buffer (pH 7.4). The incuba- tion was terminated at 0, 10, 20, 40 and 60 minutes by the addition of 0.5 ml of acetonitrile and immediately vortexed and centrifuged at 1900g for 25 minutes. The supernatants were transferred to a fresh tube, evaporated to dryness under nitrogen, and reconstituted with 200 µl of Solvent A for LC/RAM/MS analysis as described below. 2.3. Hepatocytes Incubation Cryopreserved hepatocytes were thawed and used ac- cording to the manufacturer’s instructions. The thawed cryopreserved hepatocytes were re-suspended into CO2- bubbled incubation media to determine the total cell count using the Trypan Blue Exclusion method. The incubation media consisted of WEM supplemented with 10 mM HEPES buffer. The final cell concentrations were 1.5, 1.8, 1, and 1.23106 viable cells/ml for rat, dog, monkey and human hepatocytes in WEM, respectively. Hepatocytes were incubated in the media containing 10 µM AG-024322 and 0.87 µM [14C]AG-024322 in a CO2:O2 (5:95) stationary incubator at 37ºC. The final incubation volume was 1 ml. Reactions were terminated at several time points from time zero to 5 hours by the addition of 2 ml of acetonitrile. Samples were then soni- NN N N N F N F *  W. Z. Zhong et al. / HEALTH 1 (2009) 249-262 SciRes Copyright © 2009 Openly accessible at http://www.scirp.org/journal/HEALTH/ 251 cated, vortexed and centrifuged at 1900g for 25 min- utes at 4ºC. The resulting supernatant was evaporated under nitrogen and reconstituted in 100 µl of water for LC/RAM/MS analysis. 2.4. CYP Reaction Phenotyping Screen AG-024322 (1 and 10 µM), each in triplicate, were in- cubated with a panel of microsomes from insect cells expressing individual human CYPs (Supersomes) con- taining 50 pmol of CYP1A2, 2C8, 2D6, 2E1, 3A4 and 3A5 protein or 100 pmol of 2C9*1 and 2C19. The final incubation volume was 0.5 ml. Incubations containing AG-024322 and 1 mM NADPH in 100 mM phosphate buffer (pH 7.4) were preincubated for 5 minutes at 37ºC. The reactions were started with the addition of 50 µl of each CYP and were allowed to proceed up to 15 minutes. Incubations were stopped with the addition of 0.5 ml of acetonitrile and 20 µl of 1ng/µl AG-024397 (IS), and immediately capped, vortexed and centrifuged at 1900g for 25 minutes at 4ºC. The supernatant of each sample was dried under N2 and reconstituted with 100 µL of Solvent C for LC-MS analysis as described below. 2.5. Chemical Inhibition CYP-specific chemical inhibitors, ketoconazole (CYP 3A4), quinidine (CYP2D6), quercetin (CYP2C8), and furafyline (CYP1A2) were used to identify the isoforms mediating the formation of N-desethyl AG-024322. In- cubation mixtures were prepared with ketoconazole and quinidine at 20, 100, 500 and 1 µM, quercetin at 0.3, 0.75 and 2 µM and furafyline at 1, 10 and 30 µM, and were preincubated with AG-024322 (1 and 10 µM) and 15 mg HLM protein (0.3 mg/ml) for 5 minutes at 37ºC. Incubations were started by the addition of NADPH to a concentration of 1 mM in a final volume of 0.5 ml. In- cubations with furafyline, a time-dependent inhibitor of CYP1A2, required a preincubation step in the presence of 1 mM NADPH for 20 minutes prior to the introduc- tion of the substrate. The reactions were terminated after 8 minutes by the addition of 0.5 ml of acetonitrile and 20 µl of 1 ng/µl IS. The remaining part of the procedure was performed as described above for CYP reaction phenotyping screen. 2.6. UGT Reaction Phenotyping Screen AG-024322 (1 and 10 µM), each in triplicate, was incu- bated with 8 UGT isoforms (UGTlA1, 1A3, 1A4, 1A6, 1A8, 1A10, 2B7 and 2B15). The incubation procedure was adapted from Fisher et al. [6]. Microsomes (0.5 mg/ ml) suspended in 100 mM phosphate buffer (pH 7.1) were initially treated with alamethicin at 0.025 mg/mg microsomal protein. The mixture also included 1 mM MgCl2 and was kept on ice for 15 minutes to permealize the microsomal membrane. AG-024322 was then added and the mixture was preincubated at 37‘C for 5 minutes. The reaction was started with the addition of 1 mM UDPGA in a total incubation volume of 0.2 ml, and were terminated after 15 minutes by the addition of 0.5 ml of acetonitrile and 20 µl of 1 ng/µl IS. The remaining part of the procedure was performed as described above for CYP reaction phenotyping screen. 2.7. Metabolite Formation Kinetics in HLM The formation kinetics of the N-desethyl metabolite and the parent glucuronides were studies in the same liver preparation from 14 different human livers (HL-Mix 14) to afford a comparison of the oxidation and glucuronida- tion pathways. To determine the formation rates of N-desethyl me- tabolite, AG-024322 with a concentration range of 0.5- 100 µM, each in triplicate, was pre-incubated with HLM containing 0.75 mg/ml protein in 100 mM potassium phosphate buffer (pH 7.4) for 5 minutes at 37ºC. The reaction was initiated by the addition of 1 mM NADPH in a final incubation volume of 0.5 ml. Reactions were terminated at 15 minutes by the addition of 0.5 ml of acetonitrile and 40 µl of 1 ng/µl IS. The remaining part of the procedure was performed as described above for CYP reaction phenotyping screen. The experiment conditions to determine the formation rates of parent glucuronides were optimized in respect to time and protein concentration. Linear product formation was observed for up to 1 hour and 2 mg/ml microsomal protein. The experiments were following the similar procedure as described above using UGT supersomes, except that the incubation mixture contains 1 mg/ml microsome protein, 1 mM MgCl2, 0.05 mg/mg micro- some protein alamethicin, and 2.5 mM UDPGA in either 0.1 M phosphate buffer (pH 7.1) or WEM, incubated with a range of AG-024322 concentrations (0.5 to 200 µM) in triplicate, and terminated at 35 minutes. 2.8. Formation Kinetics Calculation The relative formation rate of each metabolite (peak area ratio/mg protein/15 or 35 min) was calculated and plot- ted against AG-024322 concentrations. The metabolite formation kinetic parameter, Km, was estimated by fitting the data to the sigmoid Emax model using SAAMII (SAAM Institute, Seattle, WA). The maximum formation rate (Vmax) was estimated from separate experiments of HLM incubation with 10 µM [14C]AG-024322 at the similar conditions as described above. The formation rate (V) of each metabolite in the incubations was calcu- lated based on the radioactivity. The Vmax value was then calculated based on the Michaelist-Menten equation, Vmax is the substrate concentration. The in vitro intrinsic clearance (CLint) was determined by Vmax/Km ratio. The predicted CLint was scaled up to in vivo by extrapolating CLint assuming a human liver weight of 1500 g (70 kg body weight) and that one gram liver tissue contains 45 mg HLM protein. The total hepatic clearance (CLh) was calculated  W. Z. Zhong et al. / HEALTH 1 (2009) 249-262 SciRes Copyright © 2009 Openly accessible at http://www.scirp.org/journal/HEALTH/ 252 from the well-stirred model: CLh = Q x CLint / Q + CLint, where Q is the human hepatic blood flow (20 ml/min/kg). The estimation of CLh was not incorporated with plasma and microsome protein binding. 2.9. Mass Balance Study in Rats In this study, [14C]AG-024322 in 5% dextrose in water (pH 4) was administered as a single 30-minute IV infu- sion to all animals at a target dose level of 10 mg/kg (~50 µCi/250 g body weight). The intact animals in Group 1 (3/gender) were individually housed in metabo- lism cages for the separate collection of urine and feces over intervals through 120 hours after dosing. The bile duct-cannulated (BDC) rats in Group 3 (2/gender) were individually housed in metabolism cages for the collec- tion of bile over intervals through 48 hours. Blood sam- ples were collected from intact animals in Group 2 (2/gender) before dosing and at 0.25, 0.5, 1, 3, 8, 24, 48, 72, 96, and 120 hours from the initiation of infusion. Blood samples were collected from intact animals in Group 4 by sacrificing 1 animal/gender at each time point at 0.5, 2, 4, and 8 hours from the initiation of infu- sion. Urine, feces, bile, cage wash, cage wipe, blood, and plasma samples were processed and analyzed for radio- activity. Selected plasma, urine, bile, and fecal samples were used for metabolite identification and profiling. 2.10. Plasma, Urine, Fecal and Bile Sample Preparation Plasma samples collected from Group 4 animals were pooled based on the pooling formula described by Ham- ilton and coworkers [7] to generate plasma pools (2.0 mL). The pooled plasma samples were precipitated by the addition of 4 volumes of acetonitrile: methanol (3:1, v/v) with 0.2% formic acid, and then vortexed and cen- trifuged. Urine samples were pooled on a percent weight basis and centrifuged. The supernatants from the plasma or urine pool extracts were concentrated to approxi- mately 1 ml under N2 before LC/RAM/MS analysis. Selected fecal homogenate from each animal were pooled on a percent weight basis to generate fecal ho- mogenate pools. Each pooled sample was precipitated by the addition of 4 volumes of acetonitrile containing 0.2% formic acid, vortexed and centrifuged. The pellet was re- extracted using the same method, and supernatants were combined for evaporation under N2 to dryness. The resi- dues were reconstituted in 1 ml of 20:80 (v/v) metha- nol:20 mM ammonium acetate with 0.1% formic acid for LC/RAM/MS analysis. Selected bile samples were pooled on a percent weight basis to generate bile pools. After centrifugation, every 100 µl of bile sample was diluted with 900 µl of 20:80 (v/v) methano l:20 mM ammonium acetate containing 0.1% formic acid for LC/RAM/MS analysis. All centrifugation was performed at 15850g for 10 minutes using Brinkman eppendorf 5415c (West- bury, NY). The injection volume for LC/RAM/MS was 300-900 µl. 2.11. Determination of Radioactivity The radioactivity in urine, bile, fecal, blood, and plasma samples was determined by liquid scintillation counting (LSC). Triplicate weighed aliquots (approximately 0.02 to 0.1 g each) of urine, bile, and plasma samples were mixed with scintillation fluid, and analyzed directly by LSC. Triplicate weighed aliquots of fecal homogenate (fecal:water, 20:80, w/w, approximately 0.1-0.5 g each) or blood (approximately 0.02-0.03 g each) were placed into cones and pad, dried, combusted, and then analyzed by LSC. 2.12. Metabolite Characterization Metabolite characterization was performed using an Agilent 1100 HPLC system (Wilmington, DE) coupled in-line with an ARC Model C StopFlow System (AIM Research Company, Newark, DE) and an IN/US Model 3 -RAM radio-detector (Tampa, FL), and a ThermoF- innigan LCQ-Deca XP ion trap mass spectrometer (San Jose, CA). When MS detection was used, the HPLC ef- fluent was split with approximately 20% of the flow introduced into the MS via electrospray ionization (ESI) source and 80% diverted to the -RAM detector. The ion-trap ESI-MS was operated in positive ion model with a spray voltage of 4.5 kV, sheath gas flow rate of 70 (arbitrary), auxiliary gas flow rate of 20 (arbitrary) and capillary temperature at 200ºC. Laura 3 V3.0 (IN/US system, Tampa, FL), ARC data system V2.4 (AIM Re- search Company, Newark, DE) and Xcalibur V1.4 (ThermoFinnigan, San Jose, CA) software were em- ployed to control the -RAM detector, the StopFlow system and the LC-MS system for data acquisition and processing. The MS spectra were acquired over a mass range of m/z 100-900 for all samples. Ion-trap LC-ESI- MS/MS experiments were performed to generate ion mass spectra for the selected molecular ions representing possible metabolites of AG-024322. AG-024322 me- tabolites were identified by chromatographic resolution and concurrent radiometric and mass-selective quantifi- cation. Separation of the parent drug and its metabolites was accomplished using a Phenomenex Luna 5 µ C18 col- umn (2504.6 mm, Torrance, CA) or an Agilent Zorbax 5µ C8 column (1504.6 mm, Palo Alto, CA). The mo- bile phase consisting of a 20 mM ammonium acetate in water (pH 4.0) as Solvent A and acetonitrile as Solvent B, and were programmed for each matrix using a linear gradient at a constant flow rate of 1.0 mL/min as follows: 1) for hepatocyte and microsome incubations: 0 min, 5% B; 5 min, 5% B; 30 min, 35% B; 31 min, 95% B; 35 min, 95% B; 36 min, 5% B; and 43 min, 5% B; 2) for urine, feces and bile samples: 0 min, 10% B; 10 min, 18% B;  W. Z. Zhong et al. / HEALTH 1 (2009) 249-262 SciRes Copyright © 2009 http://www.scirp.org/journal/HEALTH/ 253 20 min, 18% B; 42 min, 30% B; 50 min, 30% B; 60 min, 55% B; 61 min, 10% B; and 70 min, 10% B; and 3) for plasma samples: 0 min, 10% B; 50 min, 30% B; 60 min, 55% B; 61 min, 10% B; and 70 min, 10% B. Openly accessible at The analysis of N-desethylation metabolite of AG- 024322 and the glucuronides of the parent drug was using a Zorbax C8 column (2.15 mm, 5 µ) from Agilent (Palo Alto, CA) to allow a chromatographic resolution of the metabolites from the parent drug with a run time of 12 minute. With an API 4000 MS (AB Sciex Instruments, Toronto, Ontario), the monitored ion transitions were 419374, 391374 and 595374 for the parent compound, N-desethyl metabolite and parent glucuronide, respectively. The mobile phase was pro- grammed from the initial setting at 95% Solvent C (2 mM ammonium acetate with 0.1% formic acid in water) and 5% Solvent D (acetonitrile with 0.1% formic acid) to 35% C and 65% D at 10 minutes by linear gradient, and restored to original composition at 10.1 min until the end of run.. The flow rate was maintained constant at 0.3 ml/min. 3. RESULTS 3.1. In Vitro Metabolism of AG-024322 Metabolic stability of [14C]AG-024322 in liver micro- somes and hepatocytes are presented in Table 1 as per- cent of parent drug remaining after incubation in the preparations for rat, dog, monkey and human. The cor- responding disappearance half-life was generated from the available time course data. [14C]AG-024322 depleted most extensively in rat liver microsome with 11% of radiochromatogram of the parent drug remaining at 1-hour incubation time, followed by dog (55%). Com- parable incubations in human and monkey liver micro- somes yielded significantly less extensive parent drug depletions with 95% and 92% remaining after 1-hour incubation, respectively. [14C]AG-024322 also exhibited metabolic stability in human hepatocytes relative to other species. After 5 hours incubation, only 14% of the compound was metabolized in human hepatocytes, whereas 26% and 27% in dog and rat hepatocytes, re- spectively. Monkey hepatocytes most extensively me- tabolized AG-024322 up to 38%. Based on the chroma- tographic retention time and molecule weight, several metabolites were tentatively identified as parent glu- curonides (M1, M2, and M3), N-desethylation (M6) and metabolites that may arise from N-acetylation of M6 (M8) or parent methylation (M10) in hepatocytes and micro- somes of various species (Table 2). The radiochro- ma- tograms of the 5-hour incubations of [14C]AG-024322 in rat, dog, monkey and human hepatocytes are shown in Figure 1. At 5 hours, glucuronidation of the parent drug accounted for approximately 8% of the total radioactiv- ity, while M6 and M8/M10 accounted for 4% and 2% of Table 1. Metabolic stability of [14C]AG-024322 in liver mi- crosomes and hepatocytes. Microsomesa Hepatocytesb Species Remaining at 1-hour (%) Half-life (h) Remaining at 5-hour(%) Half-life (h) Human95 12 86 50 Monkey92 37 62 8.5 Dog 55 1.0 74 14 Rat 11 0.3 73 15 a. Incubations contain 0.75 mg/ml microsomal protein; b. Incubations contain 1.2, 1.0, 1.8 and 1.5 x10⁶ cells/ml in WEM for human, monkey, dog and rat, respectively. Table 2. Metabolite profiles of AG-024322 in rat, dog, monkey and human liver microsomes and cryopreserved hepa- tocytes incubated with [14C] AG-024322. % Radiochromatogram Species M1 M2 M3 M5 (Unk)M6 M7(Unk)AG-024322M7/M10 M9(Unk) M10/M7 Liver Microsomes (at 1 Hour of Incubation) Rata - - - - 7.5 10.6 10.8 8.8 22.1 - Dogb - - - - 5.2 12.3 55.3 14.0 - - Monkey - - - - 8.1 - 91.9 - - - Human - - - - 4.8 - 95.2 - - Hepatocytes (at 5 hours of Incubation) Rat - - 8.3 1.2 11.3- 73.1 6.1 - - Dog - - - - 13.6- 74.2 2.4 3.9 5.8 Monkey 1.9 7.3 21.7 1.8 4.5 0.8 62 - - - Human 1.5 1.5 5.2 - 4.1 - 85.7 2.1 - - a. Novel unidentified metabolites accounted for 40.2% of radiochromatogram in rat liver microsome (not listed); b. Novel unidentified metabolites accounted for 13.2% of radiochromatogram in dog liver microsome (not listed); -: Trace or no RAM detected metabolites; M1, M2 and M3: Parent drug glucuronides (M.W. 594); M6: N-desethyl AG-024322 (M.W. 386); M7/M10: acetylated M6 or methy- lated AG-024322 (M.W. 432); Unk: unknown/unidentified metabolite.  W. Z. Zhong et al. / HEALTH 1 (2009) 249-262 SciRes Copyright © 2009 Openly accessible at http://www.scirp.org/journal/HEALTH/ 254 Time (Min) Monkey DPM M6 M1 M2 M3 0:00 10:00 20:0030:00 40:00 0 100 200 300 400 500 600 700 800 AG-024322 Time (Min) Monkey DPM M6 M1 M2 M3 0:00 10:00 20:0030:00 40:00 0 100 200 300 400 500 600 700 800 AG-024322 Human Time (Min) DPM 0:0010:00 20:00 30:00 40:00 0 100 200 300 400 500 600 700 800 900 1000 M1 M2 M3 M6 AG-024322 M8/M10 Human Time (Min) DPM 0:0010:00 20:00 30:00 40:00 0 100 200 300 400 500 600 700 800 900 1000 M1 M2 M3 M6 AG-024322 M8/M10 Dog Time (Min) DPM 0:00 10:00 20:00 30:00 40:00 0 100 200 300 400 500 600 700 800 DPM M9( Unk) M7(Unk) M6 AG-024322 M8/M10 Dog Time (Min) DPM 0:00 10:00 20:00 30:00 40:00 0 100 200 300 400 500 600 700 800 DPM M9( Unk) M7(Unk) M6 AG-024322 M8/M10 Rat Time (Min) DPM M8/M10 M5 (Unk)M6 M3 0:0010:0020:0030:00 40:00 0 100 200 300 400 500 600 700 AG -024322 M7 (Unk) Rat Time (Min) DPM M8/M10 M5 (Unk)M6 M3 0:0010:0020:0030:00 40:00 0 100 200 300 400 500 600 700 AG -024322 M7 (Unk) Figure 1. Representative HPLC radiochromatograms of a 5-hour [14C]AG-024322 (11 µM) incubation in rat, dog, monkey and human cryopreserved hepatocytes (1106 cells) total radioactivity, respectively, in human hepatocytes. M6 is the only metabolite detected in human liver mi- crosomes and accounted for 5% of the total radioactivity. The preliminary proposed in vitro metabolic scheme is show in Scheme 2. 3.2. CYP Reaction Phenotyping The CYP enzymes involved in N-desethylation of AG- 024322 were examined by incubations with microsomes from insect cells expressing cDNA (recombinant) human CYPs and by CYP-selective chemical inhibition. CYP3A appear to predominantly catalyzed the N-de- sethylation of AG-024322 in vitro at 1 and 10 µM (Fig- ure 2). Incubations of AG-024322 with recombinant CYP1A2, 2C8 and 2D6, indicated their minor contribu- tion after scale-up of the velocity using either CYP con- tent or relative activity factors [8,9]. Follow-up incuba- tions with CYP-specific inhibitors suggested that only Scheme 2. Preliminary In Vitro AG-024322 metabolic scheme. N N H N N NN FF N H 2 N N N NN F F N H N N NN F F N N N N N NN FF M8 N-acetylation M10 N HN N N NN FF O Gluc. N-meth ylat ion N-desethylation AG-024322 UGT M1, M2, M3 M6 Oxidation CYP  W. Z. Zhong et al. / HEALTH 1 (2009) 249-262 SciRes Copyright © 2009 Openly accessible at http://www.scirp.org/journal/HEALTH/ 255 ketoconazole inhibited the N-desethylation of AG-024322 (Table 3). Despite the minor projected involvement of CYP2D6, CYP2C8 and CYP1A2 (Figure 2), quinidine, quercetin and furafyline had no inhibitory effect on the formation rate of N-desethyl AG-024322, confirming a minimal contribution of these enzymes. The involvement of CYP2C9, CYP2C19 and CYP2E1 in N-desethylation of AG-024322 was found to be negligible. Formation kinetics of N-desethyl AG-024322 in human liver microsome were further investigated over the concentration range of 0.5 to 100 µM AG-024322 and were best described by a single enzyme system with an apparent Km of 10 µM using SAAMII, a general nonlinear kinetic modeling program (Figure 3). The estimated kinetic parameters, Km, Vmax, in vitro CLint, and extrapolated in vivo intrinsic and hepatic clearance are presented in Table 4. 3.3. UGT Reaction Phenotyping The strategy used here for UGT phenotyping is based on- well-established methods, including screening of re Figure 2. Comparison of AG-024322 N-desethylation activity at 1 and 10 µM in microsomes from insect cells individually expressing human CYPs (CYP supersomes). Table 3. Percent (%) inhibition or stimulation of AG-024322 metabolism in the presence of CYP-selective Inhibitors. Inhibitor Concentration (µM) % Desethylaton Activity Remaining at 1 µM AG-0243222 % Desethylaton Activity Remaining at 10 µM AG-0243222 0.02 77.5 ± 4.4 86.2 ± 3.9 0.1 31.4 ± 2.2 62.2 ± 5.2 0.5 16.9 ± 0.5 30.7 ± 1.7 Ketoconazole (Inhibitor of CYP3A4) 1 14.2 ± 0.4 23.8 ± 2.1 0.02 131 ± 18 117 ± 7 0.1 157 ± 11 115 ± 4 0.5 158 ± 8 122 ± 11 Quinidine (Inhibitor of CYP2D6) 1 165 ± 4 120 ± 7 0.3 145 ± 6 120 ± 9 0.75 160 ± 5 120 ± 8 Quercetin (Inhibitor of CYP2C8) 2 156 ± 3 120 ± 9 1 - 126 ± 16 10 - 125 ± 7 Furafyline (Inhibitor of CYP1A2) 30 - 131 ± 7 -: not determined Table 4. Enzyme kinetic (michalis-menten) parameters estimates of the formation of AG-024322 oxidation and glu- curonide metabolites using HL-14 human liver microsome preparation. Formation Kinetics Buffer Km (µM)Vmax a (pmol/mg/min) CLint b (ml/min/kg) CLh c (ml/min/kg) N-desethyl AG-024322 KPI 10 20 1.86 1.70 Glucuronide M1 KPI 450 35 0.07 0.07 WEM 98 77 0.74 0.72 Glucuronide M2 KPI 9.1 5.3 0.55 0.54 WEM 19 27 1.34 1.26 Glucuronide M3 KPI 7.8 5.2 0.63 0.61 WEM 11 37 3.17 2.74 a. Formation velocity V was estimated from [14C]AG-024322 incubation. Vmax was calculated from V = Vmax x S/(Km+ S), where S is the sub- strate concentration; b. CLint was scaled up to in vivo by extrapolating in vitro CLint assuming a human liver weight of 1500 g (70 kg body weight) and that one gram liver tissue contains 45 mg HLM protein; c. CLh was calculated from the well-stirred model: CLh = Q x CLint / Q + CLint , where Q is the human hepatic blood flow (20 ml/min/kg); KPI: phosphate buffer, pH 7.1, WEM: William E Medium.  W. Z. Zhong et al. / HEALTH 1 (2009) 249-262 SciRes Copyright © 2009 Openly accessible at http://www.scirp.org/journal/HEALTH/ 256 0 200 400 600 800 1000 1200 1400 1600 1800 020406080100 120 140 160 AG-024322 (M) Pear Area x 10 3 /0.375 mg/15 min Observed Predicted Figure 3. Formation kinetics of N-desethyl AG-024322 in human liver microsomes over the AG-024322 concentration range of 0.5 to 100 µM. binant UGTs for activity and comparative enzyme ki- netic analysis. Incubations with microsomes from cells individually expressing human UGT1A enzymes (UGT supersomes) yield 3 distinct glucuronide products of the parent drug (M1, M2 and M3), corresponding to the peaks seen after incubation in human hepatocytes. A majority involvement of UGT1A1 at 1 and 10 µM of AG-024322 (Figure 4) in the formation of parent drug glucuronides, M2 and M3, and minor involvement of UGT1A8 in the formation of M1 and M3 were observed. The involvement of other UGT1A and UGT2B enzymes in glucuronidation of AG-024322 was negligible. The formation of these three glucuronides was further inves- tigated in HLM incubated at an AG-024322 concentra- tion range of 0.5 to 200 µM, with the system optimized for glucuronidation. The formation of AG-024322 glu- curonides in HLM incubations was also tested in two buffer systems, the phosphate buffer (pH 7.1) and WEM. The data fits and the estimated kinetic parameters for the Figure 4. Comparison of AG-024322 glucuronidation (UGT) activity at 1 and 10 µM in microsomes from insect cells indivi- dually expressing human UGT1A enzymes (UGT supersomes). 050100 150200 0.0 0.5 1.0 1.5 2.0 2.5 050100 150200 0.0 0.5 1.0 1.5 2.0 2.5 050100 150200 0.0 0.1 0.2 0.3 relative velocity (peak area/mg/30 min) M2 KPI buffer WME M3 AG-024322 (µM) M1 050100 150200 0.0 0.5 1.0 1.5 2.0 2.5 050100 150200 0.0 0.5 1.0 1.5 2.0 2.5 050100 150200 0.0 0.1 0.2 0.3 relative velocity (peak area/mg/30 min) M2 KPI buffer WME M3 AG-024322 (µM) M1 050100 150200 0.0 0.5 1.0 1.5 2.0 2.5 050100 150200 0.0 0.5 1.0 1.5 2.0 2.5 050100 150200 0.0 0.1 0.2 0.3 relative velocity (peak area/mg/30 min) M2 KPI buffer WME M3 AG-024322 (µM) M1 050100 150200 0.0 0.5 1.0 1.5 2.0 2.5 050100 150200 0.0 0.5 1.0 1.5 2.0 2.5 050100 150200 0.0 0.1 0.2 0.3 relative velocity (peak area/mg/30 min) M2 KPI buffer WME M3 AG-024322 (µM) M1 Figure 5. Comparison of formation kinetics of AG- 024322 glucuronides (M1, M2 and M3) in human liver microsomes (HL-14) using 100 mM phosphate buffer (KPI) or WEM (glucose 16 mM) in the liver microsome incubation. glucuronidation pathways are shown in Figure 5 and Table 4, respectively. The extrapolated total in vivo he- patic clearance via parent drug glucuronidation was 1.22 and 4.72 ml/min/kg using the phosphate buffer and WEM, respectively. 3.4. [14C]AG-024322 Excretion in Rats After a 30-min IV infusion of [14C]AG-024322 to intact Sprague-Dawley rats at 10 mg/kg (~50 µCi/250 g ani- mal), the total recovery of radioactivity dose averaged 84% by 120 hours, as shown in Table 5. The primary route of excretion of radioactivity was via the feces  W. Z. Zhong et al. / HEALTH 1 (2009) 249-262 SciRes Copyright © 2009 http://www.scirp.org/journal/HEALTH/ 257 (76.5%), indicating extensive biliary excretion. A mean total of 56% of dose was recovered in bile within 48 hours of administration to bile duct-cannulated rats, con- sisting with the high recovery of radioactivity in feces from the intact rats. Urinary excretion was minimal with an average radioactivity recovery of 3.2%. These data confirmed that the biliary excretion is the major route of elimination in rats, which is consistent with the findings from in vitro metabolism studies. The rate of elimination of radioactivity was moderately rapid and appeared to be essentially complete by 96 hours postdose (76.1% in feces and 3.2% in urine). The overall excretion of radio- activity was similar for males and females. 3.5. Metabolism of AG-024322 in Rats Profiling and identification of metabolites of AG-024322 in rats were conducted for plasma, urine, fecal and bile samples from the excretion mass balance study in rats as described above. AG-024322 underwent extensive me- tabolism in rats. The representative HPLC-radiochroma- tograms from rat plasma, urine, feces, and bile are pre- sented in Figure 6. Two major metabolites were identi- fied including a direct glucuronide of the parent drug and M13, a glucuronidation product of M15. M15 is a desethyl aminated metabolite (an alcohol) of AG-024322. Other metabolites identified included the N-desethylated product of AG-024322 (M6), a combined mono-xygen- ated and dehydrogenated product at the ethyl amine group of AG-024322 (M16), M15, and the glucuronides of M6 and M16 (M12 and M14, respectively). The pro- posed metabolic scheme of AG-024322 in rats is shown in Scheme 3. The profiles of these metabolites in plasma, urine, feces, and bile from intact rats and bile-duct can- nulated rats are presented in Table 6. In plasma, the Table 5. Recovery (MeanSD) of [14C]AG-024322 in Rats Following 30-min IV Infusion of [14C]AG-024322 at 10 mg/kg (~50 Ci/Rat). Total Radioactivity Recovered (%) Sample Time Interval Male (n=3) Female (n=2)a Overallb Urine 0-120 h 4.06 0.24 2.4 3.4 0.94 Feces 0-120 h 74.2 6.7 78.8 76.1 6.3 Cage Wash 0-120 h 7.28 12.3 0.31 4.47 9.52 Cage Wipe 0-120 h 0.24 0.21 0.36 0.29 0.23 Intact Rats Total 0-120 h 85.8 9.4 81.8 84.2 7.7 Bile Duct-Cannulated Rats Bile 0-48 h 55.5 11.2 (n=2) a. one female rat excluded from calculation of the mean, as a result of difficulties during infusion; b. male and female combined. 1400.0 1200.0 1000.0 800.0 600.0 400.0 200.0 0.0 0.020. 0040.0060.00 Parent Glucuronide AG-02432 2 M12 M13 M14 M6 M16 DPM Time (min) Ur 1.9 1.4 0.9 0.4 -0.1 Openly accessible at Plasma AG -0 2432 2 Parent Glucuronide 0.0020. 0040.0060.00 Time (min) ARC(CPM) i n e Urine 0.00 700.0 600.0 500.0 400.0 300.0 200.0 100.0 0.0 20.0040.00 60.00 Parent Glucuronide AG -024322 M12 M13 M14 M6 UN K M15 M16 Feces DPM Time (min) Feces Plasma 650. 0 600.0 550.0 500.0 450.0 400.0 350.0 300.0 250.0 200.0 150.0 100.0 50.0 0.0 0.0020.0040.00 60.00 Parent Glucuronide AG -02 4322 M12 M13 M14 M6 M16 Bile Bile DPM Time (min) Figure 6. Representative radiochromatograms of plasma, urine, fecal, and bile samples from rats following 30-minutes IV infusion of [14C]AG-024322 at 10 mg/kg (50 µCi/250 g body weight).  W. Z. Zhong et al. / HEALTH 1 (2009) 249-262 SciRes Copyright © 2009 Openly accessible at http://www.scirp.org/journal/HEALTH/ 258 parent drug was the predominant radioactive component, accounting for 80-88% of the circulating radioactivity, whereas the parent glucuronide represented 3-5% of circulating radioactivity. In urine, the parent drug and parent glucuronide represented the two major radioactive components, accounting for 1-1.2% and 0.6-1.2% of the dose, respectively. In feces, the major drug-related com- ponents included the parent drug, the parent glucuronide and M13, accounting for 9-19%, 12-29% and 9-21% of the dose, respectively. In bile-duct cannulated male rats, the major biliary drug-related components were the par- ent drug, the parent glucuronide and M13, accounting for 16%, 9% and 8% of the dose, respectively. 3.6. Structure Elucidation of In Vivo Metabolites in Rats The tentative structures of the metabolites observed in rats were proposed based on the product ion mass spec- trum generated for each identified metabolite peak by ionspray LC-MS/MS. The combined Q1, product ion, and multiple reaction monitoring scanning techniques were used for the structure elucidation. The proposed structure of each metabolite, along with the interpreta- tion of its MS/MS spectrum is presented in Scheme 3. The parent glucuronide had an radiochromatogram re- tention time of 25.4 min and an [M+H]+ ion at m/z 595 (=419+176) consistent with a direct glucuronide of the parent AG-024322. The product ion mass spectrum showed major fragment ions at 550, 419, and 374. M6 had a retention time of 38.2 min and showed an [M+H]+ ion at m/z 391 (=419–28) resulted from N-desethylation of AG-024322. The product ion mass spectrum of M6 gave a major fragment ion of 374. M12 had a retention time of 19.2 min and an [M+H]+ ion at m/z 567 (=419– 28+176) consistent with a glucuronide of M6. The product ion mass spectrum of M12 gave fragment ions of 550, 391 and 374. M15 showed a retention time of 49.2 min, and exhibited [M+H]+ at m/z 392 (=419-27), which is likely formed through desethyl amination of AG-024322. The product ion mass spectra gave frag- ment ions of 392 and 374. M13 exhibited [M+H]+ at m/z568 (=419-27+176) consistent with a glucuronide of M15. The retention time of M13 was 27.0 min and the MS/MS mass spectrum yield fragment ions of 568 and 392. M16 exhibited [M+H]+ at m/z 433 (=419+14), re- NN N N N F NH2 F Gluc NN N N N F N F NN N N N F N F Gluc NN N N N F NH2 F N NN N N N FF Gluc NN N N N F OH F N NN N N N FF O Gluc NN N N N F OH F NH2C2H5 NH3 NH2C2H5 OH2 O AG-024322 (m/z 419) M6 (m/z 391) M12 (m/z 567) M13 (m/z 568) M14 (m/z 609) M15 (m/z 392) - 2H -2H Parent Glucuronide (m/z 595) 550 419 374 374 374 374 550 391 374 - 392 433 550 374 415 433 - 374 391 M16 (m/z 433) Scheme 3. Proposed metabolic scheme of AG-024322 in rats.  W. Z. Zhong et al. / HEALTH 1 (2009) 249-262 SciRes Copyright © 2009 Openly accessible at http://www.scirp.org/journal/HEALTH/ 259 Table 6. Metabolite Profiles of AG-024322 in plasma, urine, feces, and bile from rats administered [14C] AG-024322 in- travenously. Mean % Radiochromatogram for Plasma and Mean % Dose for Urine, Feces and Bile Matrix (Time) Gender Parent Gluc M6 M12M13 M14UnkAG-024322 M15 M16 Pooled male 4.52 87.70 Plasma Pooled female2.61 80.06 Male average1.19 0.19 0.090.35 0.09 1.21 0.13 Urine Female average0.55 0.05 0.05 1.07 Male average11.61 2.80 2.0421.343.161.439.44 3.16 4.36 Feces Female average28.98 1.04 1.669.39 1.202.9718.97 1.86 1.15 Bile Male average 8.99 2.62 1.148.28 1.19 16.13 4.13 : not detectable using either LC-MS or RAM; : Trace metabolites detected using LC-MS only; Parent Gluc: parent glucuronide, M1, M2 or M3 (M.W. 594); M6: N-desethylated metabolite of AG-024322 (M.W. 386); M12: Glucuronide of M6 (M.W. 566); M13: Glu- curonide of M15 (M.W. 567); M14: Glucuronide of M16 (M.W. 608); M15: Desethyl amination metabolite of AG-024322 (M.W. 391); M16: Combined mono-oxygenation and dehydrogenation product of AG-024322 (M.W. 432); Unk: Unknown/unidentified metabolite. sulted from a combined mono-oxygenation and dehy- drogenation of AG-024322. The retention time of M16 was 50 min, and its MS/MS mass spectra gave fragment ions at 433, 415 and 374. M14 demonstrated [M+H]+ at m/z 609 (= 419 + 14 + 176) consistent with a glucuron- ide of M16. M14 had a retention time of 28.3 min and its mass spectra gave major fragment ions of 609, 550, 433 and 374. The chemical structure of unknown (Unk) can- not be determined with no mass spectrum data available. 4. DISCUSSIONS The in vitro metabolism of AG-024322 was initially in- vestigated in liver microsomes incubated with [14C]AG- 024322 to assess the metabolic stability across species. The experiments were performed with NADPH only to reflect Phase 1 metabolic activity. Subsequent studies were also conducted using hepatocytes, which has a complete ensemble of metabolizing enzymes of all iso- forms, cofactors, and cellular components, providing an alternate assessment of in vivo clearance particularly for compounds that are mainly cleared via glucuronidation [10,11]. AG-024322 exhibited the highest metabolic stability in both human hepatocytes and liver micro- somes as compared to other nonclinical species (Table 1). Extensive microsomal metabolism in the rat and dog was observed, which is consistent with the high in vivo clearance observed in these species. The metabolites identified in human liver microsomes and hepatocytes were also observed in the nonclinical species evaluated. Several in vitro metabolites of AG-024322 were tenta- tively identified from microsome and hepatocyte incuba- tions using chromatographic resolution, and concurrent radiometric and mass-selective quantification (Figure 1; Scheme 2). These metabolites including the unidentified metabolites as well as the parent drug account for all the major peaks of radioactivity in microsomes and hepato- cytes. The N-desethyl metabolite and glucuronides of the parent drug were major metabolites observed across species. The monkey exhibited the highest extent of glu- curonidation in hepatocytes, while dog and rat demon- strated more extensive N-desethylation and methylation/ N-acetylation in hepatocytes, and produced novel uni- dentified metabolites in microsomes. Metabolism of AG- 024322 in human hepatocytes and HLM is more compa- rable to those in monkeys. Both species demonstrated glucuronodation and oxidative N-desethylation as the predominant metabolic pathways. The excretion mass balance study conducted in rats dem- onstrated that the primary route of excretion of [14C]AG- 024322 was via feces (76.5%) with minimal contribu- tions (3.2%) of urinary excretion (Table 5). The high fecal elimination is reflected by biliary elimination that accounted for approximately 56% of the total radioactiv- ity within 48 hours of dosing. As proposed in Scheme 3, the glucuronide of the parent drug and M6 identified in vitro were also observed in rats following 30-minute IV infusion of [14C]AG-024322. Only one parent glucuron- ide, likely M3 based on the retention time, was observed in rats, which was consistent with the findings that only M3 was detected in the rat hepatocyte incubations (Fig- ure 1 and Table 2). The parent glucuronide appeared to be the most abundant metabolite in plasma and in all excreta collected, representing up to 29% of dose in fe- ces. Another major metabolite, M13, was the glucuroni- dation product of a desethyl aminated metabolite (M15), representing up to 21% of dose in feces, as UGTs are primarily involved in conjugation of metabolites from oxidation reactions. M6, M15 and M16 were oxidative metabolites, each representing less than 5% of dose, and were also further conjugated to its glucuronides. The metabolite profile in bile (Table 6) is supportive to the findings of extensive biliary excretion, which involves conjugation of the parent drug and oxidative metabolites with glucuronic acid prior to excretion into the bile and direct secretion of the parent drug into bile.  W. Z. Zhong et al. / HEALTH 1 (2009) 249-262 SciRes Copyright © 2009 Openly accessible at http://www.scirp.org/journal/HEALTH/ 260 Reaction phenotyping studies using the standard bat- tery of microsomes from insect cells expressing individ- ual human CYPs or UGTs were conducted to assess the two principal pathways of AG-024322 biotransformation; oxidation and glucuronidation. The formation of M6 in human recombinant demonstrated the predominant role of CYP3A4 enzyme in the oxidative metabolism of AG- 024322. The relative contribution of the identified CYPs was subsequently examined by inhibition studies with CYP-selective inhibitors. As shown in Table 2, only ketoconazole (selective CYP 3A inhibitor) inhibited N- desethylation of AG-024322 with up to 86% inhibition in HLM over an 8-minute of incubation. Quinidine, quercetin or furafyline had no inhibitory effects in the formation rate of N-desethylation. Quinidine is also a known CYP3A heterotropic activator [12], and in this case yields indirect additional evidence towards pre- dominant participation of CYP3A enzymes (Table 3). Formation kinetics of this pathway were also examined in a set of representative human liver microsomes and resulted in an apparent Km of 10 µM and Vmax of 20 pmol/mg/min. The in vivo CLint and CLh extrapolated from the in vitro kinetic data [13] were estimated to be 1.86 and 1.7 ml/min/kg, respectively. According to the projected human clearance from interspecies scaling (12.8 ml/min/kg, data not shown), the formation of M6 was estimated to contribute 13% of the hepatic clearance. Glucuronidation catalyzed by UGTs is one of major pathways for drug metabolism and elimination in hu- mans. Identification of the UGTs responsible for glu- curonidation of AG-024322 in vitro would assist in the prediction of adverse reactions resulting from drug-drug interactions or genetic polymorphism. The integrated approaches used here for UGT reaction phenotyping were using recombinant enzymes and human liver mi- crosomes with primary focusing on identification of the well-characterized hepatic UGTs, lA1, 1A3, 1A4, 1A6, 1A8, 1A10, 2B7 and 2B15. The involvement of UGT1 A1 was demonstrated from the UGT recombinant incu- bation experiments, resulting in three glucuronides, which were identical with the M1, M2 and M3 peaks that also observed in human hepatocyte incubations. UGT1A1 is a polymorphic isoform responsible for the glucuronidation of structurally diverse drugs, non-drug xenobiotics and endogenous compounds (e.g. bilirubin and estrogens) [14,15]. It is the primary UGT responsi- ble for bilirubin glucuronidation. UGT1A1 is highly expressed in liver, gastrointestinal tract, and bladder [16-18]. It has been reported that genetic polymorphisms of the UGT1A1 gene were significantly related to severe toxicity of irinotecan [19-21]. AG-024322 showed high affinity towards UGT1A1 in vitro. Potential interaction liability of AG-024322 with drugs metabolized by UGT1 A1 is also an area of great interest and warrants addi- tional studies. It is of concern if glucuronidation via UGT1A1 plays a major role in the elimination of AG- 024322 in humans as competitive inhibition of UGT1A1 may be associated with toxicity, and in patients exhibit- ing compromised bilirubin metabolism [22]. Formation kinetics of the three glucuronides of AG- 024322 were further investigated in the same set of hu- man liver preparation as that for the formation kinetic study of oxidative metabolism. Both phosphate buffer (pH 7.1) and WEM for this system were evaluated. WEM is a carbonate-based hepatocyte media reagent. Engtrakul [11] examined the effects of microsome incu- bation condition on the formation of AZT-glucuronide, including various physiological and nonphysiological buffer systems, such as Tris, phosphate, acetate, carbon- ate, citrate buffers and WEM. Their experiments sug- gested that both carbonate buffer and WEM produced significantly higher amounts of AZT-glucuronide than other buffers. Therefore, we also included the WEM in the formation kinetic system to compare with the com- monly used phosphate buffer. Based on the in vitro CLint, the extrapolated total in vivo CLint for the three glu- curonides, M1, M2 and M3, was 1.25 and 5.25 ml/ min/kg using phosphate buffer and WEM, respectively, contributing 10% and 37% of the predicted human plasma clearance. In agree with the findings by Engtra- kul et al. [11], we also found that in the case of glu- curonidation of AG-024322, WEM appeared to be a more physiologically relevant buffer yielded almost 4- fold higher intrinsic clearance by glucuronidation than the phosphate buffer. Additional studies to examine the impact of WEM, and more importantly, its components to probe the function of UGTs in vitro are warranted. In combination of both contributions for CYP3A mediated N-desethylation and UGT1A1-mediated glucuronidation, total metabolic clearance could account at best for 50% of the predicted human plasma clearance using WEM. This value may be an underestimation since our calcula- tion did not account for the biliary excretion, formation of oxidative metabolite other than M6, and glucuronida- tion of Phase I metabolites, which might be significant consideration based on the findings from the excretion study in rats. Caution should be made when extrapolat- ing metabolic lability via glucuronidation of UGT en- zymes from HLM, since this system appeared to under- estimate the degree of clearance (UGT 1A1 is expressed in human and rat and in general exhibited comparable substrate specificities and efficiencies (Vmax/Km) of the glucuronide formation, and thus rat and human UGT1A1 are functionally similar [23,24]. It is expected to have comparable glucuronidation profiles between rats and humans in vivo. In our calculation for the well-stirred model, protein binding value was not used. AG-024322 was highly bound to human plasma (95%). If the plasma protein binding of AG-024322 is included in the expression de- scribing the well-stirred model of hepatic extraction and if the scaling-up in vitro intrinsic clearance used without  W. Z. Zhong et al. / HEALTH 1 (2009) 249-262 SciRes Copyright © 2009 Openly accessible at http://www.scirp.org/journal/HEALTH/ 261 microsome binding data, the projected in vivo clearance is drastically lower. Obach [25] examined the in vivo hepatic clearance predicted from the in vitro system with the measured in vivo clearance and was found that in some cases, the clearance predicted from in vitro using HLM were substantially lower than those observed in vivo. The compounds exhibiting such a discrepancy were all characterized by high protein binding. When plasma protein binding values were removed from the well- stirred model for these compounds, scaled-up values for clearance were remarkably close to those measured in vivo [26]. Therefore, as an initial estimation of the con- tribution of the two major metabolic pathways in AG- 024322 clearance, the protein binding value was not used in the well-stirred model, and was found to be more reasonable in the clearance projection. 5. CONCLUSIONS Investigation of in vitro and in vivo metabolism of AG-024322 demonstrates that UGT1A1 mediated glu- curonidation and CYP3A mediated oxidation represent the major metabolic pathways of AG-024322. The esti- mated contribution of the glucuronidation to total plasma clearance in humans was approximately 3-fold higher than that from desethylation of AG-024322. Using the WE M buffer system in human liver microsomes to as- sess the metabolic pathway by glucuronidation improved the clearance predictability of AG-024322. Because of the polymorphism of UGT1A1 and the reported toxicity associated with competitive inhibition of UGT1A1 either by a co-administered drug or in patients exhibiting com- promised bilirubin metabolism, this information was used to influence the clinical study design to only in- clude subjects having normal expression of UGT1A1 in the first human study thereby decreasing the toxicity risk to patients. 6. ACKNOWLEDGMENTS Authors would like to thanks Drs. Hai-Zhi Bu and Deepak Dalvie for helpful discussion in structure elucidation of AG-024322 metabolites, Drs. Weiwei Tan and Rachel Courtney for the discussion of the human study design and sharing the human pharmacokinetic data with us, and Drs. Scott Fountain, Bill Smith, Ellen Wu and Bhasker Shetty for their invaluable comments and support of this project. 7. ABBREVIATIONS CDK, cyclin-dependent kinase; HLM, human liver mi- crosome; CYP, cytochrome P450; UGT, UDP-glucurono syltransferase; UDPGA, UDP-glucuronic acid; WEM, Williams E medium; HPLC, high-performance liquid chromatography; MS, mass spectrometry; min, min- ute(s); IS, internal standard; RAM, radiochemical activ- ity monitor. REFERENCES [1] Zhang, C.C., Kephart, S., McAlpine, I., Nonomiya, J., Higgins, J., Arango, M.E., Yan, Z., Knighton, D., Ferre, R.A., Tikhe, J., et al. (2005) AG-024322 is a potent and selective multi-targeted CDK inhibitor with broad spec- trum anti-proliferative activity. Proc Amer Assoc Cancer Res, 46, Abstract #4415. [2] Morgan, D.O., Fisher, R.P., Espinoza, F.H., Farrell, A., Nourse, J., Chamberlin, H. and Jin, P. (1998) Control of eukaryotic cell cycle progreesion by phosphorylation of cyclin-dependent kinases. Cancer J Sci Am, 4, S77-83. [3] Morgan, D.O. (1997) Cyclin-dependent kinases: engines, clocks, and micoprosessors. Annu Rev Cell Biol, 13, 261-291. [4] Moriarty, K.J., Koblish, H., Johnson, D.L., Galemmo, J. and Robert, A. (2007) Progress in the development of agents. Top Med Chem, 1, 207-291. [5] Zhang, C.C., Troche, G., Yen, Z., Arango, M.E., Higgins, J., Romero, D., Kephart, S., McAlpine, I., Koudriakova, T. and J. Skaptason, et al. (2005) AG-024322 is a multi- targeted CDK inhibitor with potent antitumor activity in vivo. Proc Amer Assoc Cancer Res, 46, Abstract #4413. [6] Fisher, M.B., Campanale, K., Ackermann, B.L., Vanden- Branden, M. and Wrighton, S.A. (2000) In vitro glu- curonidation using human liver microsomes and the pore-forming peptide alamethicin. Drug Metab Dispos, 28, 560-566. [7] Hamilton, R.A., Garnett, W.R. and Kline, B.J. (1981) Determination of mean valproic acid serum level by as- say of a single pooled sample. Clin Pharmacol Ther, 29, 409-413. [8] Venkatakrishnan, K., von Moltke, L.L., Court, M.H., Harmatz, J.S., Crespi, C.L. and Greenblatt, D.J. (2000) Comparison between cytochrome P450 (CYP) content and relative activity approaches to scaling from DNA- expressed CYPs to human liver microsomes: Ratios of accessory proteins as sources of discrepancies between the approaches. Drug Metab Dispos, 28, 1493-1504. [9] Stormer, E., von Moltke L.L. and Greenblatt, D.J. (2000) Scaling drug biotransformation data from cDNA-ex- pressed cytochrome P-450 to human liver: A comparison of relative activity factors and human liver abundance in studies of mirtazapin metabolism. J Pharmacol Exp Ther, 295, 793-801. [10] Gomez-Lechon, M.J., Donato, M.T., Castell J.V. and Jover, R. (2004) Human hepatocytes in primary culture: the choice to investigate drug metabolism in man. Curr Drug Metab, 5, 443-462. [11] Engtrakul, J.J., Foti, R.S., Strelevitz, T.J. and Fisher, M.B. (2005) Altered AZT (3'-azido-3'-deoxythymidine) glu- curonidation kinetics in liver microsomes as an explana- tion for underprediction of in vivo clearance: Comparison to hepatocytes and effect of incubation environment. Drug Metab Dispos, 33, 1621-1627. [12] Tang, W. and Stearns, R.A. (2001) Heterotropic coopera- tivity of cytochrome P450 3A4 and potential drug-drug interactions. Current Drug Metabolism, 2, 185-198. [13] Houston, J.B. (2001) Utility of in vitro drug metabolism  W. Z. Zhong et al. / HEALTH 1 (2009) 249-262 SciRes Copyright © 2009 http://www.scirp.org/journal/HEALTH/Openly accessible at 262 data in predicting in vivo metabolic clearance. BioChem Pharmacol, 47, 1469-1479. [14] Jansen, P.L., Mulder, G.J., Burchell, B. and Bock, K.W. (1992) New developments in glucuronidation research: Report of a workshop on “glucuronidation, its role in health and disease”. Hepatology, 15, 532-544. [15] Beutler, E. Gelbart, T. and Demina, A. (1998) Racial variability in the UDP-glucuronosyltransferase 1 (UGT1A1) promoter: A balanced polymorphism for regulation of bilirubin metabolism? Proc Natl Acad Sci, U.S.A., 95, 8170-8174. [16] Strassburg, C.P., Kneip, S. Topp, J., Obermayer-Straub, P., Barut, A., Tukey, R.H. and Manns, M.P. (2000) Poly- morphic gene regulation and interindividual variation of UDP-glucuronosyltransferase activity in human small intestine. J Biol Chem, 275, 36164-36171. [17] Tukey R.H. and Strassburg, C.P. (2000) Human UDP- glucuronosyltransferases: Metabolism, expression, and disease. Annu Rev Pharmacol Toxicol, 40, 581-616. [18] Nakamura, A., Nakajima, M., Yamanaka, H., Fujiwara R. and Yokoi, T. (2008) Expression of UGT1A and UGT2B mRNA in human normal tissues and various cell lines. Drug Metab Dispos, 60, 1461-1464. [19] Ando, Y., Saka, H., Ando, M., Sawa, T., Muro, K., Ueoka, H., Yokoyama, A., Saitoh, S., Shimokata, K. and Hase- gawa, Y. (2000) Polymorphisms of UDP- glucuronosyl- transferase gene and irinotecan toxicity: A pharmacoge- netic analysis, Cancer Res, 60, 6921-6926. [20] Mani, S. (2001) UGT1A1 polymorphism predicts iri- notecan toxicity: Evolving proof. AAPS PharmSci, 3, 1208-1303. [21] Lyer, L., Hall, D., Das, S., Mortell, M.A., Ramirez, J., Kim, S., Di Rienzo, A. and Ratain, M.J. (1999) Pheno- type-genotype correlation of in vitro SN-38 (active me- tabolite of irinotecan) and bilirubin glucuronidation in human liver tissue with UGT1A1 promoter polymor- phism. Clin Pharmacol Ther, 65, 576-582. [22] Kadakol, A., Ghosh, S.S., Sappal, B.S., Sharma, G., Chowdhury, J.R. and Chowdhury, N.R. (2000) Genetic lesions of bilirubin urdine-diphosphoglucuronate glu- curonosyltrabsferase (UGT1A1) causing Crigler-Najjar and Gilbert syndromes: correlation of genotype to phe- notype. Hum Mutat, 16, 297-306. [23] King, C.D., Green, M.D., Rios, G.R., Coffman, B.L., Owens, I.S., Bishop, W.P. and Tephly, T.R. (1996) The glucuronidation of exogenous and endogenous com- pounds by stably expressed rat and human UDP-glu- curonosyltrasferase 1.1. Arch Biochem Biophys, 332, 92-100. [24] King, C.D., Rios, G.R., Green, M.D. and Tephly, T.R. (2000) UDP-glucuronosyltrasferase. Curr Drug Metab, 1, 143-161. [25] Obach, R.S. (1996) The importance of nonspecific bind- ing in in vitro matrices, its impact on enzyme kinetic studies of drug metabolism reactions, and implications for in vitro-in vivo correlations. Drug Metab Dispos, 24, 1047-1049. [26] Obach, R.S. (1997) Nonspecific binding to microsomes: Impact on scale-up of in Vitro Intrinsic clearance to he- patic clearance as assessed through examination of war- farin, imipramine, and propranolol. Drug Metab Dispos, 25, 1359-1369. |