Int'l J. of Communications, Network and System Sciences
Vol.2 No.5(2009), Article ID:604,7 pages DOI:10.4236/ijcns.2009.25045
Network Delay Model for Overlay Network Application
School of Electronics and Information Engineering, BeiHang University, Beijing, China
Department of Enterprise Management, North China Electric Power University, Beijing, China
Email: jintian@buaa.edu.cn, jhy99@263.net
Received May 6, 2009; revised June 11, 2009; accepted July 8, 2009
Keywords: Network Model, Autonomous System, Overlay Network
ABSTRACT
This paper presents a method to model network delay for overlay network application. The network topology measurement technology and network AS information is used to build up model of network delay via AS and geographic distance. Based on global Internet measurement result, we calculated the parameters of the model. Furthermore, the model verification is done by comparing on AS-MMI protocol and HMTP protocol.
1. Introduction
The network delay measurement in large scale overlay system become impossible due to the Internet expansion. So, in this paper we introduce a method of modeling network delay with AS and geographic distance. This method use network topology information to aid us know more information about the connectivity of Internet, and reduce the time and range of network delay measurement [1,2]. Contrast with network bandwidth, delay is more stable. Thus, the system can share a much more stable result of network topology measurement.
First, we will show how to measure the Internet topology. And then, we will show how to modeling the delay of network by the topology and geographic information. At last, we will demonstrate the protocol performance by using the model and ping result. That result shows our model of Internet can reflect network delay quite well.
2. Related Work
By knowing the location of a client host, an application, such as a Web service, could send the user locationbased targeted information, classify users based on location, and improve the performance of overlay application.
Previous work on the measurement-based geolocation of Internet hosts uses the positions of reference hosts [3, 4], called landmarks, with well-known geographic location as the possible location estimates for the target host. These might limit the accuracy of the resulting location estimation, because the closest reference host may still be far from the target.
Some applications such as GeoTrack, GeoPing and GeoCluster have developed to map IP-to-location information, but none of them has detailed model. In this paper, we will show how the model could be measured.
3. Topology Measurement
Some researches report that there are 36888 routers and 42269 links in 10 major AS. And number of AS over Internet has exceeded 18000.
Due to the bandwidth inside an AS is much more than inter-connection of AS, we can use the AS relationship to describe the network connectivity. In multimedia communication, network delay always happens between AS inter-connections. So, the network delay can be measured by the AS count of packet passed. According to Oregon University OIX project, we can gather the router information all over the world, and summarize the Internet connectivity relationship.
Though research in topology measurement is very popular, but most of them do not take geography into consideration [5]. With the development of network, the inter-connections between AS will become more and more short. The delay of network will mostly depend on
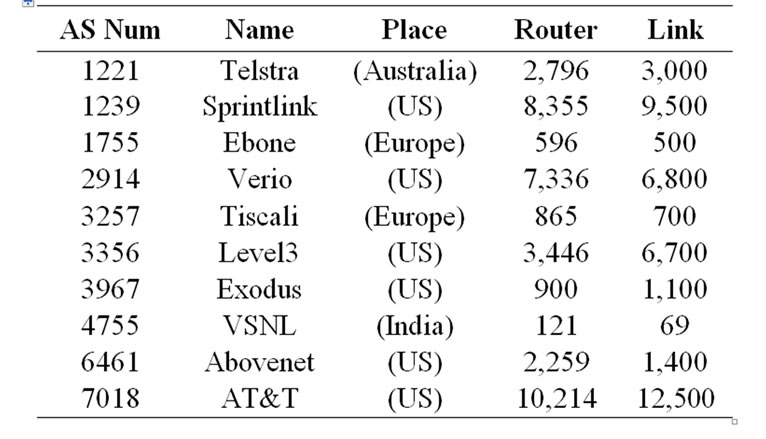
Table 1. Major AS network router and links.
geographic delay. So, the network delay can be modeled by AS and geographic distance. We will introduce the technique of deducing network delay by analyzing route information and generating network topology. The key issues contains, how to analyze AS information; how to generate AS connectivity and how to model geographic distance of AS.
The network topology measurement take four stages: The first is gathering Internet route table, analyzing BGP route and mapping between IP and AS. The second stage is analyzing BGP route and AS path. We can deduce AS connectivity at this stage and calculate shortest connectivity path of AS. The third stage is finding AS geographic information according to AS registry information. The last stage is calculating AS communication delay by AS and geographic information.
3.1. Gathering Route Information
BGP is an external gateway routing protocol of TCP/IP. It is designed for solving large scale network route problem. The BGP route is synchronized all over Internet, so it can reflect the topology of current Internet.
The path information of two Autonomous Systems is recorded in route table of all core routers. We can get the AS connectivity by analyzing these information. If the information is gathering from difference routers over the world, the topology will be more accurate.
Oregon University’s OIX project provided summary of some core router’s BGP route table. We can extract mapping between IP and AS from that table. For instance, following mapping can be obtained by previous route Table 2:
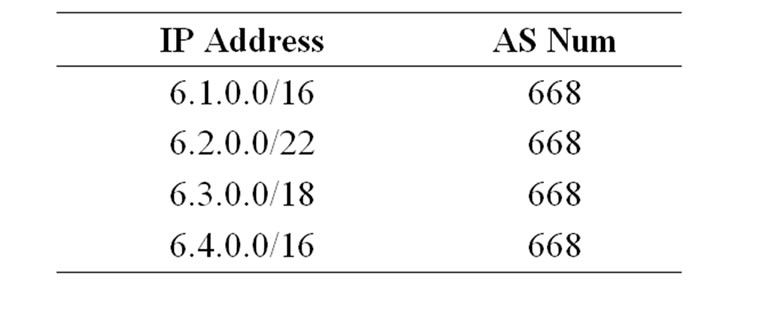
Table 2. IP-AS mapping from route table.
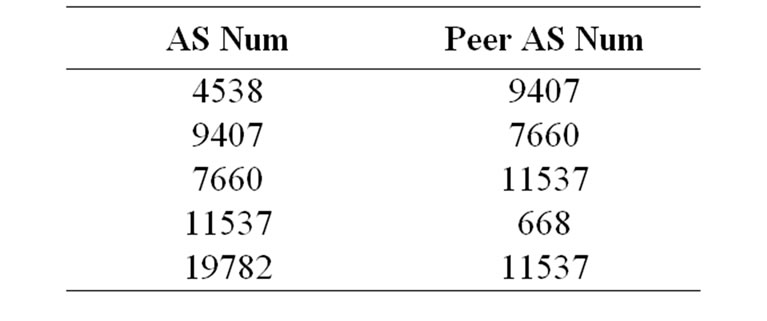
Table 3. AS peers listed in route table.
3.2. AS Information Analyzing
In BGP route table, AS path is the route path at AS level. So, analyzing AS path information, we can deduce the connectivity of AS. For instance, we can summarize the following connectivity of AS from the route Table 3:
According to BGP route data of Oregon University at year 2004, there are 18431 AS and 39886 links in Internet. The data briefly described how the Internet is connected at that time.
3.3. Analyzing AS Connectivity
We can calculate the shortest path between two AS by using shortest tree algorithm. The route protocol (such as OSPF) has taken the shortest path into consideration. The result will reflect the theoretical minimal distance between two AS, which is similar as actual distance [6,7]. We use the number of AS passed in communication (also called as AS length) to represent the distance of AS. The BGP route in Internet might always change, but most BGP route change does not interfere with AS length. The length of AS path is stable in most time.
We can deduce AS length by previous route example:
The distance of AS can be calculated via following algorithm:
Define  is, the set of AS directly connect with AS u.
Define 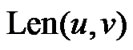 is, distance of AS u and AS v.
If “u v” or “v u” exist in AS path of BGP route Table 4,
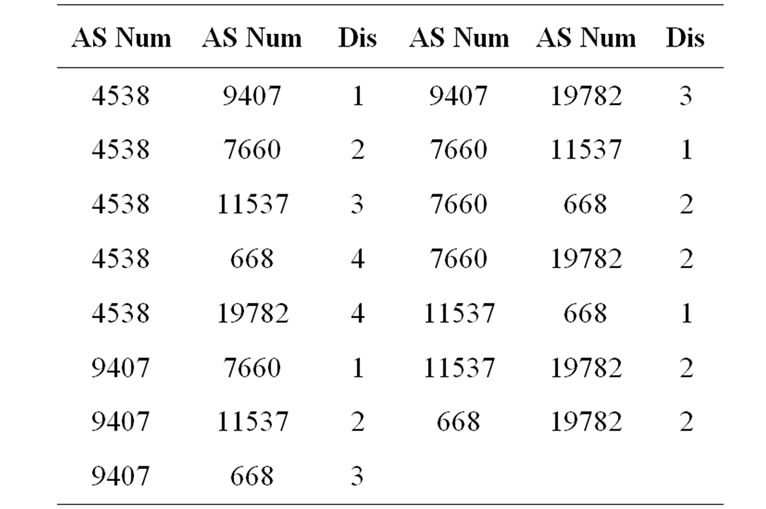
Table 4. AS distance according to route table.
then .
.
If , then
 . If
. If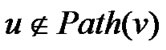 , then
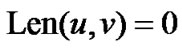 .
.
If , and
, and , and
, and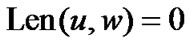 , then
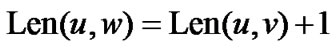 .
.
If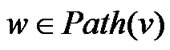 , and
, and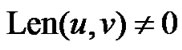 , and
, and , then
 .
.
According to BGP route data from Oregon University’s OIX project at year 2004, the average distance of AS is 3.765305, AS distance of 18431 AS is shown in Table 5:
3.4. Using Geographic Information
With the development of Internet and speed, the geographic ratio in communication delay will be increased. So, we must take the geographic delay into account [8]. For simple calculation, we can get the AS number by the IP address, and then get country information by AS registry. And the geographic distance can be calculated by the longitude and latitude information of that country. For mote accurate calculation, we can use city information rather than country information for calculation.
The information of IP Address and city, AS number and country information can be retrieval from whois server. The latitude and longitude information can be retrieval from NetGeo and other projects [6,7]. With the earth’s radius and following formula, we can calculate the theoretical distance of two nodes:
DISTANCE=R*ARCOS[SIN(A)SIN(C)
+COS(A)COS(C)COS(B-D)];
R is earth’s mean radius: 6371km.
(A, B) is latitude and longitude of node 1.
(C, D) is latitude and longitude of node 2.
The network delay consists of geographic delay and AS communication delay. So, we can calculate the backbone link delay and geographic delay by topology
Table 5. Summary of AS distance.
measurement result. The following formula shows the network delay model:
RTT=T(N) + P*D The P is related with current network condition.
D is the geographic distance between two nodes.
T(N) is the delay of AS length N between two nodes.
Based on measurement result, value of P and T is P=20us/km, T(2)=10ms, T(3)=55ms, T(4)=78ms, T(5)= 92ms. The Internet is in a changing state, so previous parameter will also change with Internet’s development. That value only reflects current Internet measurement result from Chapter 4.
4. Network Delay Analyze
The topology measurement is related with reality network, so we can not setup the topology measurement test with simulation. We use PlanetLab [9] node as source of reality measurement, and use ping (or extended tcpping [10]) to measure reality network delay. The comparison will confirm the relationship between AS length and network delay.
Due to the ping firewall in Internet, some ping measurement will not reach to some host. To get the better measurement result, we use TCP instead of ICMP for node delay test [1,2,11], and use connection confirm time instead of RTT time to represent network delay.
We use ScriptRoute’s packet data service to measure the network delay between node installed ScriptRoute. The TCP port 3355 is used for tcpping measurement instead of ICMP ping. The node from 83 AS and 129 nodes joined the test, they are distributed as Figure 1:
We select 14 nodes’ result, and make detail analyses for network topology model in Table 6 and Table 7.
According to AS distance calculation algorithm at previous chapter, we can get the AS distance of the nodes in Table 8 and Table 9.
After we summarize AS distance, geographic distance and RTT information from previous table, we can calculate network delay data from 81 nodes. Among the result, most of AS distance is 2 to 4, which is 88.9% of all data. The distribution of AS distance is shown at Table 10.
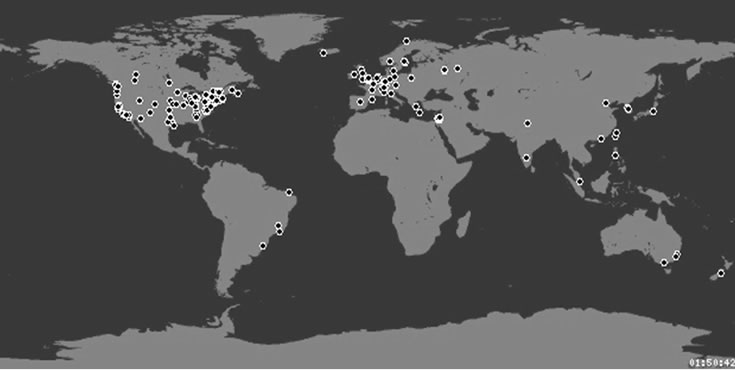
Figure 1. Topology measurement node distribution.
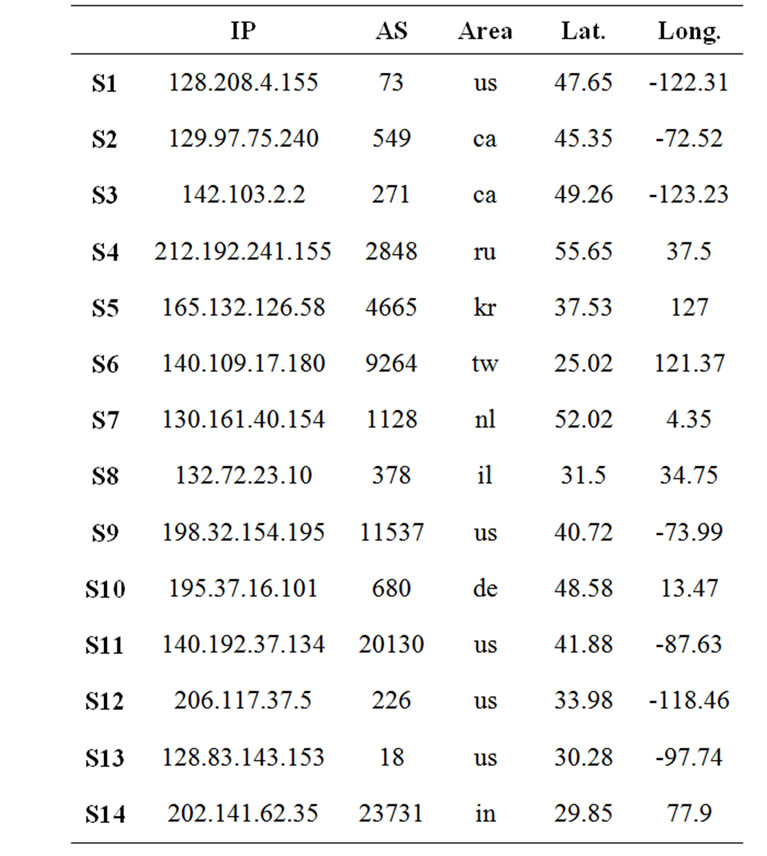
Table 6. Topology measurement node list.
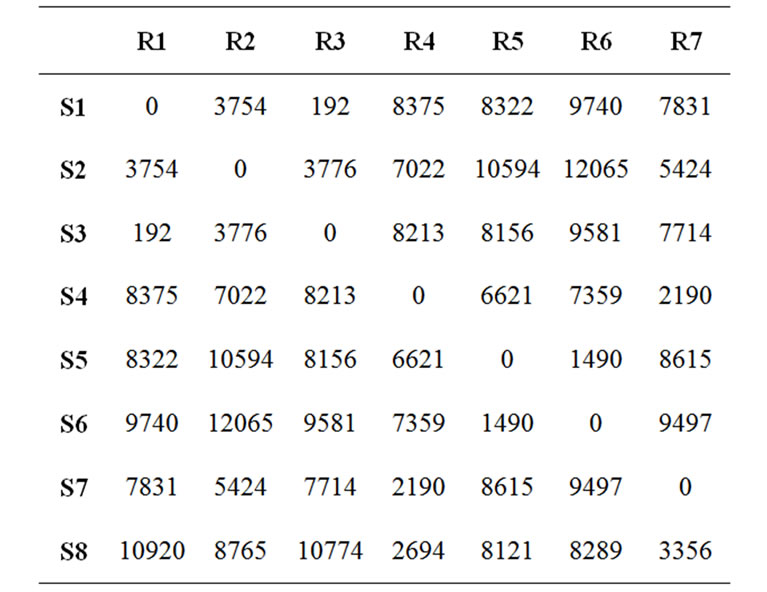
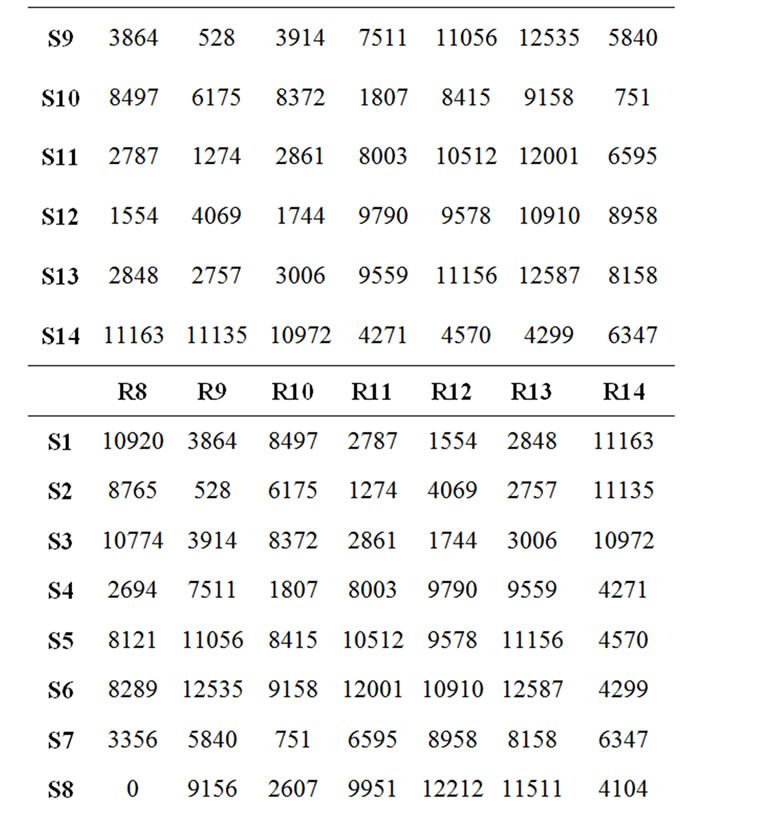
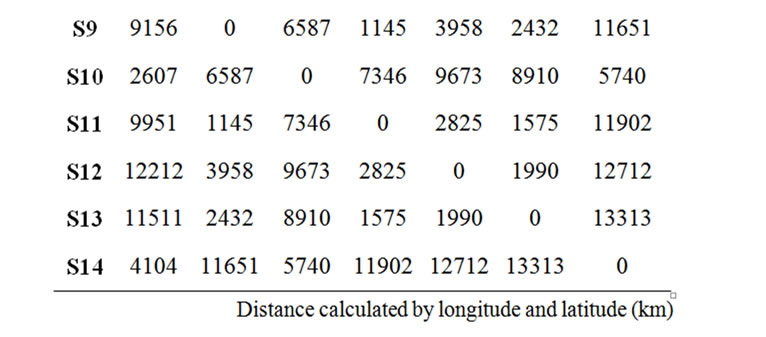
Table 7. The geographic distance (km).
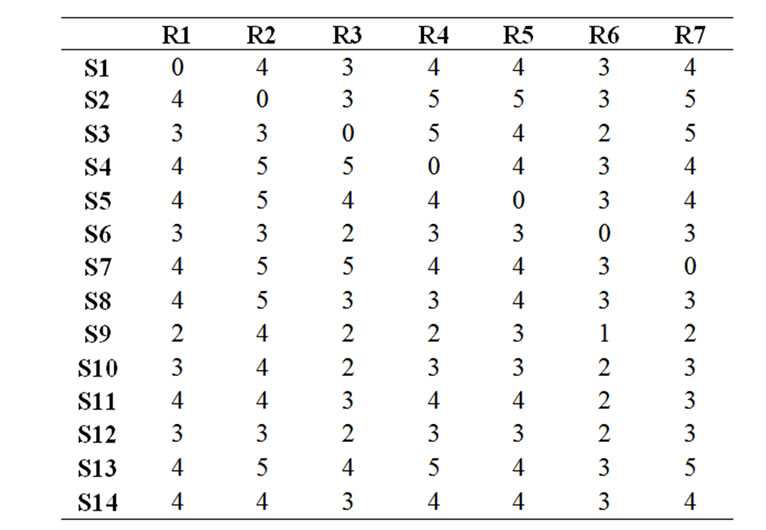
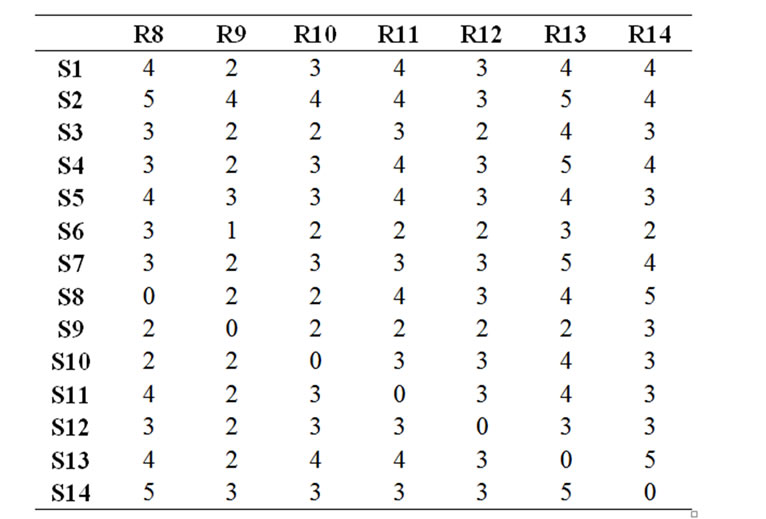
Table 8. Topology experiment AS distance.
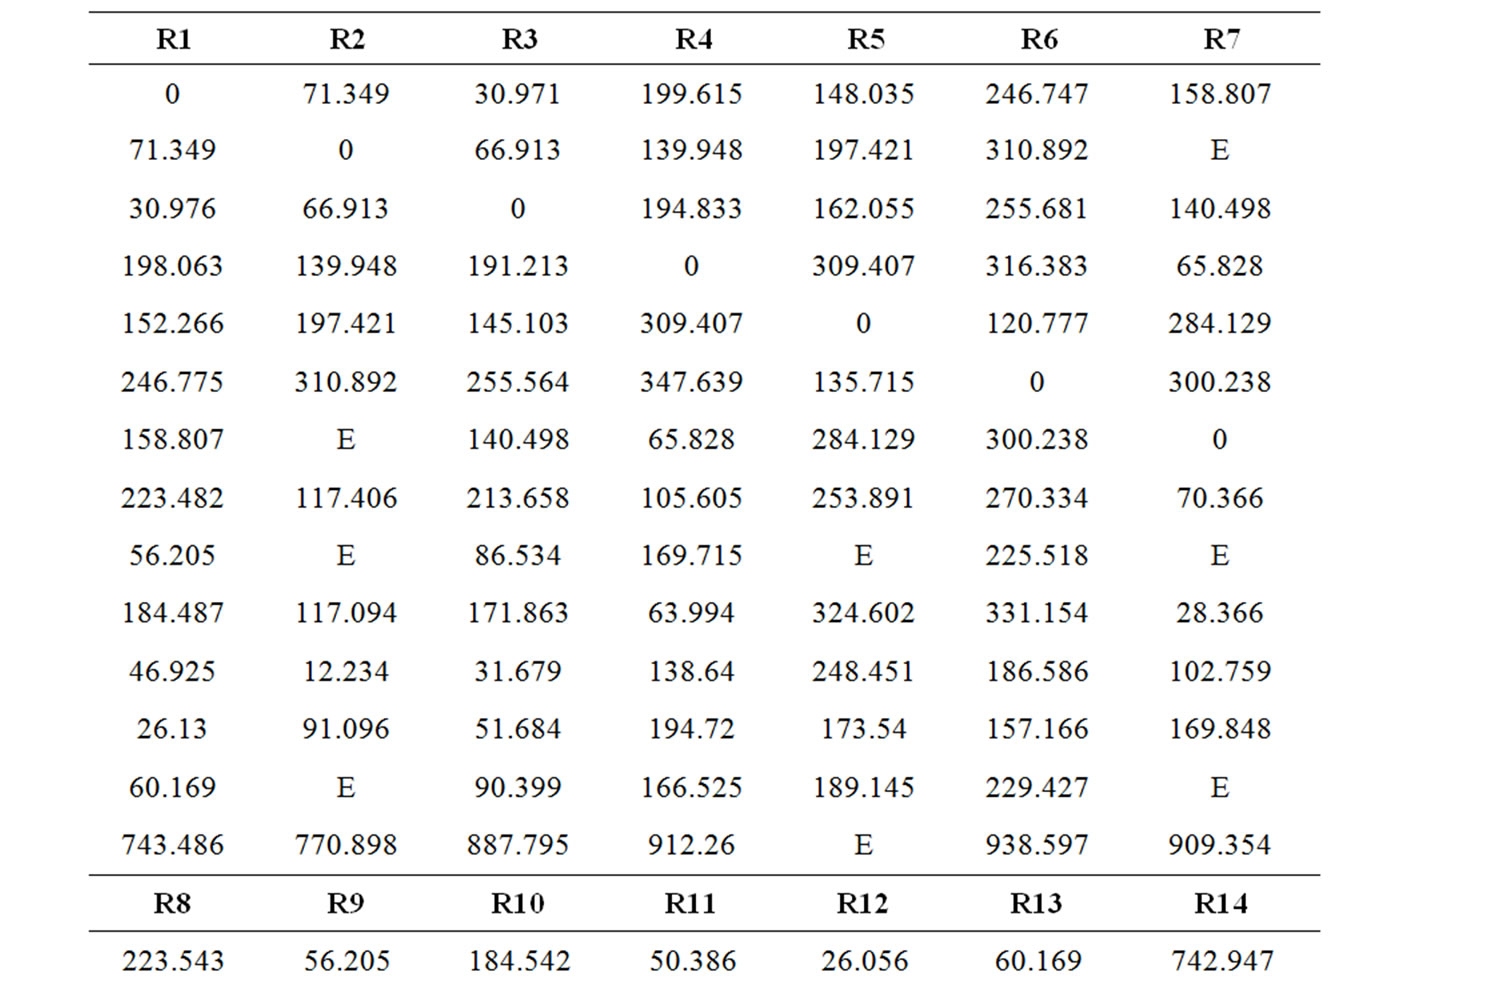
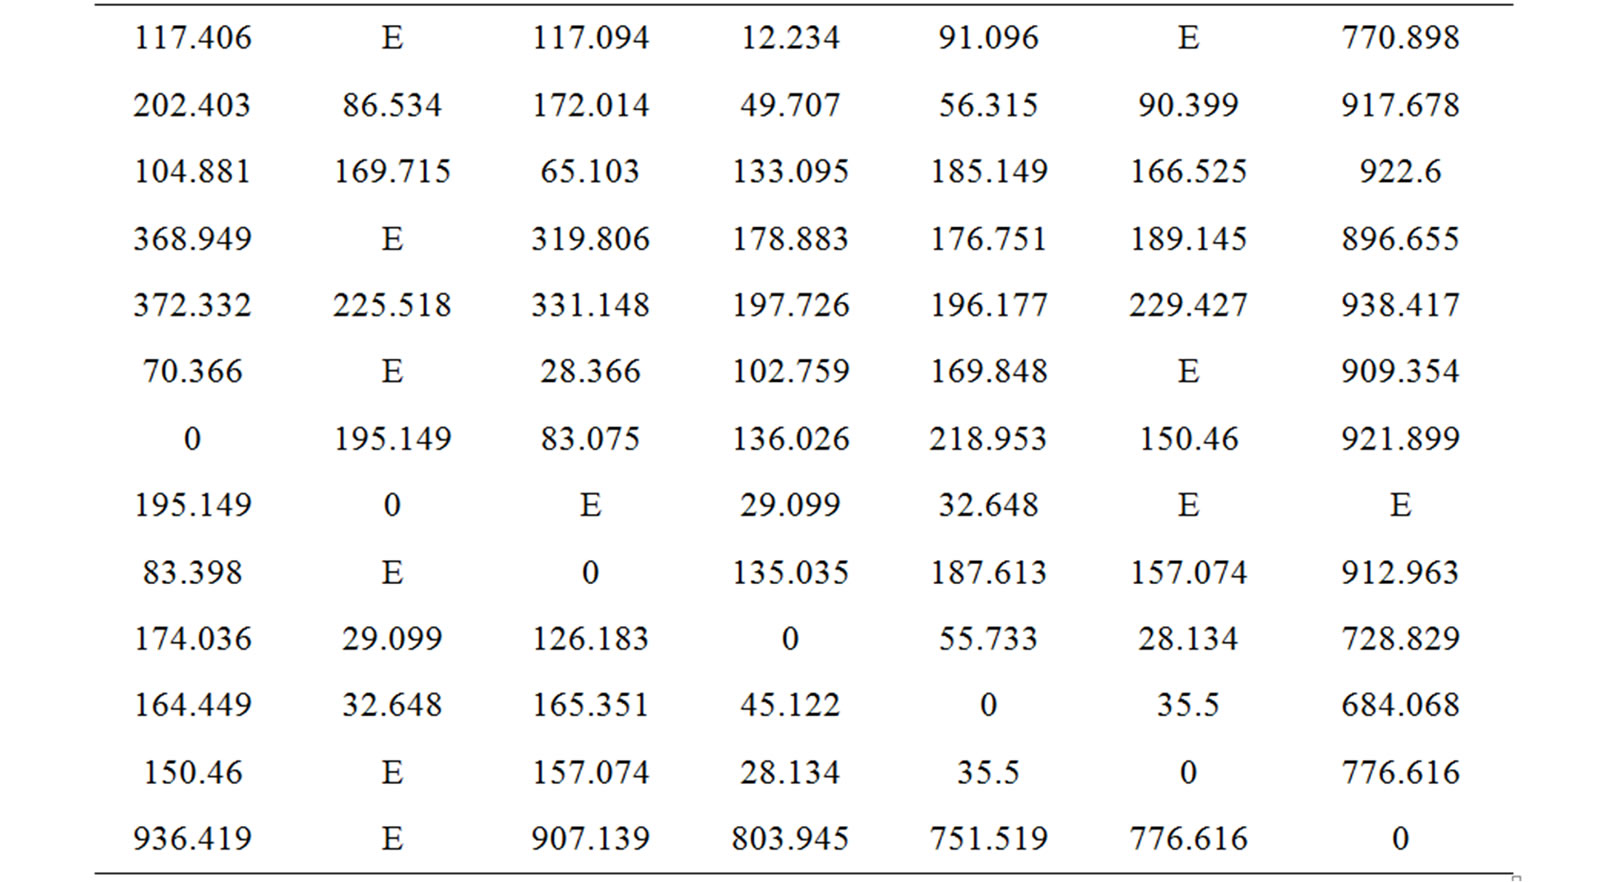
Table 9. RTT time (ms) measured by tcpping.
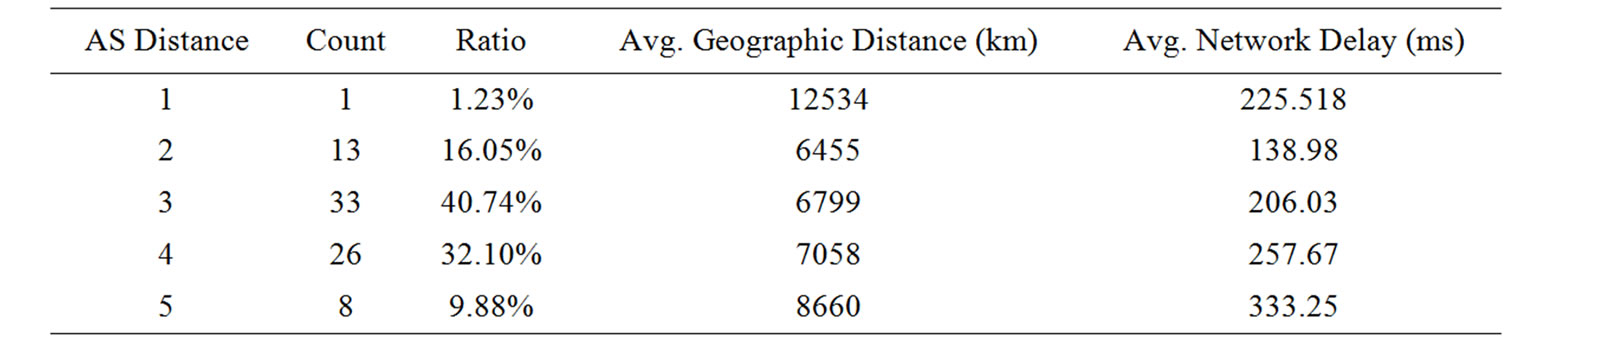
Table 10. Topology experiment result summary.
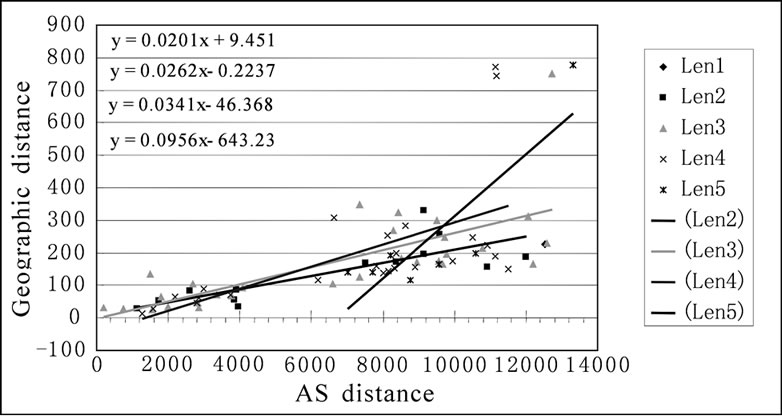
Figure 2. Network delay model.
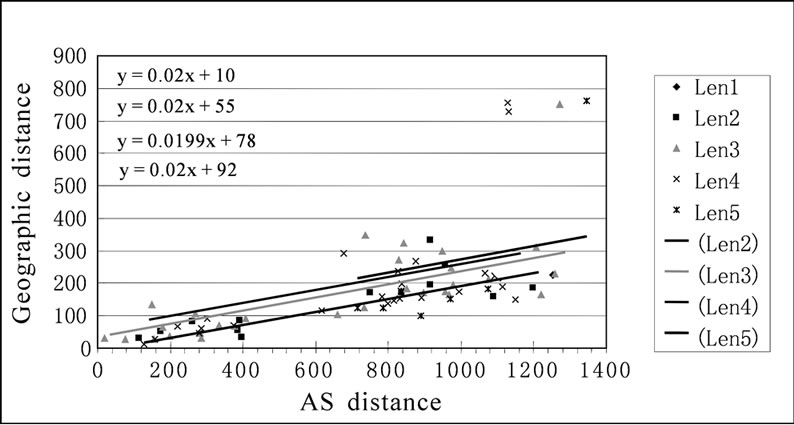
Figure 3. Normalized network delay model.
We can find from summary that the average geographic distance and network delay are dramatically increased when AS distance is increased. And the ratio of AS distance is similar as global value, in which ratio of AS distance from 1~5 is (0.0235%, 5.4715%, 35.6748%, 39.8139%, 15.3252%). From the result, we can draw the conclusion that there is relationship among AS distance, geographic distance and network delay.
Then we divided the measurement result into several groups based on AS distance. We can get the model of geographic distance and network delay in different AS distance by using linear regression method in Figure 2.
Due to the network delay cause by geographic distance is direct proportion with geographic distance, the different Linear Regression line should have same slope. So, we slightly adjust all the Linear Regression line’s slope into same value -0.02. The procedure is called as normalization. The model after normalization is shown in Figure 3:
From the result, the network delay can be calculated via following formula:
RTT=T(N) + P*D Inside, P is the parameter reflect geographic distance, P=20us/km.
D is the geographic distance of two nodes.
T(N) is the network delay caused by AS distance N, where T(2)=10ms, T(3)=55ms, T(4)=78ms, T(5)=92ms.
The result shows network delay seemed to be random, but it is related with geographic distance and AS distance. Commonly speaking, average network RTT delay will increase 0.02ms when geographic distance increase 1 kilometer; average network RTT delay will increase 11~45ms when AS distance increase 1.
5. Model Verification
We use the model of network delay in overlay network protocol design to test it [12]. We design an AS-MMI protocol based on MMI protocol for large scale multimedia communication. The gateway selection algorithm of AS-MMI protocol will use the model. By contrast, we use HMTP [13,14] for comparison, which will use partly measured RTT delay from previous table. The two protocols consider Shortest Path Tree (SPT) algorithm as best solution.
The performance experiment takes SPT algorithm for reference. And there are four factors to evaluate the time and quality of spanning tree.
Tree Cost means the cost of a tree is the sum of delays on the tree’s links. Tree cost is a convenient metric to measure total network resource consumption of a tree.
Tree Delay means the delay from one member to another along the tree. The ratio between tree delay and unicast shortest path delay is delay ratio.
Tree Time means the total time used to build the span
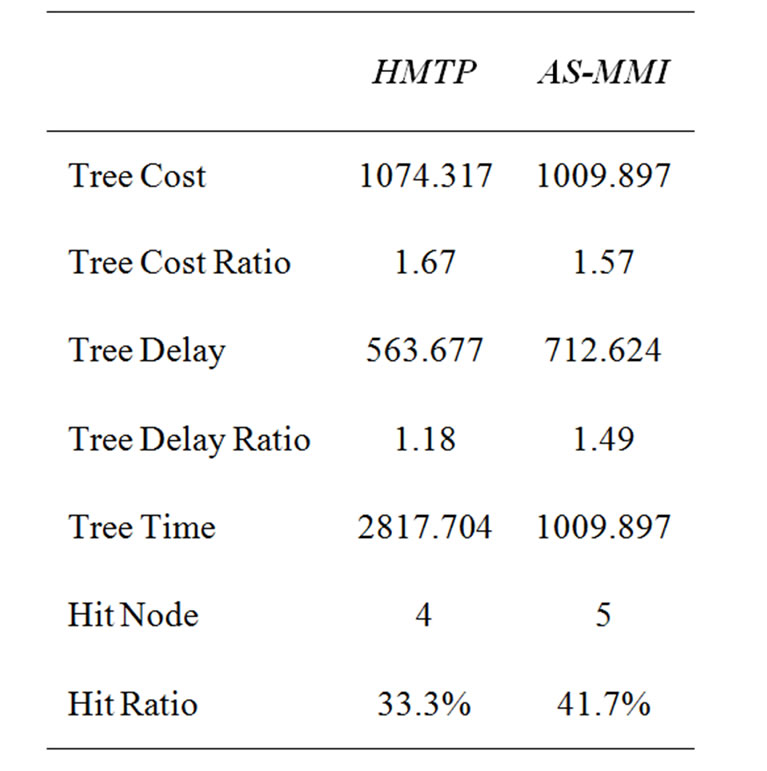
Table 11. Spanning tree result.
ning tree. The time can reflect the effectiveness of protocol.
Hit Ratio: If the delay of the node and its parent node is no more than 10% of delay in SPT algorithm. We considerate this node as a Hit node, which means the node’s delay is quite low. The ratio of hit node reflects how many nodes delay is acceptable.
Verification result is shown in Table 11:
We can find from previous table, AS-MMI protocol use much more short time in build up spanning tree than HMTP protocol. In spanning tree cost and hit ratio, the result of two protocols is similar. But the AS-MMI protocol will cause a little higher tree delay. That means the network model used by AS-MMI protocol can reflect most node’s network delay, and tree build speed is much faster. But the AS distance is only theoretical distance which might be different as actual distance, some nodes’ network delay might have errors. These nodes’ delay caused tree delay increase dramatically, but does not have much effect interfere with tree cost and hit ratio.
Overall, the network model used by AS-MMI protocol can provide a fast method to check the network delay between different nodes. And the result shows it is accurate for most nodes of AS-MMI protocol.
6. Acknowledgment
Many thanks to the network and research support from State Key Laboratory of Software Development Environment, BeiHang University.
7. References
[1] M. Jain and C. Dovrolis, “End to end available bandwidth: Measurement methodology, dynamics, and relation with TCP throughput,” Technical Report, University of Delaware, February 2002.
[2] M. Jain and C. Dovrolis, “Pathload: A measurement tool for end-to-end available bandwidth,” In Proceedings of Passive and Active Measurements (PAM) Workshop, March 2002.
[3] A. Ziviani, S. Fdida, J. F. de Rezende, and O. C. M. B. Duarte, “Improving the accuracy of measurement-based geographic location of Internet hosts,” Computer Networks, Vol. 47, No. 4, pp. 503–523, March 2005.
[4] V. N. Padmanabhan and L. Subramanian, “An investigation of geographic mapping techniques for internet hosts,” in Proceedings ACM SIGCOMM, San Diego, CA, pp. 173–185, August 2001.
[5] M. Kwon and S. Fahmy, “Topology-aware overlay networks for group communication,” In ACM NOSSDAV, 2002.
[6] P. Francis, S. Jamin, V. Paxon, L. Zhang, D. Gryniewicz, and Y. Jin, “An architecture for a global internet host distance estimation service,” Proceedings 18th IEEE Infocom'99, 1999.
[7] P. Francis, S. Jamin, C. Jin, Y. Jin, D. Raz, Y. Shavitt, and L. Zhang, “Idmaps: A global internet host distance estimation service,” IEEE/ACM Transactions on Networking, October 2001.
[8] R. Mahajan, N. Spring, D. Wetherall, and T. Anderson, “Inferring link weights using end-to-end measurements,” In ACM SIGCOMM Internet Measurement Workshop, 2002.
[9] Planet Lab Project, http://www.planet-lab.org/.
[10] ScriptRoute Project, http://www.scriptroute.org/.
[11] C. Dovrolis, P. Ramanathan, and D. Moore. “What do packet dispersion techniques measure?” Proceedings of IEEE INFOCOM, April 2001.
[12] S. Shi, “Design of overlay networks for internet multicast,” Ph. D. dissertation, Washington University, August 2002.
[13] B. Zhang, S. Jamin, and L. Zhang, “Host multicast: A framework delivering multicast to end users,” Proceedings of IEEE INFOCOM '02, 2002.
[14] B. Zhang, W. Wang, S. Jamin, D. Massey, and L. Zhang, “Universal IP multicast delivery,” Computer Networks: The International Journal of Computer and Telecommunications Networking, pp. 781-806, April 2006.
[15] T. Cicic, “Networklevel multicast deployment and recovery,” Ph. D. dissertation, October 2001.