Journal of Water Resource and Protection
Vol.4 No.9(2012), Article ID:22467,12 pages DOI:10.4236/jwarp.2012.49090
Analysis of Quality Mineral Water of Serbia: Region Arandjelovac
1Faculty of Agriculture, University of Belgrade, Belgrade, Republic of Serbia
2Institute for Technology of Nuclear and Other Mineral Raw Materials (ITNMS), Belgrade, Republic of Serbia
Email: *rajmi@agrif.bg.ac.rs
Received April 26, 2012; revised May 27, 2012; accepted June 5, 2012
Keywords: Mineral Water; Water Quality; Bicarbonate Water; Acidity; Alkalinity
ABSTRACT
In this paper it is presented the analysis of basic physical and chemical parameters, alkalinity and acidity, the analysis of kations, anions, heavy metals, microbiological analysis and determination of uranium content in waters of Serbia from 10 springs of Arandjelovac region and 2 samples of bottled drinking water. It is done by different methods of analysis according to which conclusion about the content and the quality of these waters can be made. The pH value of analysed waters shows that waters from springs Maiden spring, Ješovac, Vrelo and Svinčine are slightly acid, while mineral waters from springs Aleksijević, Exploitation and Talpara are slightly basic. The sample from Olga’s spring has slightly lower pH value. According to Regulation on the hygiene of drinking water, conductivity should be less than 1000 µS/cm. This condition is fulfilled by waters from springs Aleksijević, Talpara (ordinary), Maiden and Olga’s spring, Svinčine and water from city supply system. Springs Ješovac and Vrelo have slightly increased conductivity, while springs Exploitation and Talpara have conductivity significantly above the allowed values (mineral). Analysed natural mineral waters contain only hydrogencarbonates (bicarbonate). According to the content of bicarbonate it was concluded that samples from springs Exploitation, Talpara (mineral), Vrelo and Svinčine belong to the category of bicarbonate waters, as the content of hydrogencarbonate in these samples is higher than 600 mg/dm3. Analysed mineral waters don’t show acidity towards methyl orange, which means that acidity of analysed waters comes from dissolved carbon acid.
1. Introduction
Since the beginning of life on Earth till the present days, water has got an immense significance in evolution of life forms, so, it can be said that water is the condition of life preservance on Earth. Vast surfaces covered with water (more than 2/3 of total surface) and total water cubage of about 1400 million km3, make Earth “the blue planet”. But for all its enormous natural wealth, a huge number of population on Earth today is confronted with serious lack of fresh drinking water. From total amount of the world’s water reserves, even 97.3% is salty (sea) water (which refining into drinking water is still not economically profitable); 2.7% represents total amount of fresh water, which cannot be fully used. Only 0.3% of all world’s water resources is fresh unpolluted water which can be used without any treatment, for drinking or industrial and other purposes [1-3].
Modern society has been characterised by intensive industrialisation and urbanisation with vast exploitation of natural resources and endangering of environment as its consequence. In conditions of global development, care about water is the main issue for civilisation preserving. No matter how enormous are available amounts of water in nature, its usability has been significantly decreased by pollution. Water is not unlimited natural resources and must be rationally used. So water management and control of water quality become the basic human necessity.
Natural mineral water represents a huge national treasure which can also be used as bottled product, in order to satisfy necessity for drinking water quality. Today we can talk about modern technologic processes of preparation and filling of natural mineral water which represent a whole range of technologic operations which enable a consumer to receive a healthy, natural and quality product. All waters are mineral, table, natural, spring and all are drinkable. They only differ in the degree of mineralisation. The best classification of waters, for consumers, is into table drinking water and table mineral water.
Table drinking waters are all bottled natural spring waters used for drinking and they have no physiological attributes because of the low degree of mineralisation. Table mineral waters have higher degree of mineralisation and they have certain physiologic attributes because of their specific characteristics in content [4].
The purpose of this paper is the analysis of basic physical and chemical parameters, analysis of kations, anions, heavy metals, microbiological analysis and determination of uranium content in waters of Serbia from 10 springs of Arandjelovac region and 2 samples of bottled drinking water. It is done by different methods of analysis according to which the conclusion about the content and the quality of these waters can be made. Waters from springs in Arandjelovac and its surroundings have been used for a long time, in medical purposes, as well as bottled products. Beneficial effects and quality of waters of Arandjelovac region were analysed for the first time by the first chief of medical service in Serbia, Dr Emerich Lindemeier in 1836, and quality of these waters was confirmed by professor Sima Lozanić in 1874.
2. Experimental
The control of water quality demands representative physical, chemical and microbiologic analysis, as well as adequate choice of quality parameters. To analyse water quality, it is not only significant which parameters will be analysed but also the way of taking samples, its preservation and keeping and starting with the analysis itself. Methodology of taking samples, its frequency, the amount of samples as well as preservation, depends on both quality parameters which will be analysed and the characteristics of water samples. In this paper, a taken water sample was used. At places where the constant flow of spring is present, water samples were taken into 5 dm3 plastic bottles (PET bottles 5L), during the autumn in 2010, and samples were not conserved. A pailful of well water was taken and put into packing material for samples. At springs with faucet, water was left running for 5 minutes before taking a sample. The temperature and conductibility of samples was measured at the place where they were taken.
The analysed water samples, as well as places where the samples were taken are shown in Table 1 (and Figure 1). As there is the factory for production of bottled water ”Knjaz Miloš” in Arandjelovac, two commercial products of bottled drinking waters were analysed: non-carbonated Aqua Viva and carbonated Knjaz Miloš.
3. Materials
12 samples of water and 28 parameters of all waters were analysed [5]. The following techniques used for sample analysis: ion chromatography (IC, anions), titration (alkalinity), photometric methods ( ), potentiometric methods (pH), conductometric method (EC), ion selective electrode (ISE). Detailed analytical procedures are described below. Analytical method and detector limit for all measured parameters are given in Table 2 [6].
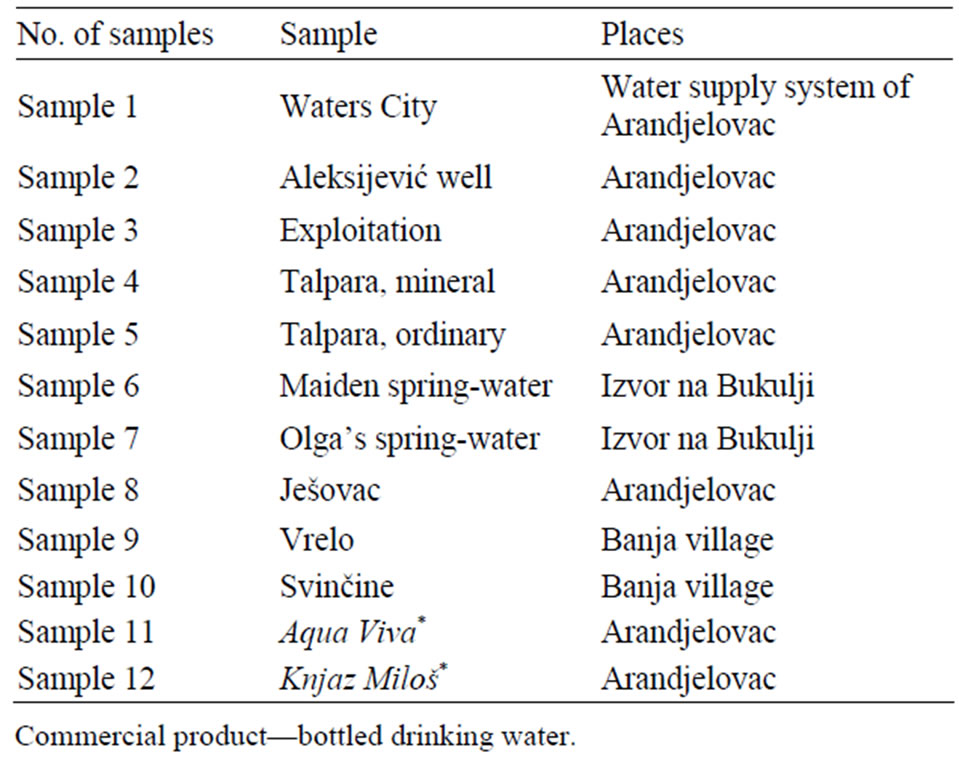
Table 1. The analysed water samples and places where the samples were taken.

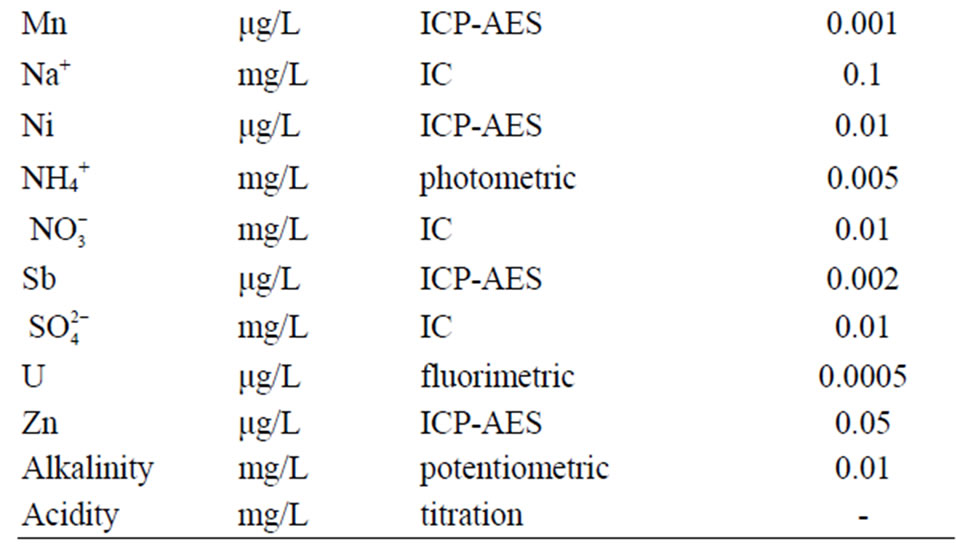
Table 2. Analytical method and detection limit.
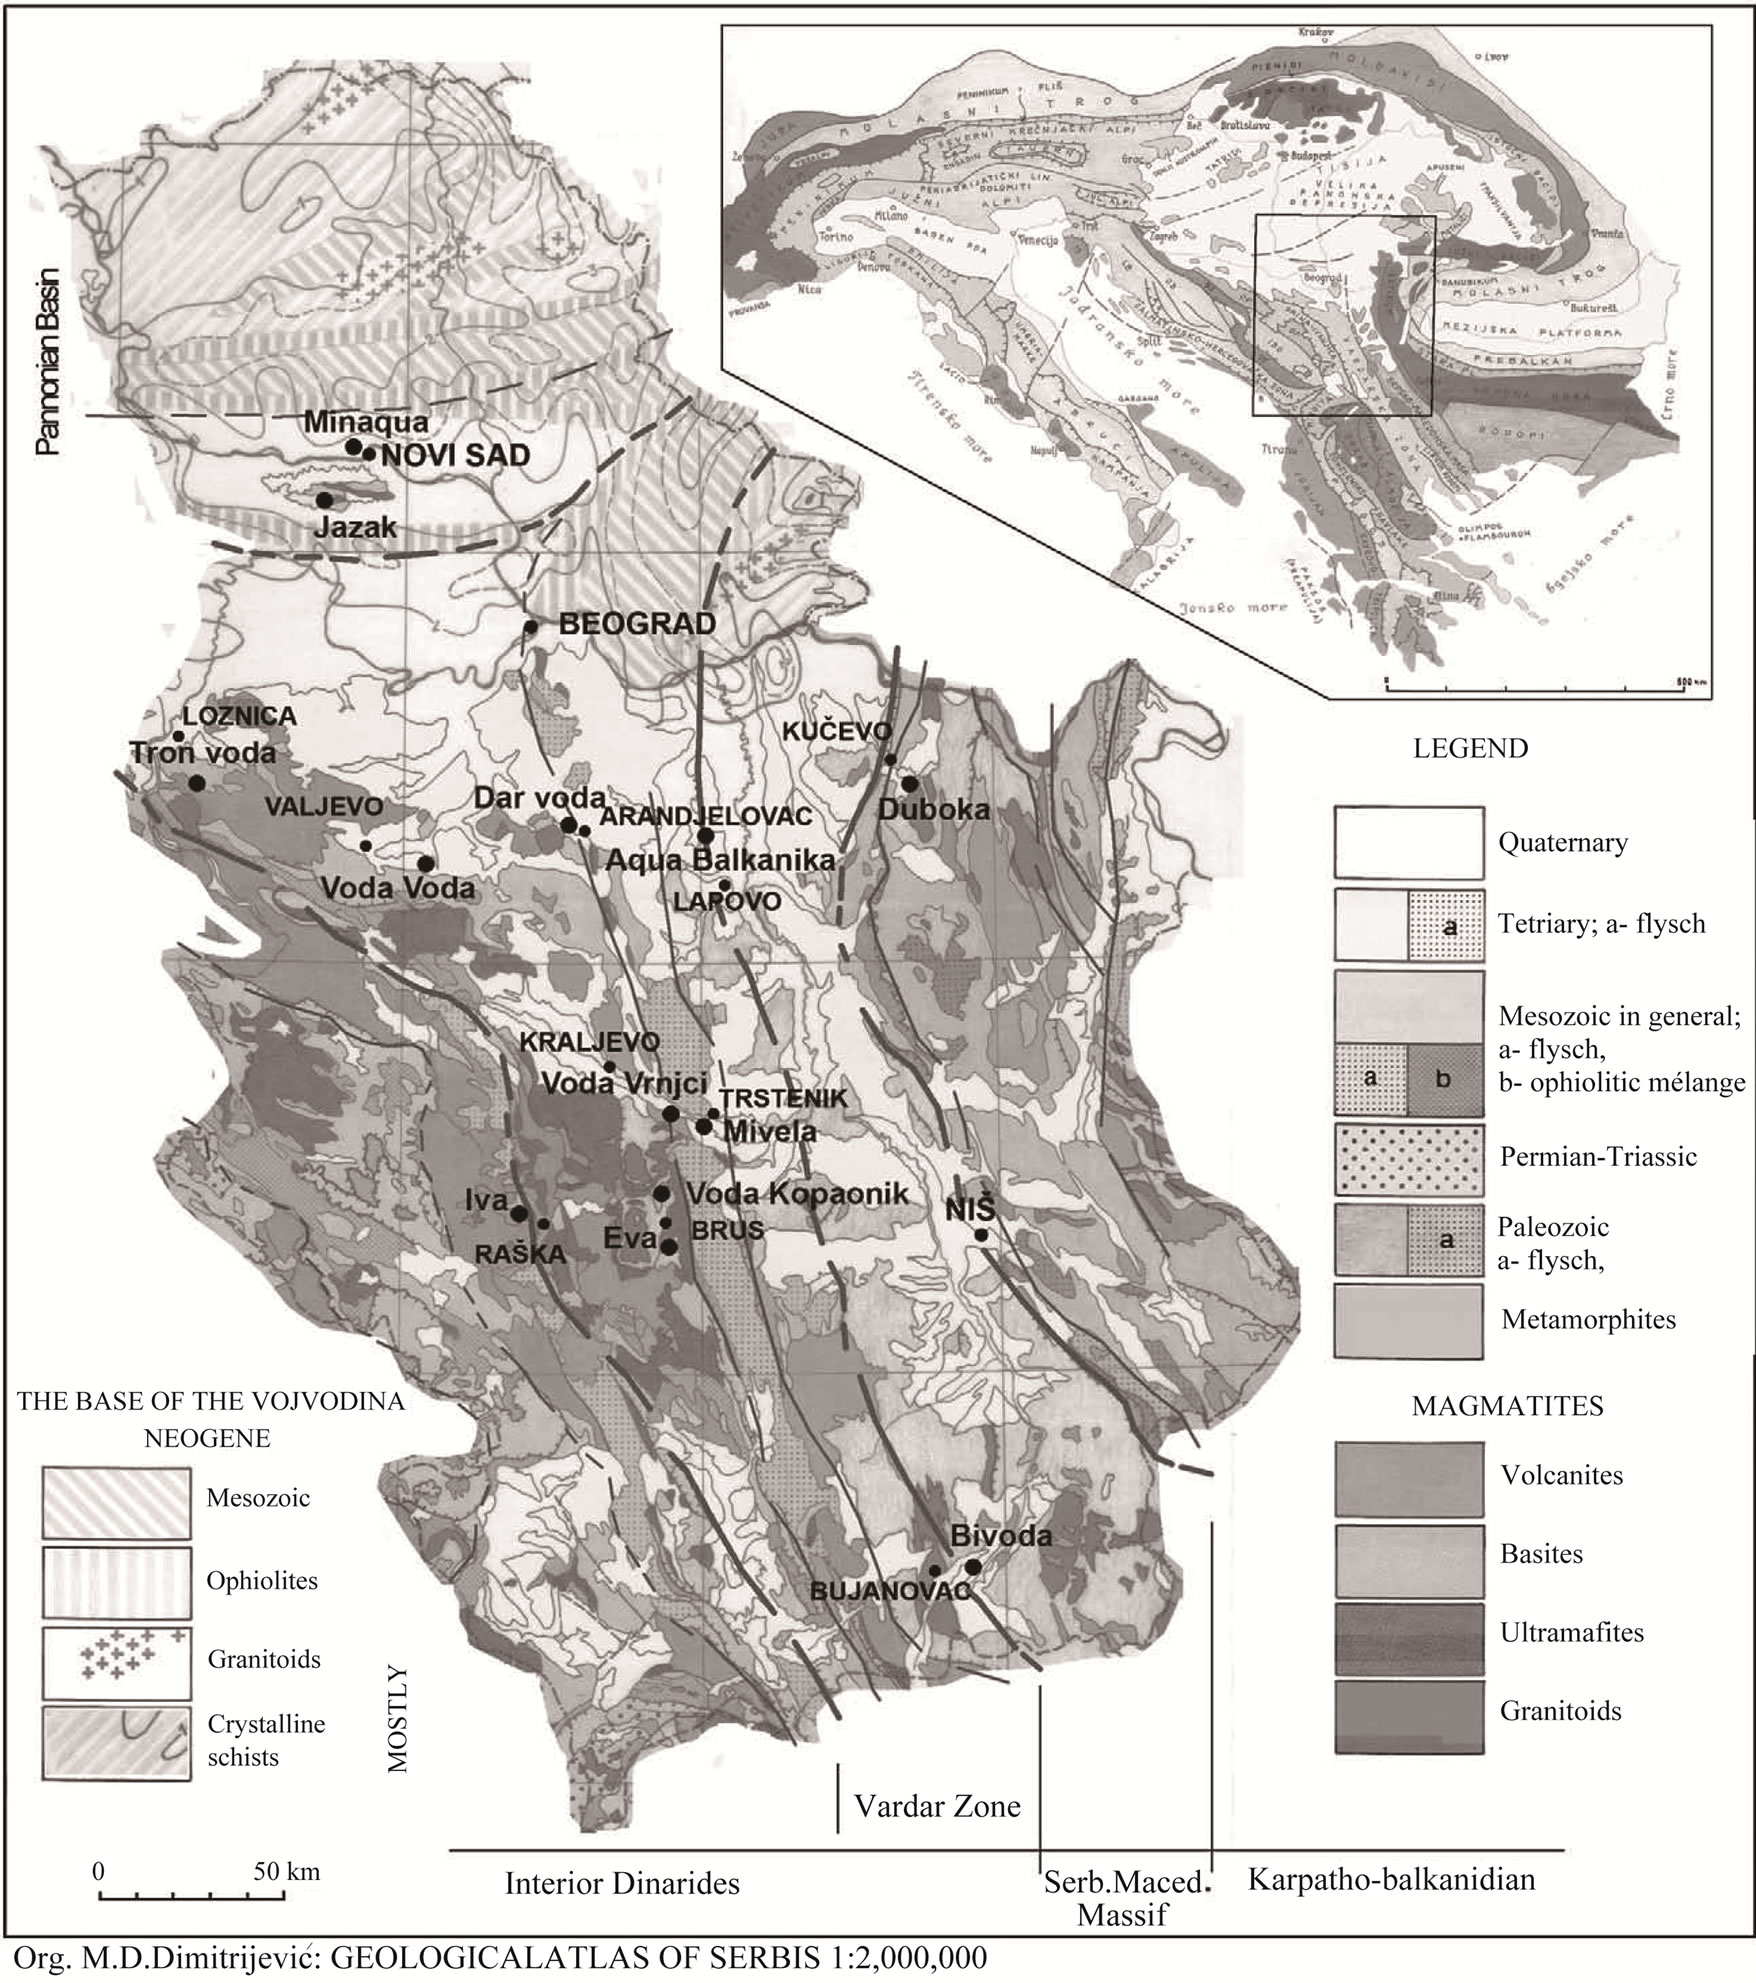
Figure 1. Geological map of Serbia [13].
Measurements of pH value of solution were done at ion-meter type C863 (Consort, Belgium) [5,7-10].
Conductivity measurements were done at WTW instrument for a terrain multi variant analysis. The instrument was calibrated by standard solutions for calibration (conductivities: 814 µS/cm and 1413 µS/cm) [11].
Determination of alkalinity and acidity of water by volumetric analysis. Water alkalinity was done by conventional volumetric method and potentiometric titration [7]. Before the titration of water samples, solutions of NaOH and HCl were standardised to 0.1 mol/L by primary standard of Na2CO3 of 0.05 mol/L concentration [12].
Determination of water hardness. Water hardness was determined in complexometric way, by titration with standard solution of EDTA of 0.01 mol/L concentration.
Determination of dry (solid) residue. Mineralisation (calculated as dry residue at 180˚C) represents total mass amount of all present matters in water. First, a glass (mass was previously determined) where samples will be vaporized, was measured at analytical scale. Vaporization of 100 mL of sample is done in water bath till dry. Then the rest in the glass is dried for 8 hours in a drying chamber at 180˚C. The glass is cooled and then measured.
Determination of dissolved ammonia [14]. To determine the soluble ammonium UV-VISIBLE SPECTROPHOTO METER SHIMADZU UV-1650 PC was used. The working wavelength was 425 nm.
Solutions received from standard solution of NH4Cl (T = 0.005 mg/mL) were used for making calibrating plot. The analytic curve is constructed according to measured absorption for said concentration, A = f (c).
The content of ammonia is determined by the equation:
x =  (1)
(1)
where x = content of ammonia (in mg/L); c = ammonia concentration according to the calibration curve (mg/L); V = volume of sample (mL).
Determination of fluoride and chloride ions by ion selective electrode (ISE). Concentration of fluoride and chloride ion in water was measured on ion meter type C863 (Consort, Belgium) and combined fluoride selective electrode (type ISE27B) and combined chloride selective electrode (type ISE24B) was used as a sensor electrodes [15].
For determination of fluoride ion 25.00 mL standard solution of 1000 mg/L concentration (or sample) was measured with pipette into separate flasks, 25.00 mL solution TISAB buffer (Total Ionic Strenght Adjustement Buffer) was added, the magnetic nucleus was inserted and the stirring speed was adjusted.
For determination of chloride ion 25.00 mL standard solution of 1000 mg/L concentration (or sample) was measured with pipette into separate flasks, 25.00 mL solution of KNO3 of 1 mol/L concentration was added, the magnetic nucleus was inserted and the stirring speed was adjusted.
Ionic chromatography. The instrument used in this analysis is Dionex DX-300. Safety and separation columns for separation of ions are made from same polymeric resin for anion change (IonPac AS14 i AG14-SC), and equipped with anion self regenerating suppressor model ASRS (Auto Self-Regenerating Suppressor) (4 mm) with expected noise conductivity from 5 - 15 mS. Mixture of 2 mmol/L of Na2CO3 and 0.5 mmol/L of NaHCO3 was used as mobile phase for separation of anions at this column. Mobile phase flow was 0.8 mol/L, time of the analysis was 15 minutes, and injected cubage was 20 μL.
Polymeric resins for kation exchange (with low capacity of ion exchange) were used for determination of kations. They are equipped with kation self regenerating suppressor model ASRS (Auto Self-Regenerating Suppressor) (4 mm), which separated kations transfer into adequate basis and reduce conductivity of eluent. Methyl sulphonic acid of 20 mmol/L concentration was used as mobile phase for separation of kations. Mobile phase flow was 0.5 mol/L, time of the analysis was 15 minutes, and injected cubage was 10 μL. Samples that had high conductibility, before the analysis by IC method were diluted, and pH value in all analysed waters was adjusted to 3.00 by adding 1 mol/L of HNO3.
Calibrating plot was made to determine precisely the concentration of anions/kations in the solution. It shows concentrations of standard solutions of anions/kations regarding their corresponding surfaces, and surfaces are calculated at chromatograph made according to their specific conductivities (in mS/cm). Samples and standards were filtrated through membrane syringefilter of 22 μm. Samples and standards were packed into autosampler after filtration.
Inductively coupled plasma atomic emission spectrosopy (ICP-AES). ICP-AES technique is based on the fact that excite atoms emit energy at certain wave-length in their way back into basic condition. Characteristic of each element is to emit energy of certain wave-length which is determined by chemical attributes of the element. Intensity of emitted energy at certain wave-length (characteristic for given element) corresponds to concentration of given element in the sample. As ICP-AES technique is used for determination of substances which are present in traces in a sample, before the analysis, all analysed mineral waters were diluted and acidified by adding the solution of 0.15 mol/L of HNO3.
Hydride technique. This technique is developed for determination of the elements which make highly vaporised hydrides (As, Hg, Sb, Bi, Se, Ge and Sn) and can be problem when they are directly put into ICP. Knowledge of concentration of these elements in human diet or in natural samples is important for their toxicity. Applying the hydride technique, multiple increasing of sensitivity of determination and separation of elements from complex matrix can be reached.
Gas hydride formed by chemical reaction is transported directly to plasma through gas carrier. The sample, acid and reduction reagents are continually pumped into gas-liquid separator (GLS) from where gas is directly transported into plasma. Levelling entry enables great stability of plasma. Analytic signal is measured continually. Samples are quickly washed and pulled out from GLS. Nowadays, NaBH4 is used as the most common reduction mean, although Sn (II) is used as reduction reagents for Hg.
These elements have to be in appropriate oxidation condition, so in some cases pre-reductions are necessary. As and Sb must be reduced from oxidation condition +5 to +3 to be correctly determined by the hydride technique, while Se must be reduced from oxidation condition +6 to +4. Most common reduction means (for pre-reduction) are ascorbic acid and potassium-iodide.
All measurements were done on instrument Spectro Ciros, according standard method DIN EN ISO 11885 (1998) [16].
Radioactivity. The quantitative content of uranium has been determined by the fluorometric method based on the linear dependence of the fluorescence intensity of uranium solutions on their concentration. The linear dependence occurs within a very large range of low concentrations (to the magnitude of four). The reduction in the fluorescence intensity has been brought to the lowest degree possible by the technique of ”standard addition” after the extraction of uranium by the synergetic mixture TOPO (three-n-octal phosphine oxide) ethyl acetate. The fluorescence intensity has been determined by means of the Fluorimeter 26-000 Jarrel Ash Division (Fisher Scientific Company, Waltham, 1978) [17-22].
Micro-biological analysis of water. Total amount of (aerobic mesophilic) bacteria in 1 mL of water was determined in the following way: 1 mL of analysed sample of water and then deep nutritious agar (P1), previously melted and cooled till approximately 50˚C, were put by sterile pipette into a Petri dish. Microorganisms in the basis were suspended by easy rotation of Petri dish at flat surface. Planted basis was incubated for 24 hours at 37˚C and then colonies were counted.
The result is expressed as cfu/mL (colony forming unit/mL) [9,23].
4. Results and Discussion
There are two Regulations in Serbia concerning the quality of water for human use. There are: Regulation on the Hygienic Acceptability of Potable Water (Official gazette of FRY, number 42/98 and 44/99), and Regulation on Quality and Other Requirements for Natural Mineral Water, Spring Water and Bottled Drinking Water (Official Gazette of Serbia and Montenegro, number 53/05).
Comparison of Regulations and Standards in Serbia with EU Directive and World Health organization (WHO, 2006) is shown in the Table 3.
The Regulation on the Hygienic Acceptability of Potable Water defines the maximum acceptable concentrations (MAC) of chemical substances in water for public water supply, and beside that it particularly gives MAC for certain minerals in bottled water (Al, Ba, Ca, Cl–, CN–, Cu, F–, Fe, Hg, Mg, Mn, Na, Ni, NO2,  ,
,  , Zn and electro conductivity less than 500 μS/cm). Except for As, B and U, all of the MAC in this Regulations are lower than the one given by the World Health Organization (WHO).
Regulation on Quality and Other Requirements for Natural Mineral Water, Spring Water and Bottled Drinking Water defines the MAC of certain chemical parameters that can be a risk to human health, indicators of water quality and nomenclature of mineral waters. If the concentration than the one given in Table 3 (value **), then this must be highlighted in the water name (on bottle label). Example: ”bicarbonate water” if  > 600 mg/L or ”Mg water” if Mg > 50 etc.
MAC for F– (1.5 mg/L), Cl– (250 mg/L), CN– (70 μg/L) and  (250 mg/L) must not exceeded, while for water rich in CO2, pH value can be less than 6.80. This Regulation applies to all ground water, regardless of the overall mineralization. The term ”spring water” was used meaning “captured water on the location”. The Regulation is harmonized with WHO standards, except in cas of B content, for which two times higher maximum concentration is allowed.
The total of 28 parameters were examined for each sample, and some of the results are given in Table 4.
4.1. Determination Basic Physical-Chemical Parameters
According to the results shown in Table 4, it can be concluded that water temperature from springs is in expected limits, as they are ground water. Slightly higher temperature is at springs Talpara and Ješovac, because these springs are connected to communal system of exploitation. Water temperature at spring-water Svinčine is also higher than at other spring-waters, because there is accumulation under the spring-water, so this water is in direct contact with the environment. The highest temperature is at spring-water Exploitation, because it is a spring of thermal mineral water.
Value of pH in analysed waters shows that waters from Maiden spring, Ješovac, Vrelo and Svinčine springs are slightly acid, while mineral waters from Aleksijević, Exploitation and Talpara springs are slightly basic. According to Regulation on the hygiene of drinking water (Official Gazette of FRY, number 42/98 and 44/99), only water from Olga’s spring-water doesn’t satisfy the condition that pH value must be between 6.50 and 8.50.
Bottled water Knjaz Miloš (pH value 5.57) has lower pH value, but it is carbonated water and has increased amount of CO2, so this low pH value is expected. Received pH values of analysed waters show that lower pH value corresponds to lower content of hydrogen carbonate with the exception of Olga’s spring, indicating the presence of other substances with basic attributes.
Concentration of oxygen in water depends on its solubility from air, which depends on the temperature of analysed waters, concentration of dissolved salts, depth of the spring and atmospheric pressure. In analysed samples, concentration of oxygen is expectedly low, as they are ground spring-waters. All samples are according to demands from Regulation on the hygiene of drinking water, as the concentration of dissolved oxygen is far below the maximum allowed value which is 8.24 mg/L. Water at spring Svinčine has the highest content of dissolved
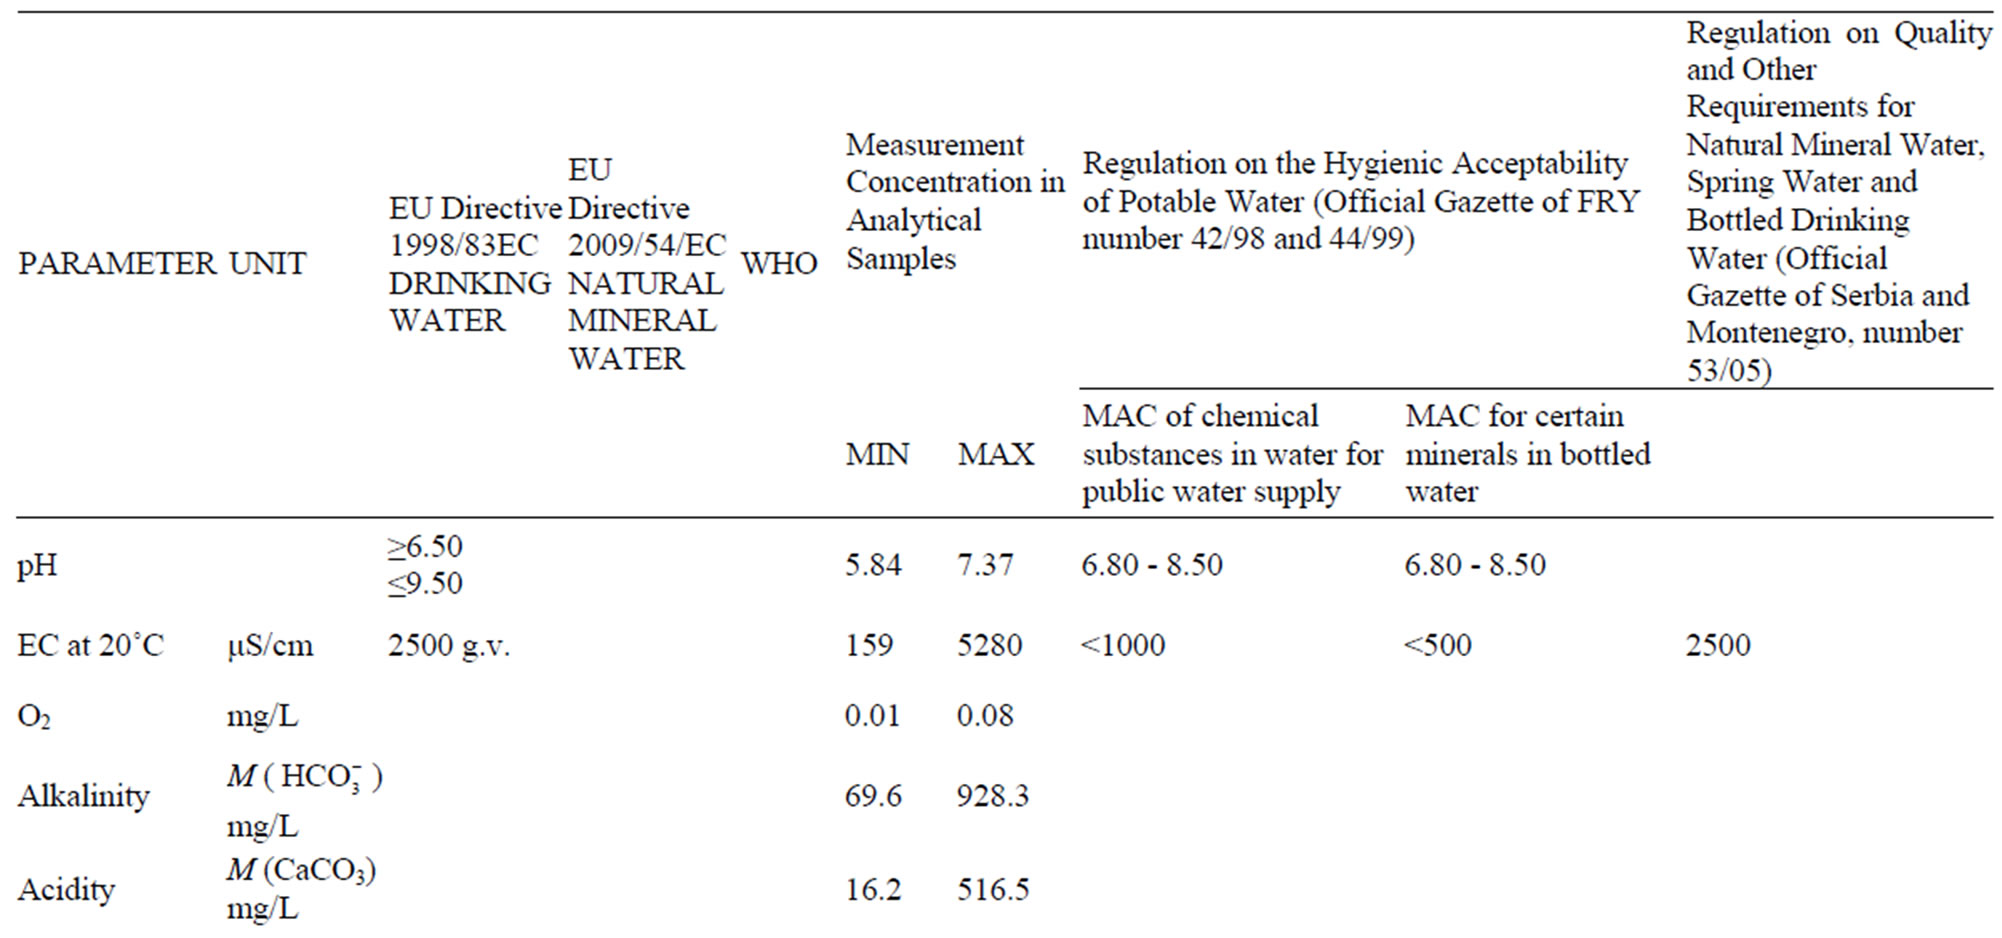
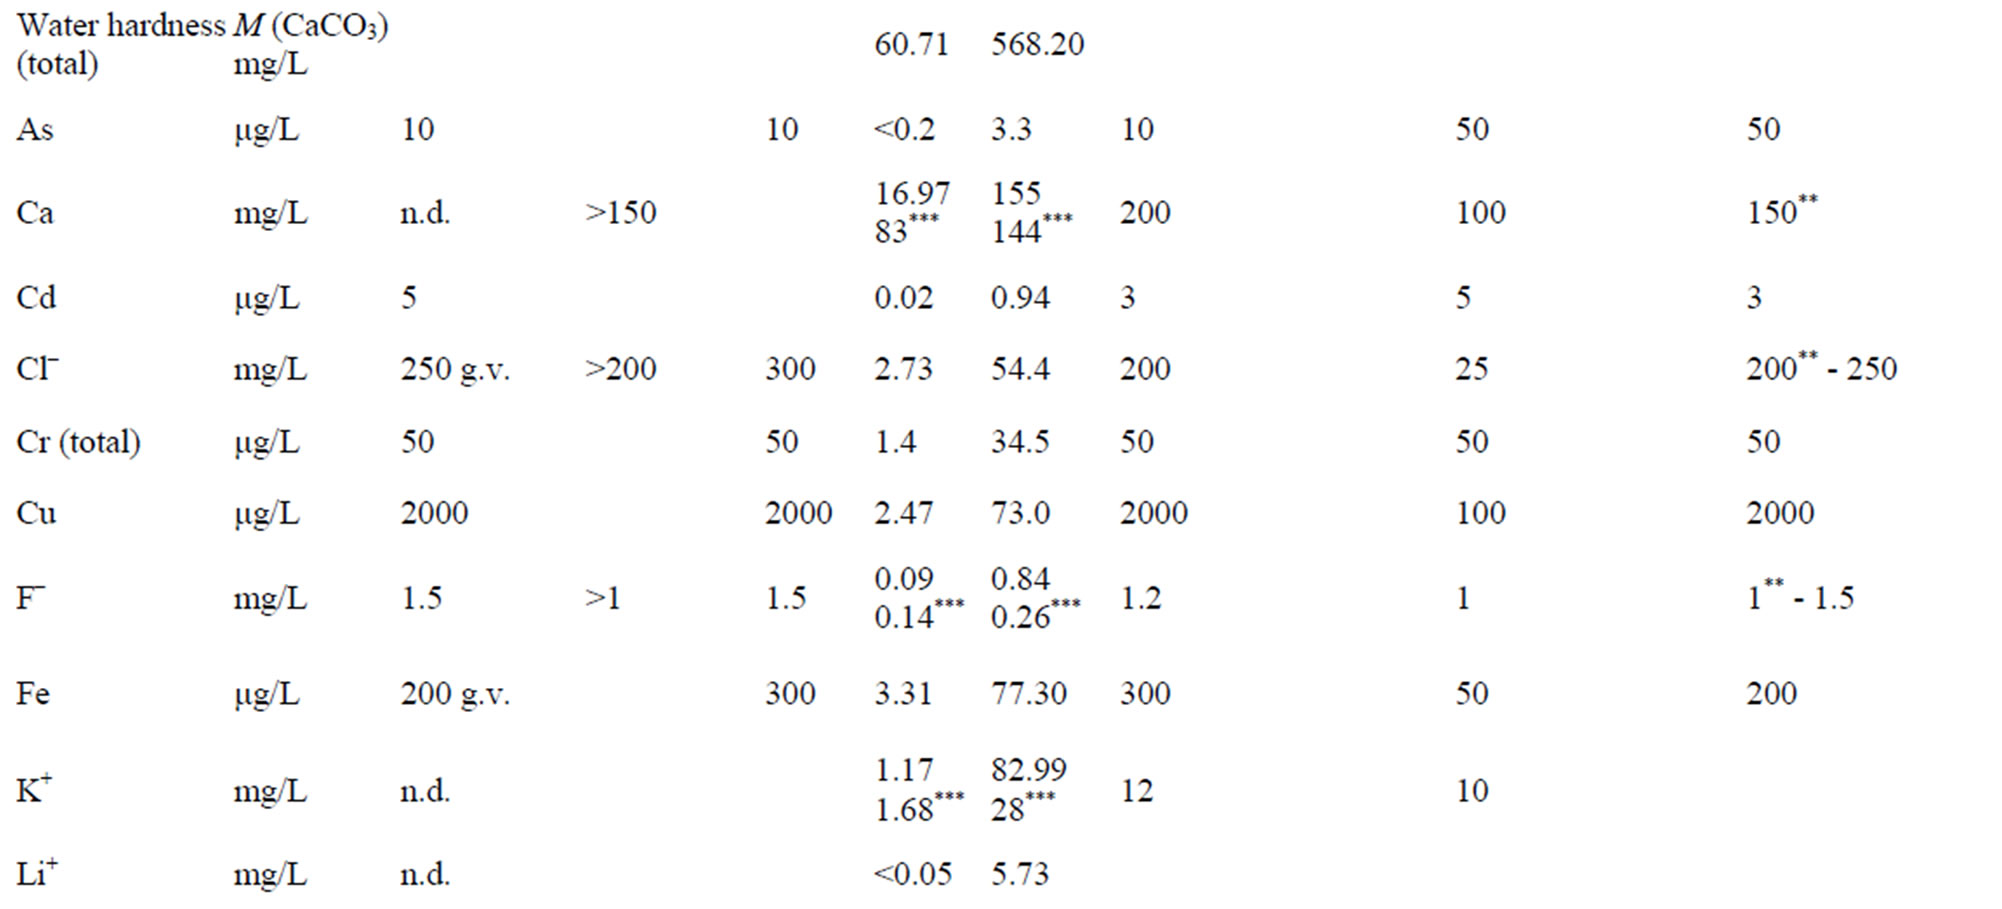
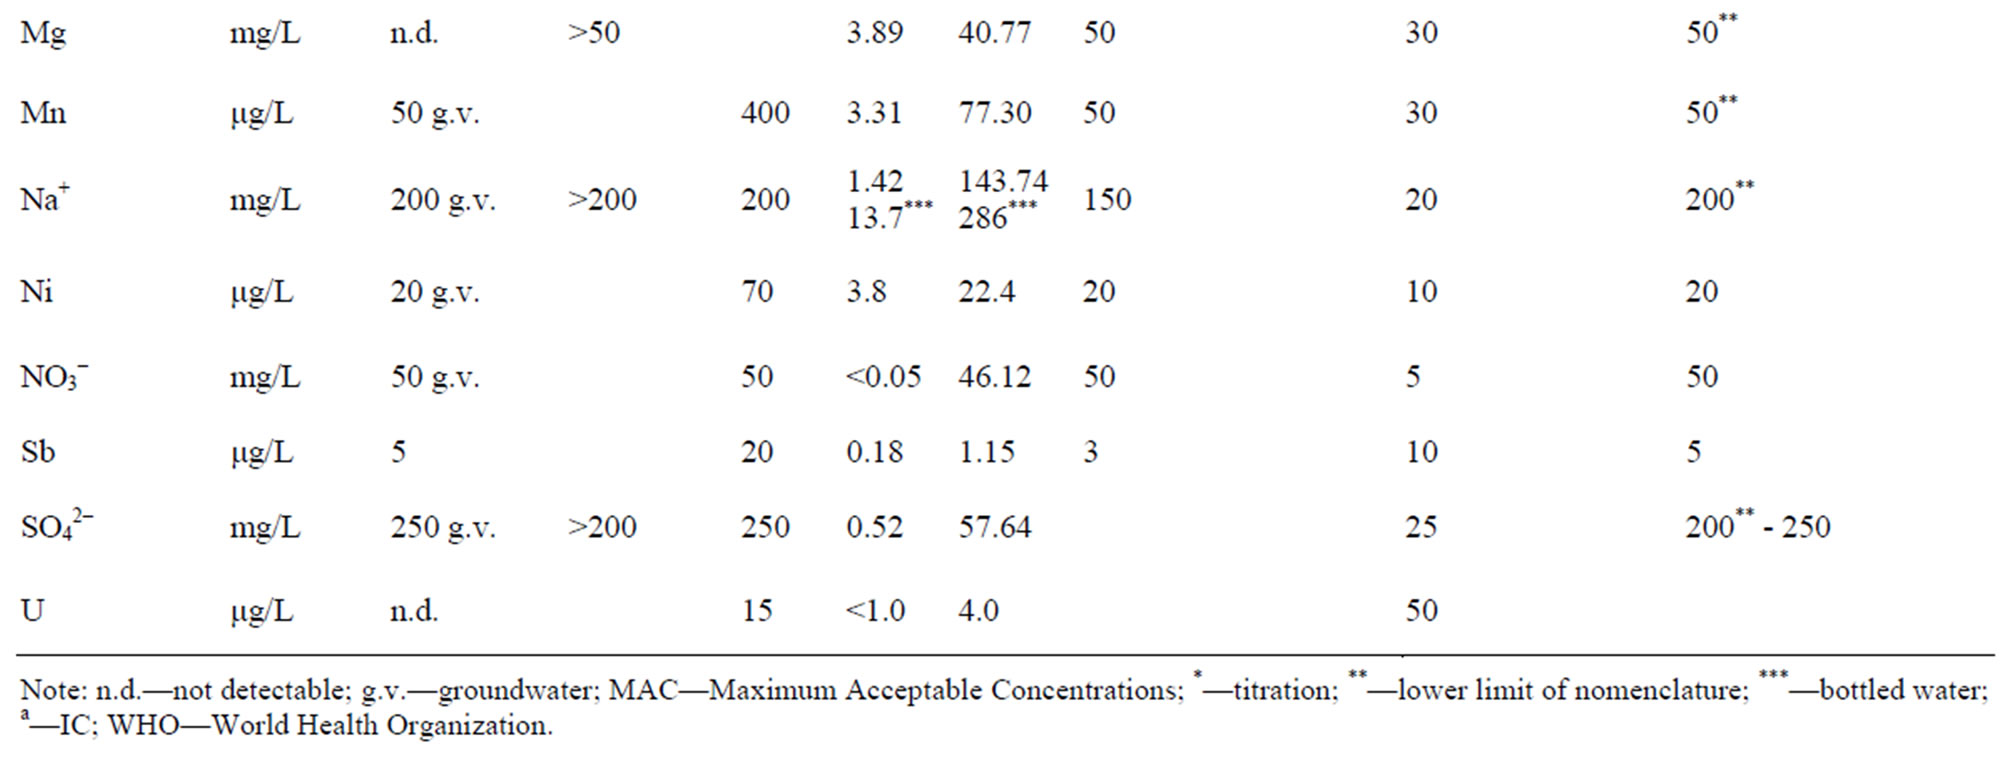
Table 3. Comparison of regulations and standards in serbia with the EU directive and WHO [30].
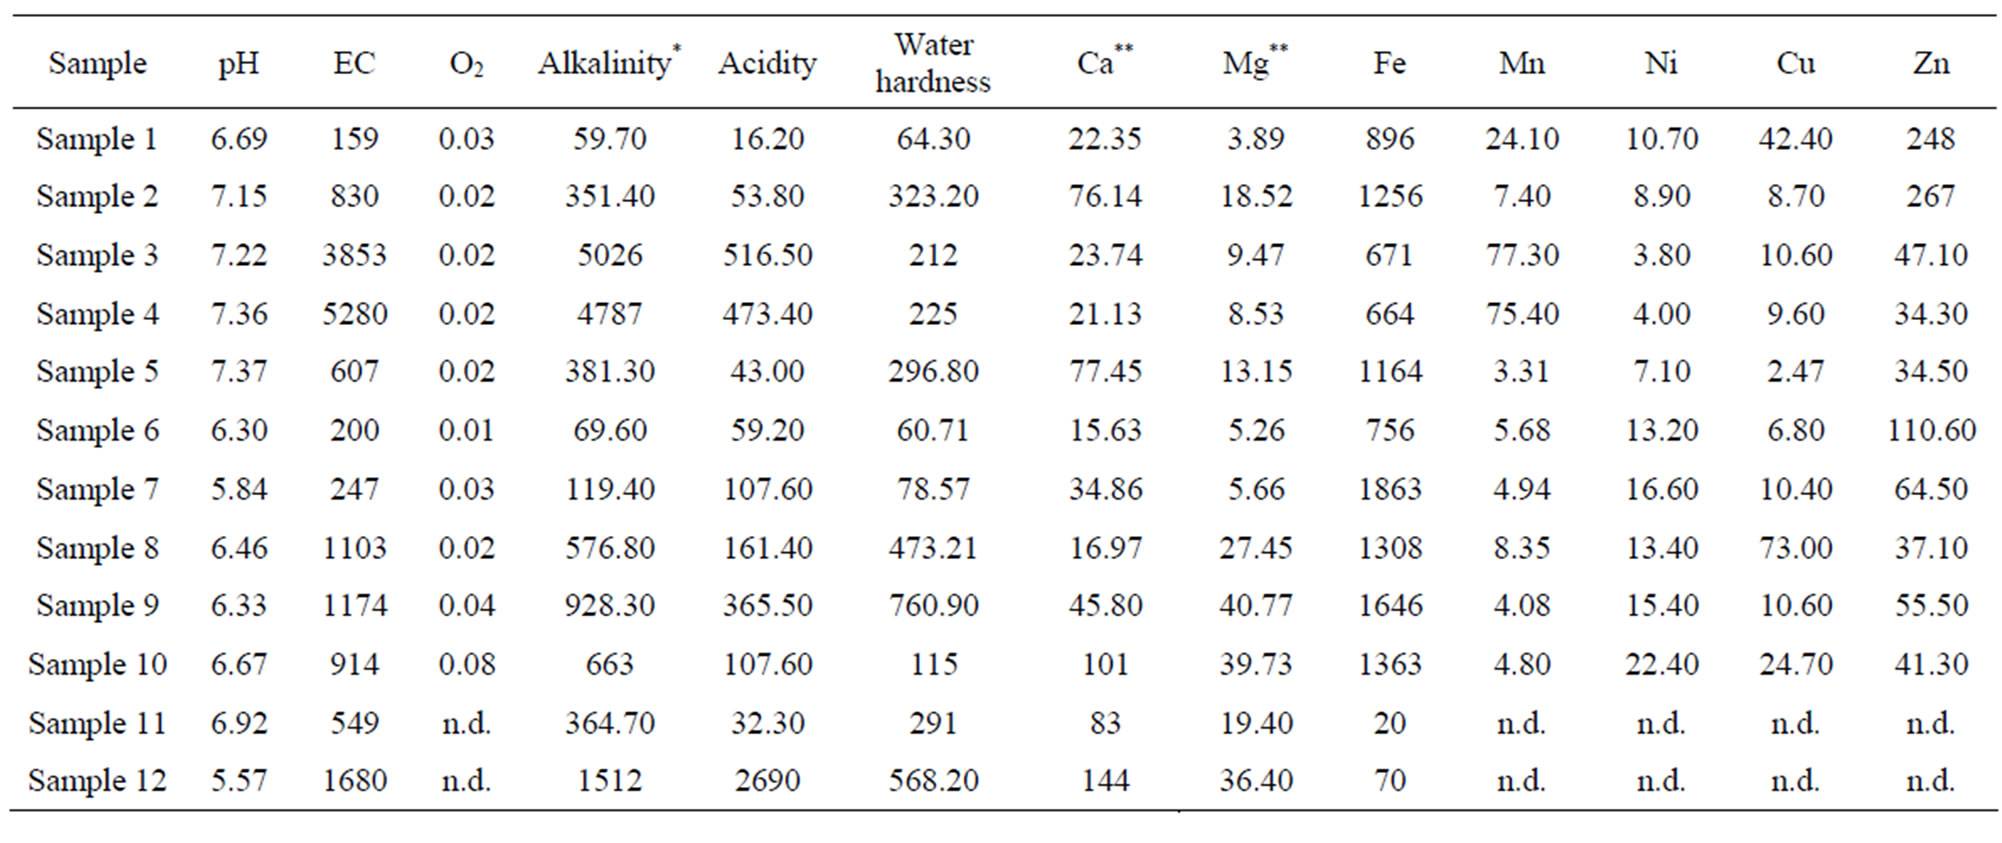

Table 4. Results of analysed samples.
oxygen. This spring-water is placed in rural part of Banja village, with low accumulation, which is in immediate contact with tended land. Thus increased content of oxygen can be the after effect of decay of organic matter [24].
Results of conductivity measurements at the sample taking temperature and at 20˚C are shown in Table 4. As thermostat adjustment of the instrument for conductivity measurement wasn’t done, temperature of water sample was measured and with approximate correction factor, f, which for water, in temperature range from10 to 25˚C, is 0.02˚C−1, it was calculated to temperature of 20˚C by the equation:
 20 =
20 =  t
t  (2)
(2)
According to Regulation on the hygiene of drinking water [25] conductivity should be less than 1000 µS/cm. This condition fulfil waters from springs Aleksijević, Talpara (ordinary), Maiden and Olga’s spring-water, Svinčine and water supply system. Springs Ješovac and Vrelo have slightly increased conductivity, while springs Exploitation and Talpara (mineral) have values of conductivity significantly above allowed. According to values of conductivity for temperatures of samples taking, water from Exploitation has higher conductivity, which is expected value, as with increasing of temperature rises its conductivity. However, when these values are calculated to the same temperature (at 20˚C), it can be seen that conductivity is 1.4 times higher at spring Talpara (mineral) than conductivity of water from Exploitation spring.
Factory Knjaz Miloš, Arandjelovac, where Aqua Viva and Knjaz Miloš have been bottled is placed in the bottom of Banja village and it is supposed that water which has been processed in the factory and waters from springs Vrelo and Svinčine belong to the same artery. When the values of conductivity and pH values are compared, it can be seen that there are some conductivity deviation and approximately the same pH values.
4.2. Determination of Total Content of Mineral (as Dry Residue)
Results of determination of total amount of minerals (calculated as dry residue at 180˚C) are shown in Figure 2.
According to the total mineral amount (in mg/L) waters City, Aleksijević well, Talpara (ordinary), Maiden spring, Olga’s spring and Svičine, as well as Aqua Viva bottled water belong to the category of low mineral waters (<500). Waters from springs Ješovac and Vrelo, as well as water Knjaz Miloš belong to natural mineral waters (500 - 1500), while waters from springs Exploitation and Talpara (mineral) belong to natural mineral waters rich with mineral salts (>1500) [26].
4.3. Determination of Alkalinity and Acidity
Acidity of natural waters comes from carbonic acid, and sometimes from humic acids. Most of natural waters are alkali, although they can contain free carbonic acid. So, natural waters can contain both acidity and alkalinity, where acidity can only come from carbonic acid.
Hydroxides, carbonates and hydrogen carbonates of alkali and earth alkaline metals, mainly Na, Ca and
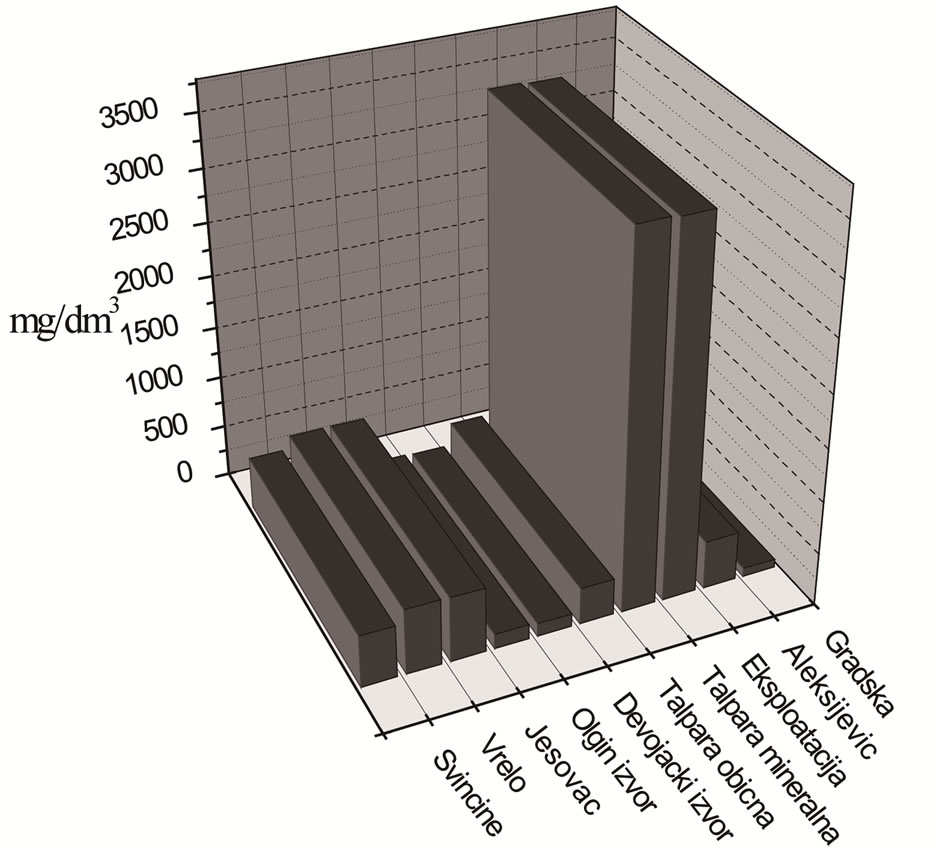
Figure 2. Total content of mineral (as dry residue) in analysed waters.
Mg make water alkalinity. Water alkalinity was determined by the classical volumetric method and the method of potentiometric titration. The results obtained by potentiometric titrations were processed with software Origin 6.1 for math data processing According to the results of alkalinity and acidity determination, it can be seen that all analysed samples contain only hydrogencarbonates, that is, they show only m alkalinity. Results of alkalinity determination by classical volumetric method and by potentiometric titration method are corresponding. Variations are slightly higher with the samples with high alkalinity, as with samples from springs Exploitation and Talpara (mineral).
Acidity towards methyl orange shows the presence of mineral acids, and acidity towards methyl orange at all analysed samples was equal to zero. As there is present only acidity towards phenolphtalein, it can be concluded that acidity of analysed waters comes from dissolved CO2. The highest acidity has the sample of bottled water Knjaz Miloš, where the content of CO2 is higher, as it is carbonated water.
4.4. Determination of Water Hardness
The results of determination of total and carbonate water hardness show that samples from City supply system, Aleksijević well and Maiden spring has total hardness of water higher than carbonate one. That means that these waters contain only hydrogencarbonate of calcium and magnesium. Small differences in total and carbonate hardness of these samples show that sulphates and chlorides of calcium and magnesium in these samples are present in small concentration. The smallest hardness has the sample from spring at mountain Bukulja, which can be the consequence of low layer of underground accumulation of these waters. In its way towards the spring, water from these springs has relatively small contact with minerals of calcium and magnesium, and at the same time low amount of CO2, so there is no reaction of making hydrogencarbonates.
As the result of reaction of hydrogencarbonate making it comes to the increasing of amount of Ca2+ and  ions in water, that corresponds to alkalinity determination, as alkalinity in these natural waters is the smallest. Here the City supply system should be excluded because it is previously treated and is used for water supply of Arandjelovac.
Samples of other analysed mineral water have carbonate hardness higher than total hardness, and same trend is present with bottled waters. That means that in water besides carbonates and hydrogencarbonate of earth alkaline metals there are higher and bigger amounts of carbonates and hydrogencarbonates of alkaline metals.
The highest hardness, meaning the highest amount of dissolved salts of calcium and magnesium, as well as hydrogencarbonates, have samples Exploitation and Talpara (mineral) and these results correspond to conductivity determination (Table 4).
According to the received results of water hardness analysis (in mg CaCO3/L) it can be concluded that City supply system water and water from Maiden spring and Olga’s spring belong to the category of soft waters (<200). Water from Aleksijević well, Talpara (ordinary) as well as bottled water Aqua Viva belong to the category of medium hard waters (200 - 400). Water from spring Ješovac belong to the category of hard waters (400 - 600), while waters from springs Exploitation, Talpara (mineral), Ješovac, Vrelo as well as bottled water Knjaz Miloš belong to the category of very hard waters (>600).
4.5. Determination of Cations
Results of determination of Ca and Mg by the method of ionic chromatografy (Figure 3); heavy metals by ICPAES method; uranium by the fluorimetric method and Li+, K+ and Mg2+ ions by ionic chromatography are shown in Table 4.
Comparative analysis of the results of the analysis of calcium and magnesium amount by the classical titrimetric method and the method of ionic chromatografy, shows the significant deviation from results received from the usage of the methods mentioned above. The reason is high content of iron-ions during volumetric determination of Ca2+ and Mg2+ ions which, together with Cd2+, Cu2+, Zn2+ and Pb2+ ions, interfere into complexometric titration of Ca and Mg. Disturbances coming from these ions should be removed before the titration of samples by adding solution of hydroxylamine-hydrochloride. The smallest deviation was noticed during determination of Ca and Mg in mineral water from Maiden spring, where there was the smallest amount of Fe, as the argument to this clam.
The ratio of Ca and Mg in organism is approximately 3:1, so their entry through water should be approximately 3:1. Said ratio is present in mineral water from Maiden spring (2.97) while in other waters it goes from 0.62 to 6.15. Named concentration of elements can be changed
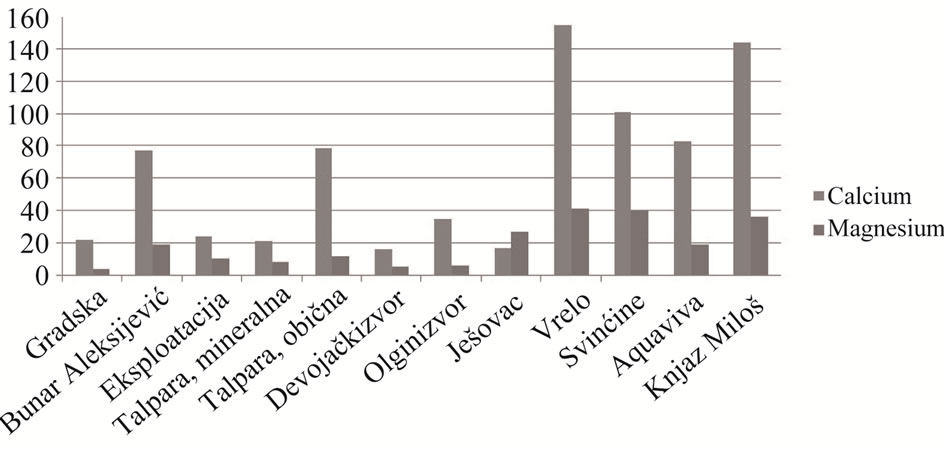
Figure 3. Graphical display of ratio of Ca and Mg amounts in analysed mineral water.
indicating that mineral water has no constant composition.
Amount of Fe in analysed waters goes from 664 to 1863 μg/L, which is above MAC values (300 μg/L). Although Maiden and Olga’s springs are placed at mountain Bukulja, the amount of Fe in water from Olga’s spring is double higher (1863 and 756 μg/L, respectively), indicating that mineral waters from these springs have contacts with different mineral matters [25].
Concentration of Fe and Mn in mineral waters from Exploitation and Talpare (mineral) are almost equal (671 and 77.30 i.e. 664 and 75.4 μg/L, respectively). When other parameters are compared (conductivity, water hardness, dry residue) it can be seen that mineral waters from these two springs are of approximately same content. The analysis of results of heavy metals determination (Table 4) shows that the content of analysed metals is below MAC values. In mineral water from spring Svinčine, the amount of Cr (34.5 μg/L) is slightly higher, while Ni is present in concentration (22.4 μg/L) which is above the maximum allowed concentration (20 μg/L).
The results of ion determination of alkali metals in analysed mineral waters (Table 4) show that the highest concentration of Na+ ions is present in mineral waters from Exploitation and Talpare (mineral), but it is below the maximum allowed amount. The amount of K is also the highest in samples from Exploitation and Talpare (mineral) and is 6.5 times higher than the maximum allowed concentration (82.99 and 82.14, respectively in comparison to 12 mg/L that is MAC value). Slightly above MAC is the content of K in sample from spring Svinčine (14.65 mg/L), while in other analysed waters the content of K, and also Na is below MAC values (Figure 4).
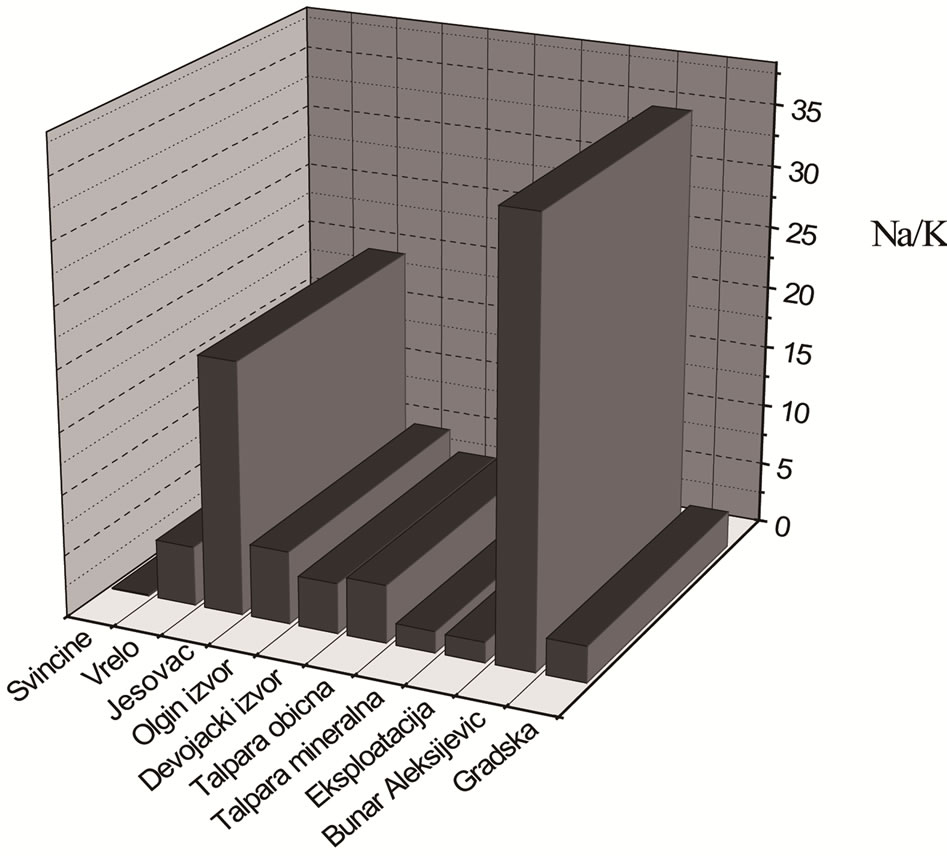
Figure 4. Graphical display of ratio of Na and K amounts in analysed mineral water.
For regular functioning of sodium-potassium pump in cells of human organism it is necessary that ratio of Na and K is 3:2, that is, 1.5 times higher amount of Na than K. If it is supposed that daily entry of these elements through human diet is constant and equal to 1.5, then it would be optimal that entry through water be the same in order not to disturb the balance in organism. For normal functioning of organism it is desirable to drink water with less than 150 and in some cases less than 50 mg/L of Na and with less than 12 mg/L of K.
4.6. Determination of Fluoride and Chloride Ions
The measured values of potential in analysed samples of mineral waters with appropriate ion-selective electrode are located in curved part of calibration plot. This is the reason why amount of fluoride and chloride ion is determined by the method of standard addition [8,27].
First, the potential of analysed sample of known cubage was measured (Vt). If Nernst equation is used it can be written that:
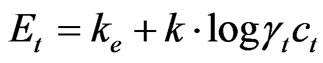 (3)
(3)
where k stands for line inclination which represents dependence of E from log c, γt and ct stand for coefficient of activity, that is, concentration of fluoride-ion in analysed solution. Known cubage V2 of standard solution of concentration cs, of F– or Cl− ion, was added into the analysed solution and potential E2 was measured. Concentration of cs was chosen to be 50 - 100 times higher than concentration of ct. For potential E2 is:
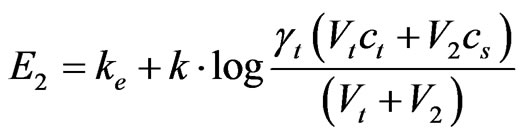 (4)
(4)
where Vt is the volume of analyzed solution.
Making the similar ion volume of both solutions, coefficient of activity in both solutions will be the same, so the difference of the potentials can be expressed as:
 (5)
(5)
It follows that
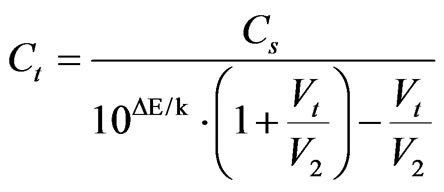 (6)
(6)
So, according to inclination of calibration plot known, concentration of F– and Cl– ions were calculated [28], and results are shown in Table 4, where the results of F– and Cl– ions determination by the method of ionic chromatography are also shown.
The analysis of fluoride amount by the method of ionic chromatography in all samples was below the level of detection (0.05 mg/L). The results of measurements by ion-selective electrode show that amount of fluoride is below MAC values in all analysed mineral waters. Namely, the level of detection of fluoride-selective electrode is lower than by the method of IC and is 0.01 mg/L, indicating that ISE method is more sensitive to fluoride determination.
On the other hand, high concentration of Fe means that in analysed samples can come to building of dissolved complexes of iron and F– ions. These complex compounds are less stable from complexes which iron builds with citrate-ion from TISAB solution. By adding the TISAB solution, F– ion frees from the complex which it makes with iron ion and goes into solution. That enables more sensitive and more precise measurements of fluoride ion-selective electrode, in comparison to IC method.
From the analysis of results shown in Table 4, it can be seen that the content of fluoride and chloride too, nitrate and sulphate is nearly same in samples Exploitation and Talpara (mineral).
The analysis of chloride by IC method and ion-selective electrode shows considerate differences in results received by these methods. Approximate values of chloride amount have been found only in samples from Aleksijević well and from spring Ješovac. Obstructions during the work with chloride-selective electrode can come from interfering effect of I–, Br–, OH–, CN–,  ,
,  and
and  ions [7,29]. On the other hand, level of detection of chloride determination by ion-selective electrode is 2 mg/L, and by IC method is 0.01 mg/L.
The amount of nitrite, phosphate and bromide ion was also analysed in mineral waters. Concentration of these ions in all samples was below the level of detection.
4.7. Determination of Ammonia Content and Micro-Biological Analysis
The analysed results of determination of ammonia amounts and the microbiological analysis show that the amount of ammonia is above MAC values in samples Exploitation and Talpara (mineral). Comparing pH values and content of ammonia, it can be seen that in natural mineral waters lower value of pH (a more acid sample) correspond to lower level of ammonia. So the lowest amount of ammonia is in sample from Maiden spring, which also has the lowest pH value. Here we didn’t consider City supply system water because it is chemically and microbiologically treated, and according to Regulation on the hygiene of drinking water.
Drinking water from public springs of closed type can be classified into several categories [25]: refined water (it cannot have coliform bacteria in 100 mL, and total amount of living bacteria is ≤10 in 1 mL of water), natural water (the content of coliform bacteria ≤10 in 100 mL, and total amount of living bacteria is ≤100 in 1 mL of water).
Drinking water from opened wells and other public springs which are used for drinking can contain up to 300 of total bacteria in 1 mL. As for total number of bacteria in mineral waters from springs Talpara (ordinary) and Ješovac, they have slightly higher amount of bacteria comparing to other analysed waters. However, these two springs belong to the category of public springs, meaning that microbiologic quality of waters from these springs is according to the Regulation.
5. Conclusions
The pH value in analysed waters shows that waters from springs Maiden spring, Ješovac, Vrelo and Svinčine are slightly acid, while mineral waters from springs Aleksijević, Exploitation and Talpara are slightly basic.
In analysed waters concentration of oxygen is expectedly low but all samples are according to Regulation on the hygiene of drinking water (MAC values 8.24 mg/L).
Conductivity is satisfied with waters from springs Aleksijević, Talpara (ordinary), Maiden and Olga’s spring, Svinčine and water from supply system. Springs Ješovac and Vrelo have slightly increased conductivity, and Exploitation and Talpara (mineral) have significantly higher conductivity values than MAC.
Waters City, Aleksijević well, Talpara (ordinary), Maiden spring, Olga’s spring and Svičine, as well as bottled water Aqua Viva belong to the category of natural low mineral waters. Samples from springs Ješovac and Vrelo, as well as water Knjaz Miloš belong to the category of natural mineral waters. Samples from springs Exploitation and Talpara belong to natural mineral waters rich with mineral salts (mineral).
Determination of water hardness shows that City water and water from Maiden and Olga’s springs belong to the category of soft waters; water from Aleksijević well, Talpara (ordinary) as well as bottled water Aqua Viva belong to the category of medium hard waters; water from springs Ješovac belong to the category of hard waters, while waters from springs Exploitation, Talpara (mineral), Ješovac, Vrelo as well as bottled water Knjaz Miloš belong to the category of very hard waters.
The analysis of Ca and Mg amount shows that analysed mineral waters contain Ca and Mg in concentrations below MAC values.
The amount of Fe in analysed mineral waters is increased and higher than MAC values.
The analysis of the results of heavy metals determination shows that the amount of analysed metals is below MAC values. In mineral water from spring Svinčine, there is slightly increased amount of Cr, while Ni is present in concentration above MAC values.
The highest concentration of Na+ ions is present in mineral waters from Exploitation and Talpare (mineral), but it is below MAC values. Amount of K is also the highest in samples from Exploitation and Talpare (mineral) and they are 6.5 times higher than MAC values. Slightly above MAC is the amount of K in sample from spring Svinčine, while in other analysed waters amount of K and Na is below MAC values.
Amount of fluoride, chloride, nitrate and sulphate in analysed mineral waters is below MAC values.
Amount of ammonia above MDK values was in samples Exploitation and Talpara (mineral). Comparing pH values and ammonia amount, it can be seen that in natural mineral waters lower pH value (a more acid sample) correspond to lower ammonia amount. The lowest ammonia amount is in the sample from Maiden spring, and it also has the lowest pH value.
The results of analysis show that concentration of uranium is in natural values range.
6. Acknowledgements
We gratefully acknowledge the financial support from the Ministry of Science, Technology and Development, the Republic of Serbia (grant number III 43009) for the research work.
REFERENCES
- D. K. Todd, “The Water Encyclopedia,” Water Information Center, New York, 1970.
- L. Gavrilović and M. Lješević, “Voda kao Uslov Života i Prirodni Resurs,” Zbornik radova sa Konferencije VODA ZA 21 VEK, Udruženje za tehnologiju vode i sanitarno inženjerstvo, Beograd, 1999 (in Serbian).
- http:// www.mineralwater.org
- B. Dalmacija, “Kontrola Kvaliteta voda u Okviru Upravljanja Kvalitetom,” Prirodno-Matematički Fakultet, Novi Sad, 2000 (in Serbian).
- Anonym, “Vogel’s Textbook of Quantitative Chemical Analysis,” 5th Edition on CD-ROM, John Wiley & Sons, Inc., New York, 1989.
- Environmental Protection Agency (EPA), “Analytical Methods Approved for Drinking Water Compliance Monitoring og Inorganic Constituents National Primary Drinking Water Regulations,” CFR 141.23 and Appendix A to Subpart C of Part 141, USA, 2009.
- M. B. Rajković and I. D. Sredović, “Praktikum iz Analitičke Hemije,” Poljoprivredni Fakultet, Zemun, 2009 (in Serbian).
- D. C. Harris, “Quantitative Chemical Analysis,” 6th Edition, W. H. Freeman and Company, New York, 2003.
- A. D. Eaton, L. S. Clesceri and A. E. Greenberg, “Standard Methods for Examination of Water and Waste Water,” 19th Edition, American Public Healt Association, Washington, 1995.
- Anonym, “Standard Methods 4500-B+B: Standard Methods for the Examination of Water and Wastewater,” 21st Edition, 2005. http://www.standardmethods.org
- Anonym, “Standard Methods 2510 B: Standard Methods for the Examination of Water and Wastewater,” 21st Edition, 2005. http://www.standardmethods.org.
- Anonym, “Standard Methods 2320 B: Standard Methods for the Examination of Water and Wastewater,” 21st Edition, 2005. http://www.standardmethods.org.
- M. Dimitrijević, “Geological Map 1:2000000. Geological Atlas of Serbia, No. 1,” 1994 (in Serbian).
- Anonym, “Određivanje Sadržaja Amonijaka. Metoda Pomoću Nessler-Ovog Reagensa,” SRPS 7150-1, 1990 (in Serbian).
- Anonym, “Standard Methods 4500-F-E: Standard Methods for the Examination of Water and Wastewater,” 21st Edition, 2005. http://www.standardmethods.org
- M. Birke, C. Reimann, A. Demetriades, U. Rauch, H. Lorenz, B. Harazim and W. Glatte, “Determination of Major and Trace Elements in European Bottled Mineral Water—Analytical Methods,” Journal of Geochemical Exploration, Vol. 107, 2010, pp. 217-226. doi:10.1016/j.gexplo.2010.05.005
- M. Stojanović and Z. Martinović, “Pregled Analitičkih Metoda za Određivanje Urana. Uticaj Upotrebe Fosfornih Đubriva na Kontaminaciju Uranom,” Zbornik radova sa naučnog skupa, SANU, Beograd, Knjiga 5, 1993, pp. 19-29 (in Serbian).
- M. Stojanović and M. B. Rajković, “Određivanje i Karakterizacija Urana u vodi za piće,” XXII Simpozijum Jugoslovenskog Društva za Zaštitu od Zračenja, Petrovac n/m, 29.09.-1.10.2003.god., Sekcija 4: Radioekologija, Zbornik radova, pp. 153-156 (in Serbian).
- M. B. Rajković, M. Stojanović, Č. Lačnjevac, D. Toš- ković and D. Stanojević, “Određivanje Tragova Radioaktivnih Supstanci u Vodi za Piće,” Zaštita materijala, Vol. 49, No. 4, 2008, pp. 44-54 (in Serbian).
- Službeni list SRJ br. 9/99, “Pravilnik o Granicama Radioaktivne Kontaminacije Životne Sredine i o Načinu Sprovođenja Dekontaminacije,” 1999 (in Serbian).
- M. B. Rajkovic, C. Lacnjevac, N. R. Ralevic, M. D. Stojanovic, D. V. Toskovic, G. K. Pantelic, N. M. Ristic and S. Jovanic, “Identification of Metals (Heavy and Radioactive) in Drinking Water by an Indirect Analysis Method Based on Scale Test,” Sensors, Vol. 8, No. 4, 2008, pp. 2188-2207. doi:10.3390/s8042188
- Anonym, “Određivanje Sadržaja Urana Fluorimetrijskom Metodom DM 10-0/34,” Institut za Tehnologiju Nuklearnih i Drugih Mineralnih Sirovina (ITNMS), Beograd, 2004 (in Serbian).
- M. Vrvić and G. Gojgić-Cvijović, “Praktikum za Mikrobiološku Hemiju,” IHTM, Centar za Hemiju, Beograd, 2003 (in Serbian).
- I. Panić, “Ispitivanje Opštih Fizičkohemijskih i Radiohemijskih Osobina Voda Mataruške, Selters i Vrnjačke Banje,” Diplomski Rad, Fakultet za fizičku hemiju, Beograd, 2009 (in Serbian).
- Službeni list SRJ br.42/98, “Pravilnik o Higijenskoj Ispravnosti Vode za piće,” 1998 (in Serbian).
- Anonym, “Pravilnik o Kvalitetu Prirodne Mineralne Vode,” Sl. list SRJ, br. 45/93 i 76/93, ispr. i Sl. list SCG, br. 56/2003, dr. pravilnik, 4/2004, dr. Pravilnik i 37/2005 (in Serbian).
- M. B. Rajković and I. D. Novaković, “Priručnik za Upotrebu Fluorid-Selektivne Elektrode u Analizi Biološ- kog Materijala,” Poljoprivredni Fakultet, Beograd, 2007 (in Serbian).
- http://www. csrg.ch.pw.edu.pl
- M. B. Rajković and B. Vučurović, “Selectivity of Copper (I)—Sulphide in the Presence of Different Interfering Ions,” Review of Research Work at the Faculty of Agriculture, Vol. 37, No. 2, 1992, pp. 147-154.
- T. Petrović, M. Zlokolica-Mandić, N. Veljković and D. Vidojević, “Hydrogeological Conditions for the Forming and Quality of Mineral Waters in Serbia,” Journal of Geochemical Exploration, Vol. 107, 2010, pp. 373-381.
NOTES
*Corresponding author.