Journal of Water Resource and Protection
Vol.4 No.6(2012), Article ID:19902,7 pages DOI:10.4236/jwarp.2012.46046
Biological Removal of Nitrogen Compounds at a Coke-Oven Effluent Stream
1Sweco Environment, Stockholm, Sweden
2SSAB Oxelösund, Oxelösund, Sweden
Email: {stig.morling, niclas.astrand}@sweco.se, ann-kristin.lidar@ssab.com
Received March 8, 2012; revised April 6, 2012; accepted May 5, 2012
Keywords: Single Stage Activated Sludge; Pilot Plant; Nitrification; Coke-Oven Plant; Toxicity Risks; Solids Retention Time
ABSTRACT
The steel company SSAB in Oxelösund, Sweden operates a coke-oven plant and has since a long time operated an activated sludge plant for treatment of effluent water. Along with more stringent requirements on discharge quality, especially focusing on nitrogen compounds and a new consent value for total nitrogen discharge (<30 ppm of total N) the company decided to operate a pilot plant facility to investigate two major issues: 1) To define the conditions and restrictions for nitrification of ammonia nitrogen in the water; 2) To find out how efficiently a denitrification would perform. In order to find answers to these questions SSAB hired a pilot plant for testing. The test facility is based on a single sludge activated sludge reactor system for biological nutrient removal, with a reactor volume of 3.8 m3. After a test period of 5 months it was possible to draw reliable conclusions regarding the performance. The untreated wastewater has a high content of total nitrogen, around 240 ppm. The major nitrogen part is ammonia nitrogen, but an important fraction is found as thiocyanate nitrogen. The following main conclusions were drawn from the test operation: 1) It was found to be crucial that the solids retention time (SRT) was kept at a sufficiently high level. During the successful operation the SRT was in the range of 40 - 50 days; 2) It is desirable to have an equalization basin upstream the main biological reactor to meet short time peak loads, defined as both flow and pollution; 3) The major toxic risks for the biological process were high thiocyanate and ammonia concentrations in the raw wastewater; 4) The system showed however a good microbiological capacity to acclimatize to the prevailing conditions after the needed time; 5) The tests did not include an optimization of the oxygen supply with respect to nitrification; however it was evident that the oxygen level was sufficient to maintain a complete nitrification at normal operating conditions; 6) Once the nitrification was established it was also possible to reach a high degree of denitrification—as long as an external carbon source was applied; 7) It was found that both the cyanide nitrogen and especially the thiocyanate nitrogen were reduced by the process. The cyanide reduction is probably related both to precipitation by ferrous ions and biological transformation.
1. Introduction
Complex industrial wastewater containing cyanide and thiocyanate are found in many different industrial activities, such as coke-oven plants at steel mills, gold mining and extraction plants, electroplating industries and photoprocessing industries. Unless treated properly the effluent will cause environmental nuisances. Some full-scale plants using biological treatment systems are in operation. A rather large number of bench scale studies have addressed the matter with cyanide and thiocyanate containing wastewater the last two decades. An investigation on cyanide containing wastewater from mine drainage was presented by Altringer et al. in 1992 [1]. The findings clearly indicated the possibility to use biological treatment systems for the conversion of cyanides into readily removable nitrogen compounds, such as ammonia and nitrate nitrogen. Some of findings from these studies have relevance to the performed pilot plant operation conducted at SSAB, Oxelösund. By convention a number of the findings are not unique to the biological treatment of wastewater from coke-oven plants. However, the following findings are of special interest for the pilot operation at SSAB.
The known problem with nitrification at high water temperature has been addressed by Kim et al. [2] and Papadimitriou [3]. Kim et al. [2] also pointed out the risk for inhibition of nitrification at high levels of ammonia nitrogen. An interesting observation in the study is a significant difference in nitrification performance related to batch mode operation on one side and a continuous flow activated sludge system on the other side. This observation has been confirmed by Dytczak, et al. [4]. They showed that, quote: “The alternating conditions were more favourable because they selected for faster nitrifiers due to their oxidation, growth, and decay rates.” These observations are important with respect to both the selection of the experimental mode, and the conclusions drawn from the experiments.
The transformation of thiocyanate and phenols in an activated sludge process was studied by Du Plessis et al. [5], Richards and Shieh [6] and Staib and Lant [7]. The transformation of thiocyanate nitrogen into ammonia nitrogen (hydrolysis) makes the nitrogen available for nitrification (and finally a denitrification).
The need of a sufficiently high solids retention time (SRT) for nitrification of wastewater from coke-oven plants has been addressed by Richards and Shieh [6]. Suntad et al. [8] investigated the acclimatization time for bench scale SBR activated sludge treating thiocyanate (SCN). They confirmed the need for a long SRT for acclimatization of the microbiological culture. The acclimatization time also increased with increased SCN loading. The use of SBR activated sludge is commonly used in a laboratory scale size, thanks to the simple way to run it in a small scale. Due to practical reasons the SBR then is operated with a very short fill time and a long react time. This in turn means that most of these tests are operated as very typical “plug flow” reactors rather than as “totally mixed” ones, and even includes a “sludge selector mode” in the operation.
The activated sludge plants operated with a sufficiently high SRT may handle even potentially toxic wastewater, thanks to the ability of the microbiological culture to acclimatise SBR plant operated with extremely high chromium concentrations (10 - 20 ppm). The needed time to acclimatize the process to the prevailing conditions and establish a steady state took around one year. This matter was shown by Morling [9] on a SBR plant operated with high chromium load, located in southern Poland (Nowy Targ). After this acclimatization period of one year not only the nitrification was found more or less complete, but also an advanced removal of Cr.
The extended acclimatization time for an activated sludge system operated with wastewater containing both cyanide and heavy metals was also found by Pasaribu [10].
It was thus expected that the test operation at SSAB would show some difficulties in the establishment of a good nitrification in the pilot plant.
2. Material and Methods
The pilot plant used at the tests has the following configuration:
• A mixing and flocculation compartment (not operated during the tests);
• A pre-settling stage (not operated during the tests);
• Six units of bio-reactors arranged in series. The total reactor volume is 3.8 m3. All reactors may be operated as aerobic or anoxic/anaerobic units by means of aeration or mixing.
• A final clarifier for settling of activated sludge;
• Return Activated Sludge (RAS) pumping is arranged with an eccentric screw pump with a variable capacity within the range of 80 - 800 l/h. The normal rate during the test operation was 90 - 120 l/h;
• The air supply is provided by a compressor;
• A dosing station with small membrane pumps is used to add phosphorus acid, an alkaline agent, and methanol during tests.
In the pilot plant biological reactor dimensions and theoretical hydraulic retention times (HRT) based on an influent flow of 45 l/h, are presented in Table 1.
Figure 1 shows a simplified flow sheet of the pilot plant.
Water sampling, based on grab samples was arranged at three different points in the pilot plant facility—see also Figure 1:
• A buffer basin upstream the plant; in the following labeled raw wastewater (Point 1);
• In the third reactor of the pilot plant (Point 2);
• At the discharge point from the pilot plant (Point 3).
In addition to these points a special sampling program was used to identify the nitrification performance in the reactor. These analyses serve as a basis for the nitrate profiles for the plant presented in the next section.
Sampling and analyses were also performed on the return activated sludge. Analyses were mainly performed at SSAB: s own laboratory, following the standard analysis procedures for the different pollutants.

Table 1. Dimensions of the pilot plant biological reactors, and the hydraulic retention time at a flow = 45 l/h.

Figure 1. Flow sheet of the pilot plant facility used at the test with the sampling locations shown.
It is important to remember that a so called single sludge system, such as a recycling system as used at this test, or in a fill-and-draw system, the nitrification/denitrification takes place more or less simultaneously; see Papadimitriou et al. [3] or Morling [9]. Thus it may be easy to draw long reaching conclusions based on these systems when reaction rates are calculated. Two principally different models for activated sludge system are often identified:
• Plug flow operation;
• Totally mixed operation.
Both the main treatment facility at SSAB and the test plant would be addressed as totally mixed plants. In the case of the pilot plant the high ratio RAS (Return Activated Sludge stream) to inlet flow is the main reason for this statement.
The pilot plant operation started with an inoculation of activated sludge from the main treatment plant at SSAB. The inoculation had to be repeated a number of times as the nitrification evidently was retarded. At the same time the main treatment facility was operated with more or less a complete nitrification. This in turn resulted in the decision to extend the test period and to adjust the daily load into the test plant. Finally the test period covered around five months, from November 2008 through to the second half of March 2009.
During the start period of the tests dosing of chemicals was done in the same manner as for the main treatment plant. Ferric chloride and phosphoric acid were added. During a short time the ferric dose was increased in order to promote the build up of sludge in the system. The plant pH regulation range was 6.8 < pH < 7.3.
3. Results and Discussion
3.1. Flow Variations during the Test Operation
During start up of the test operation (early November 2008) the inlet flow was 200 l/h; however, it was soon found to be too high. After around two weeks the inlet flow was lowered to 100 l/h and further down to 60 - 70 l/h after one month. The main reason was to facilitate the start of nitrification. This flow was maintained for about a month, as a growing nitrification was identified. During Christmas and New Year the flow load was further decreased in order to maintain the nitrification. By January 7 the plant was operated with an inlet flow of 30 l/h and soon after (January 9) a dilution of 15 l/h was introduced. This operation mode was maintained until a complete denitrification was established in early March 2009. Then the inlet flow was increased to 36 l/h and the dilution flow to 18 l/h. This operation mode was maintained until the end of the test operation. The return activated sludge (RAS) flow has varied in the range 90 - 120 l/h. This variation was mainly related to the pump capacity and not necessarily to the actual process needs. This means that the ratio RAS to inlet flow varied from 1:1 to 4:1. The changes in inlet flow load were governed by the needs to establish nitrification in the test facility.
3.2. Temperature
The water temperature was kept more or less constant throughout the tests at 25˚C - 30˚C. Only at a short period the temperature fell to around 20˚C. This temperature drop caused a minor retardation in the nitrification activity, however, during this period the loading of the plant was low, thus the overall nitrification in the system was kept at an acceptable level.
3.3. Sludge Properties
The MLSS-concentration in the reactor varied between 4500 - 6500 mg/l. The actual distribution of MLSS and MVLSS was analyzed at nine different times during the tests. As an average the VSS fraction during the tests was 65% of the SS content. This may be compared with the full scale plant that operated at a VSS-fraction of 85%. This difference is noticeable, and may be attributed to the addition of ferric chloride to the test plant. Inert material will accumulate in the bioreactors due to this addition. The subsequent decrease of VSS in the reactor would be proportional to the addition of ferric chloride.
Very few withdrawals of waste activated sludge were done during the test period. As a matter of fact the SS amounts in the effluent from the plant represented the main method of SRT control. At the two operation modes during stable nitrification conditions, 60 l/h and 45 l/h, the corresponding (theoretical) SRT: s was calculated as follows:
• At flow load = 60 l/h the SRT was around 40 days;
• At flow load = 45 l/h the SRT was around 53 days.
In Figure 2 a simplified balance over the test plant is shown.
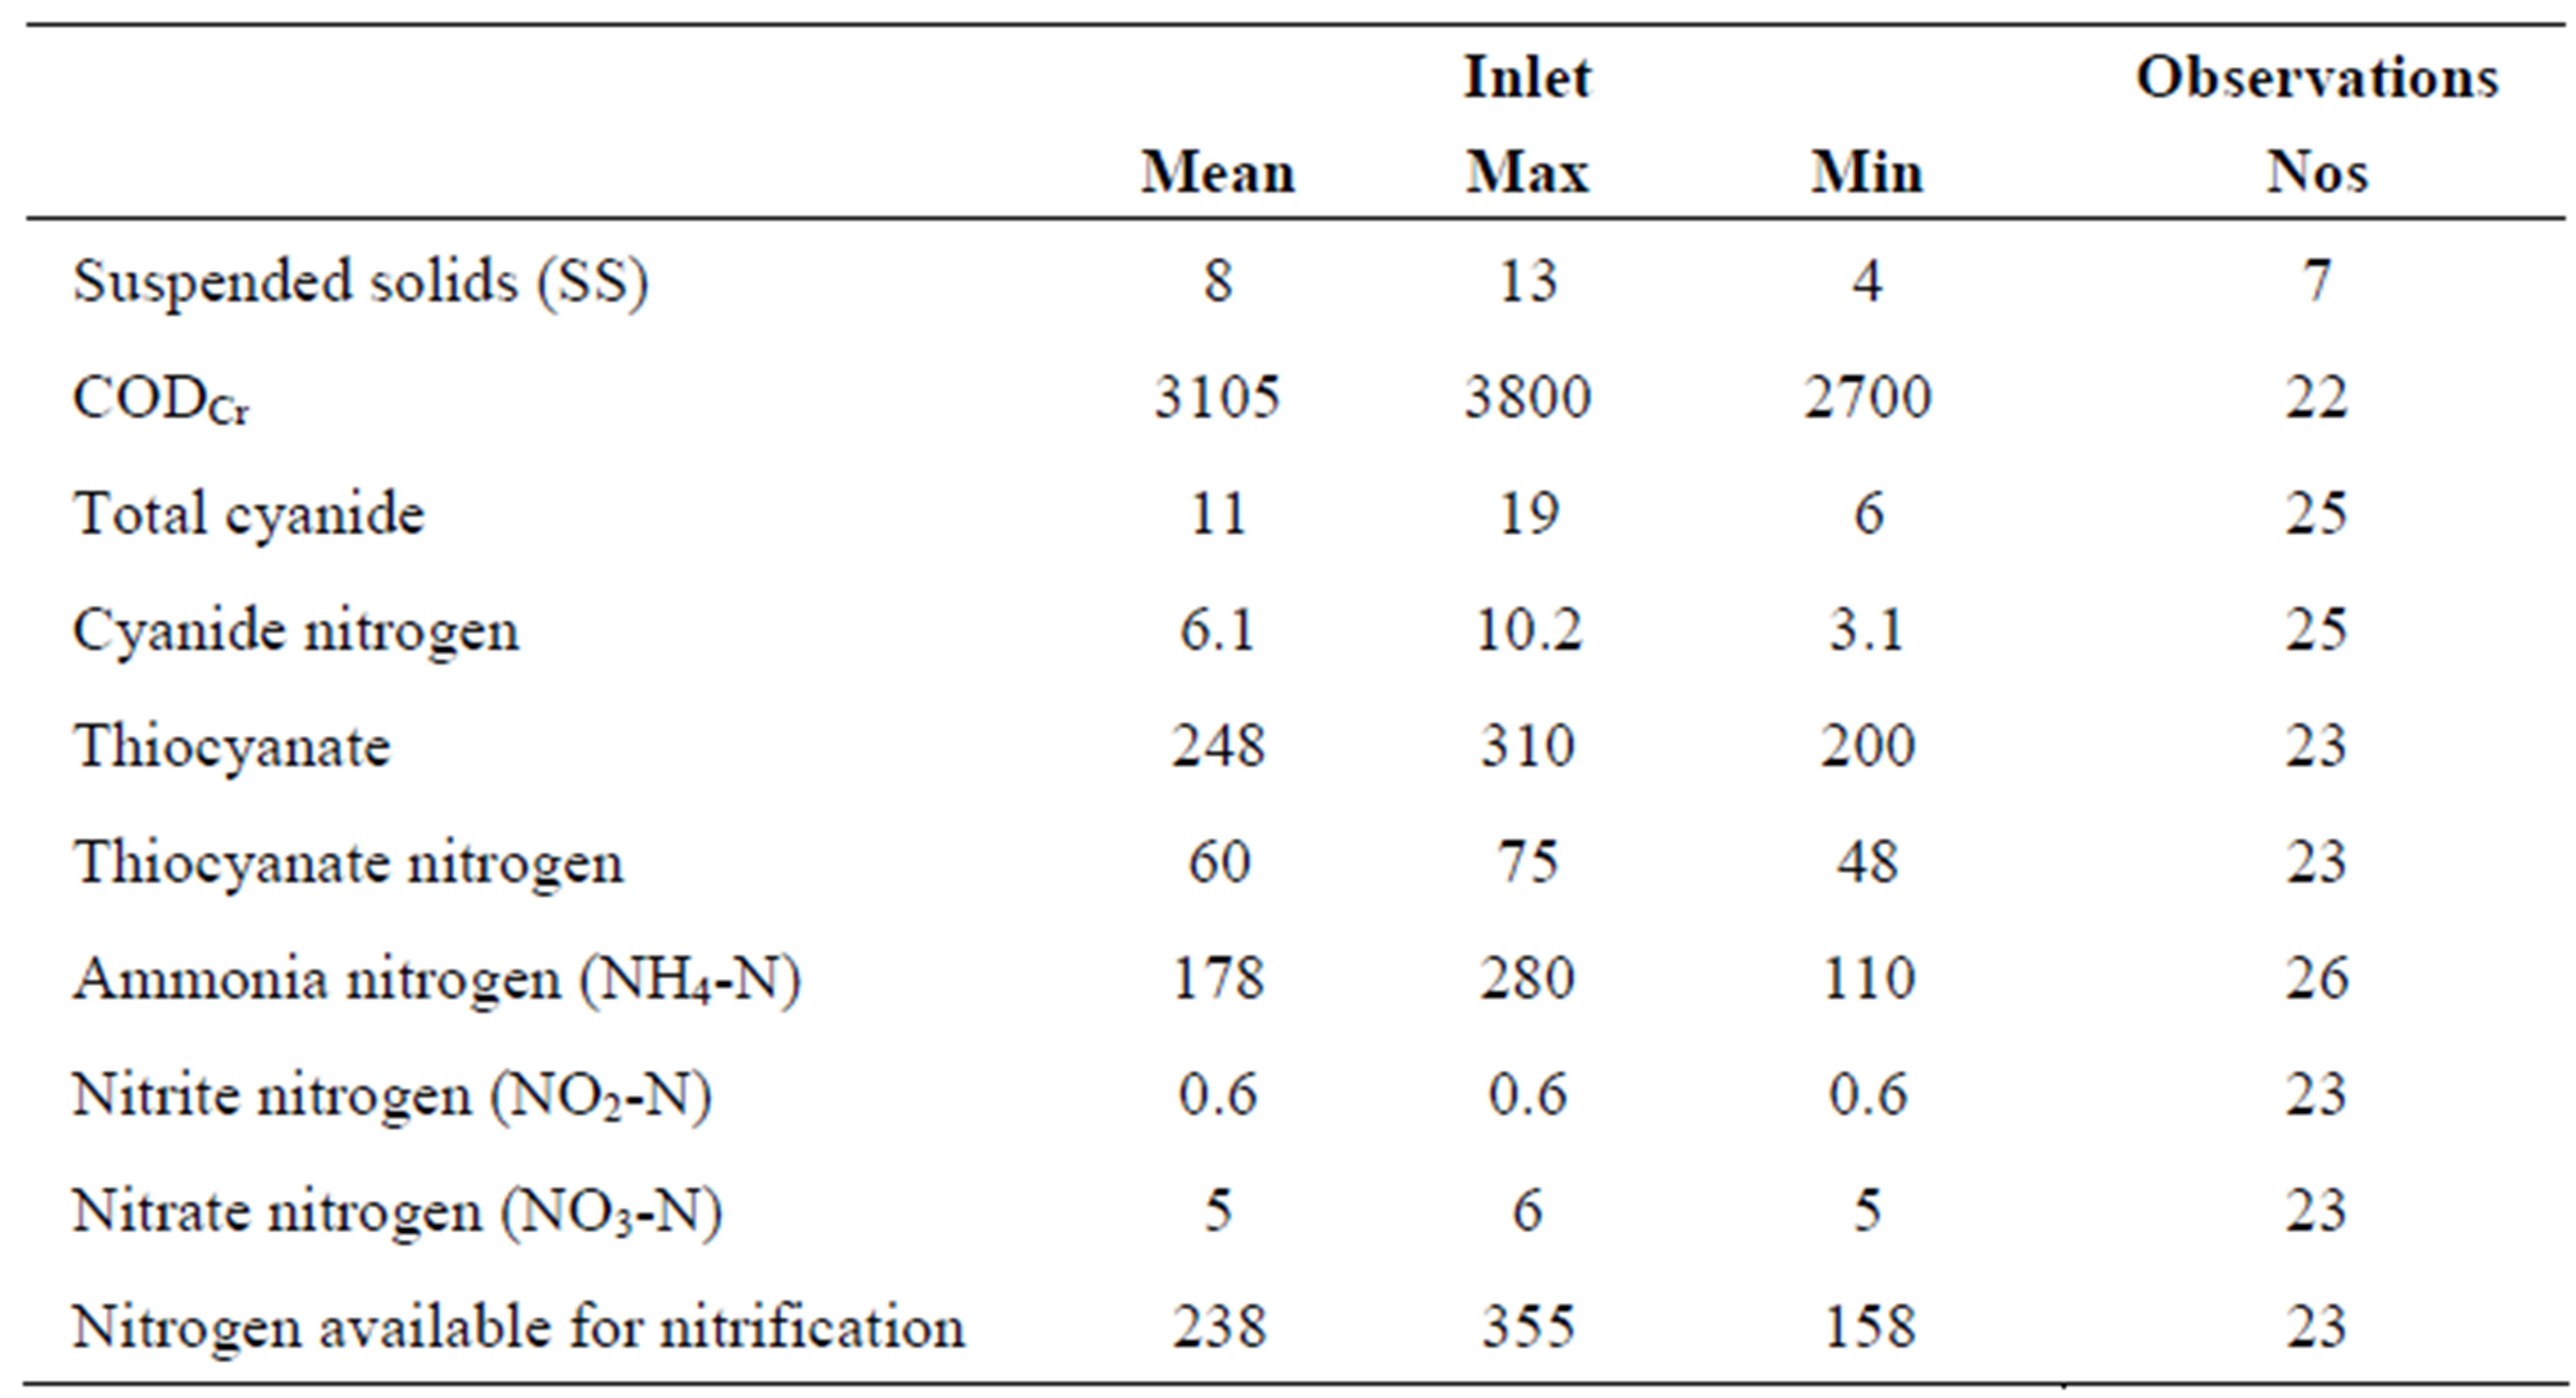
Main pollutants variations during the test operation the inlet wastewater composition has been analyzed and recorded as presented in Table 2. Apart from suspended solids (SS) the total number of analyses covers more than 22 occasions. As the inlet water had low content of SS it was decided to exclude this analysis on incoming water.
Organic compounds measured as COD have been more or less stable and at rather high concentrations; range from 2700 to 3800 mg COD/l. The cyanide level was found rather limited and the easily removed part was less than 25% of total cyanide. The nitrogen cyanide content was less than 3% of the nitrogen available for nitrification. The thiocyanate content has varied in a range +/– 20% throughout the test period. The nitrogen part of the thiocyanate ranges from 48 to 75 mg N/l. Ammonia nitrogen is by far the most important nitrogen compound; as an average 178 mg N/l of totally 238 mg total N/l available for nitrification. Inlet nitrite and nitrate concentrations are low to very low throughout the test period; nitrate nitrogen does not exceed 6 mg N/l.

Figure 2. Simplified sludge balance over the reactor system in the test plant at inlet load =45 l/h.

Table 2. Composition of incoming wastewater to the pilot plant, including the number of observations.
Theoretically the thiocyanate nitrogen is available for nitrification after a hydrolysis into ammonia nitrogen. The nitrogen available for nitrification varies thus from 158 to 355 mg N/l in incoming wastewater. Based on the average nitrogen concentration the specific nitrogen loads on the plant have been recorded. The MLSS-concentration in the reactor was as an average 5.5 kg SS/m3, whereof the MVLSS part was 65%. The load values are presented in Table 3.
As the full scale plant at SSAB was in operation it is possible to compare the pilot plant data with the full scale plant data during the same period. The corresponding values are given in Table 4. In contrast with the pilot plant the MLSS concentration in the full scale plant was 7.5 kg SS/m3 and the VSS fraction 85%.
From Tables 3 and 4 it may be concluded that the initial test flow was to be considered high to very high in relation to the operation conditions of the full scale plant. At an inlet flow to the test facility of 100 l/h the volumetric load expressed as kg N/m3/d was similar in the test facility and the full scale plant. At a flow of 60 l/h into the test plant the specific load was similar with the full scale plant, or around 0.025 kg N/kg MVLSS/d. With a flow of 30 l/h to the pilot plant, the specific nitrogen load was substantially lower than in the full-scale plant.
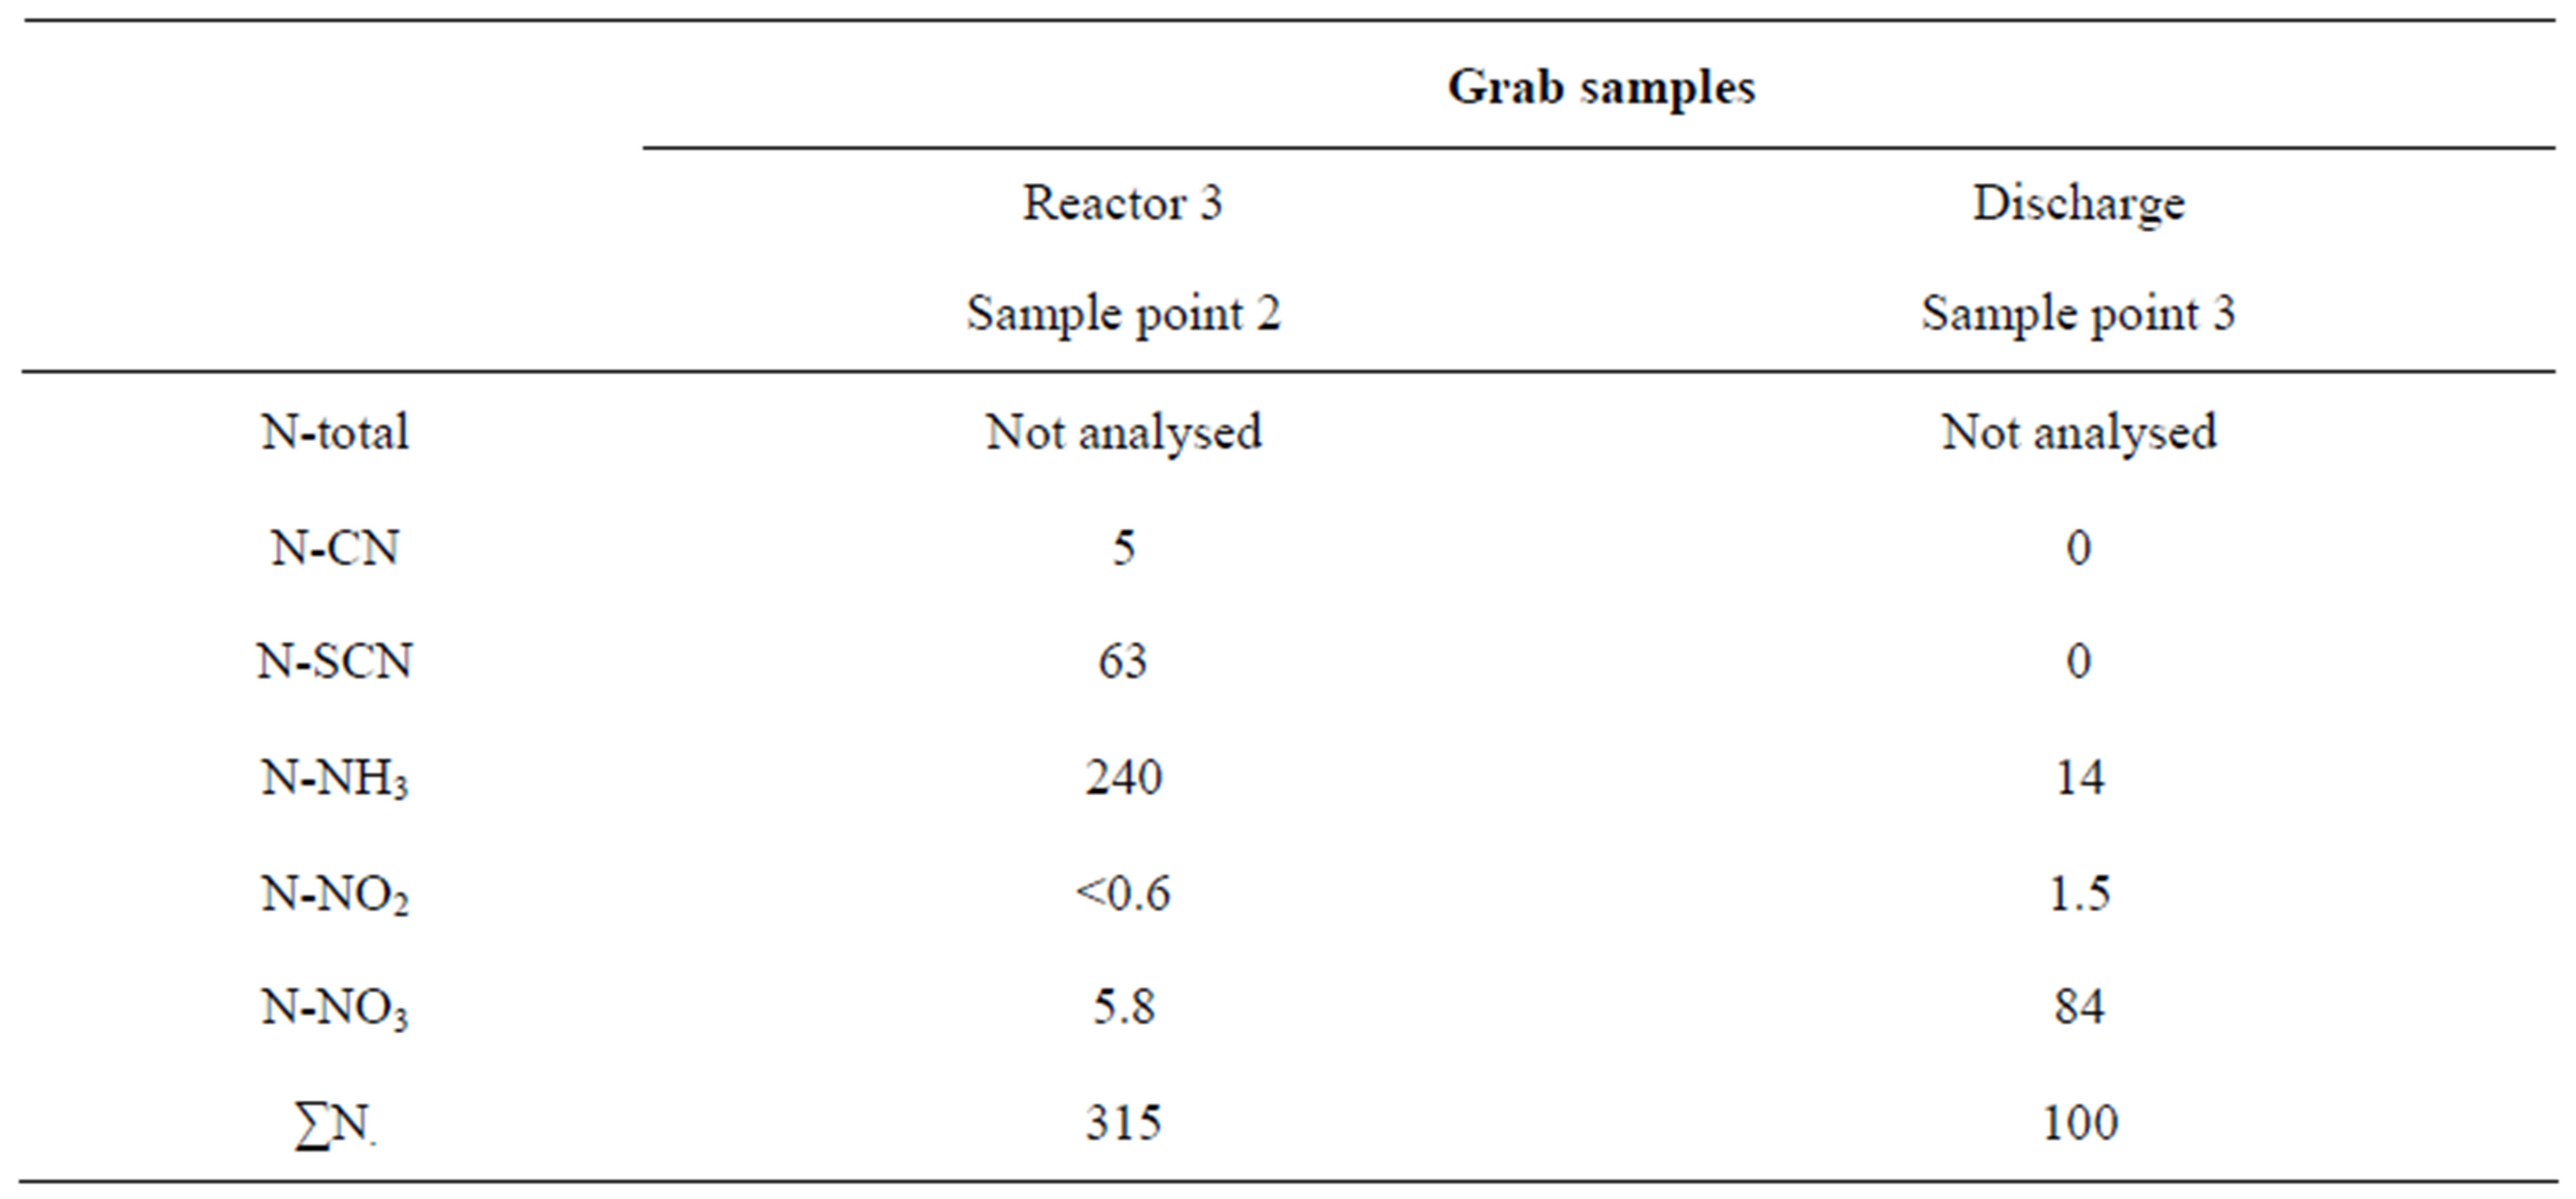
On December 17 analyses were performed on the different nitrogen fractions in reactor 3 (sampling Point 2) and at discharge from the pilot plant (sampling Point 3). The results are shown in Table 5. It should be observed that both cyanide nitrogen and thiocyanate nitrogen were removed completely at this occasion. The removal of cyanide may be attributed to both oxidation and formation of Ferric cyanide.

Table 3. Nitrogen load on the test plant related to the inlet flow, based on average nitrogen concentration of 238 mg N/l.

Table 4. Nitrogen loads at SSAB full scale plant during the test period.

Table 5. Nitrogen compounds and transformation at the pilot plant (mg/l) based on grab samples December 17, 2008.
As found in Table 5 the nitrification had been established quickly after the adjustment of the nitrogen load into the plant—the actual flow at this sampling date was 60 l/h. The conversion of thiocyanate into ammonia was complete. The oxidation of ammonia nitrogen into nitrates was nearly complete. The assimilation of nitrogen to the activated sludge was not measured at the time. However, also a substantial denitrification evidently occurred at this stage in the plant. The analysis indicates a more than 65% removal of nitrogen by denitrification. These results demonstrate that the buildup of nitrifiers was made possible by the load limitation that took place in early December. It would be observed that the return activated sludge contained ammonia nitrogen acting as an internal load during the nitrification build up period. A further load decrease was imposed before Christmas to safeguard the nitrification even during the vacation period ending on January 7. In second half of the same month the nitrification was stable, allowing for further tests on denitrification as well. During the period with complete nitrification (from the first half of January) the inlet ammonia concentration varied from 130 to 250 mg NH4-N/l, and the concentration of nitrogen available for nitrification varied from 200 to 330 mg N/l.
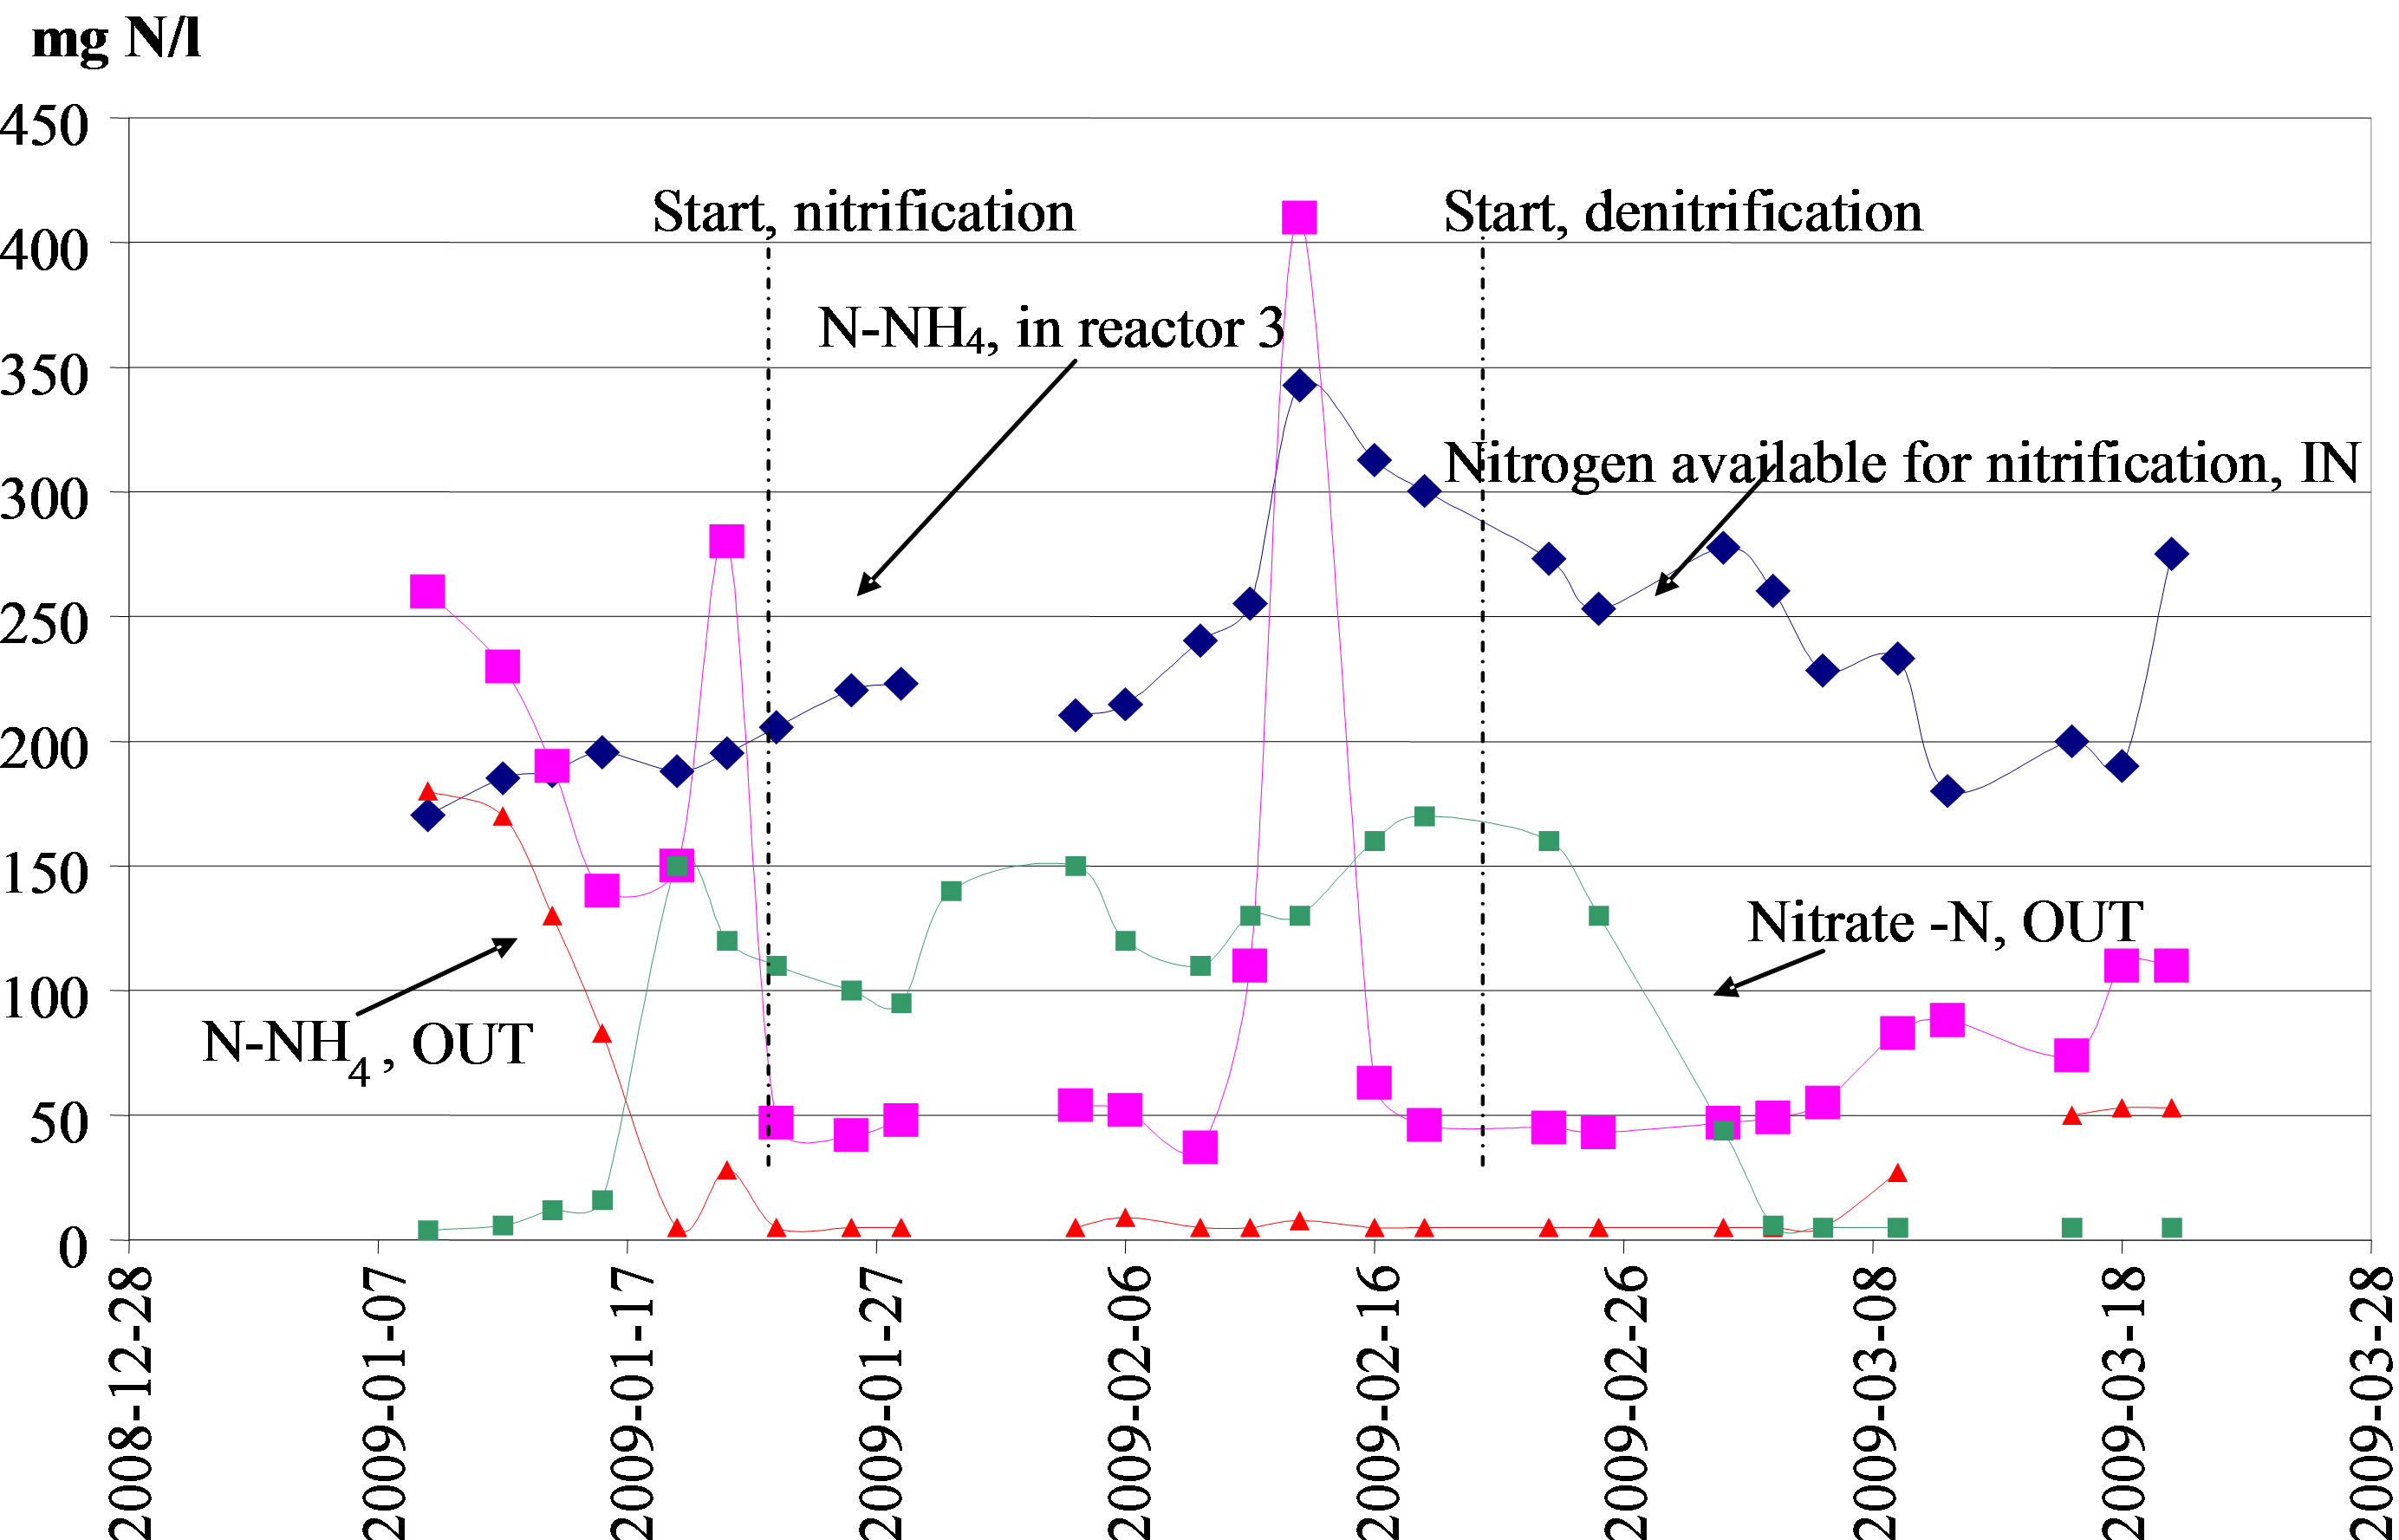
The denitrification was enabled by adding methanol to the anoxic zones in the process. The process was then operated as a post-dentrification system rather than in the classical pre-denitrification mode. The main reason for this action was to make the nitrification to establish as soon as possible. The tests showed that complete nitrification and denitrification was possible to maintain. Once the denitrification was established the total nitrogen removal was more than 90 %. The actual discharge levels of total nitrogen during this period were < 20 mg N/lwith a minimum level of 5 mg N/l. In Figure 3 is shown the performance pattern with respect to the conversion and removal of the nitrogen entering the test plant from January 7 until the end of the test operation on March 20. All three samplings points are represented in the figure.
Two significant values for N-NH4 differ from the general pattern. Both values are higher than total N available for nitrification. It was suspected that these two values are due to errors in the analysis work. The other nitrogen fractions do not show a similar pattern.
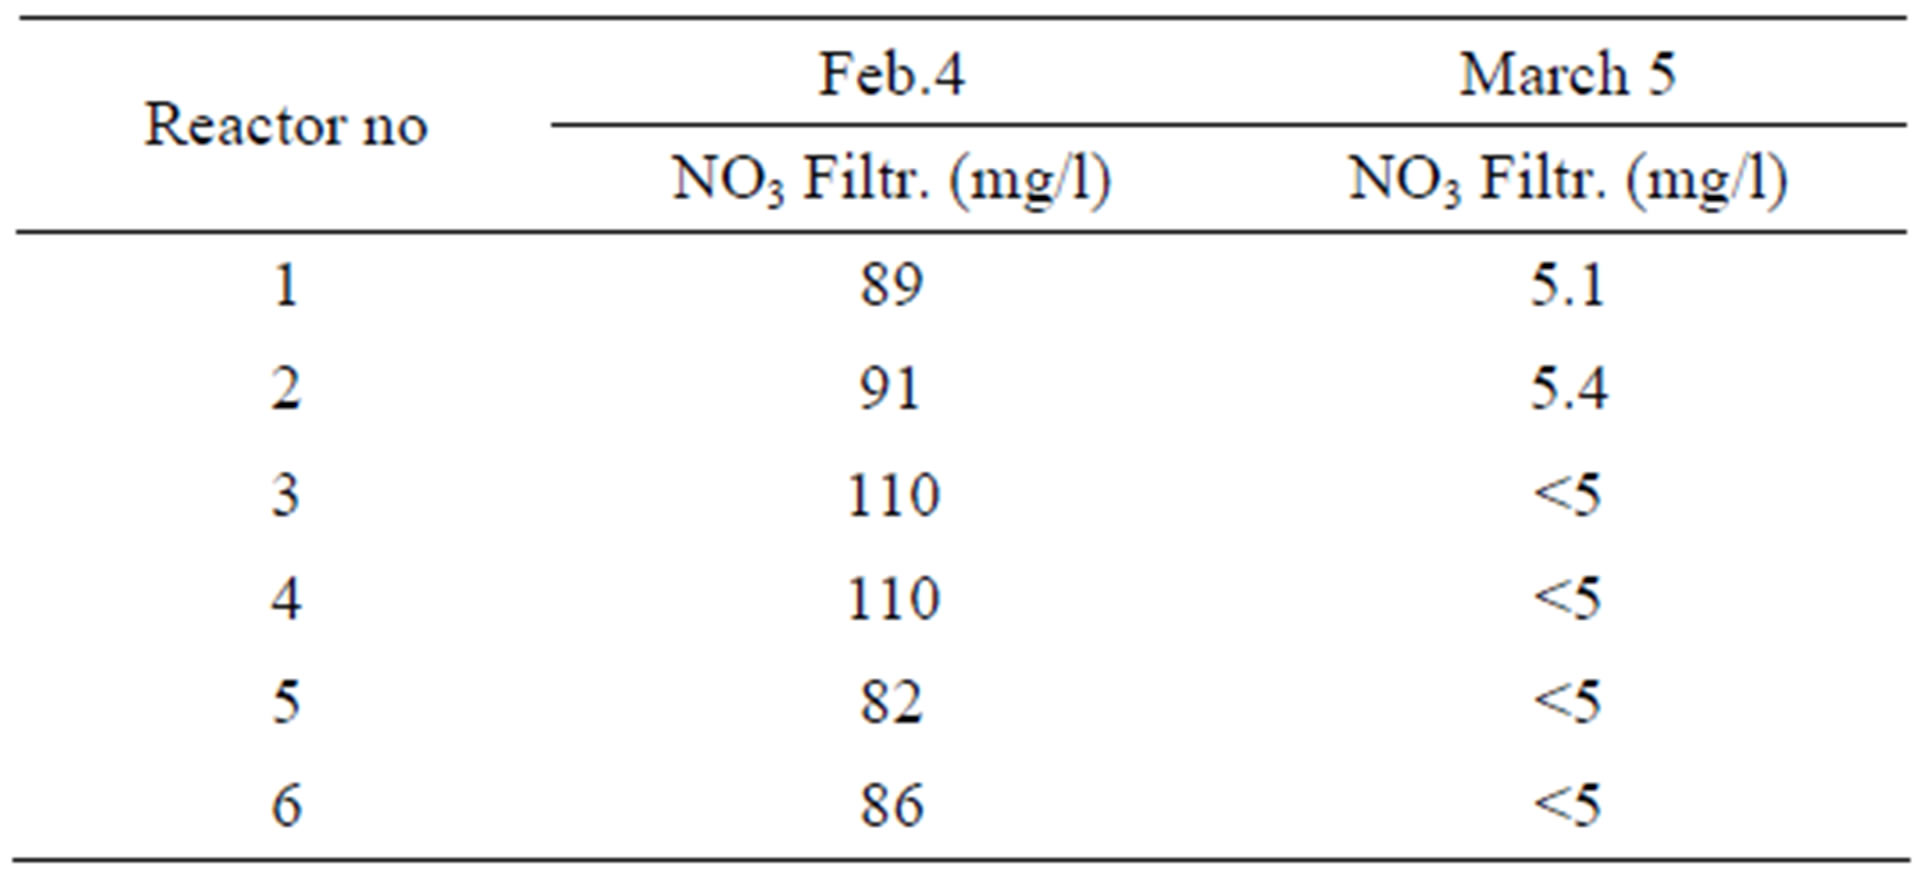
The actually found nitrification rates during the test operation varied between 1.4 and 1.8 g Nox/kg VSS/h when the nitrification performed sufficiently well. Two reasons explain the variations. Firstly, the basis for the performed analysis is grab samples. Secondly when the nitrification is complete—that is the ammonia nitrogen is close to 0. Thus it is not possible to find the ”potentially available” nitrification rate. It may only be stated that the reaction rate is at least the one that is calculated based on the analysis results. In Table 6 is shown the nitrate profile through the reactor system when the nitrification was complete, before the start of addition of methanol (on February 4). As a comparison a profile through the system is shown when the addition of methanol for denitrification had been running for three weeks.
The denitrification showed to be insensitive to the prevailing load variations during the test period. Even when the nitrification was incomplete all nitrified nitrogen was denitrified. The calculated denitrification rate, based on the results was 0.5 - 0.6 g Nred/kg VSS/h. Again it must be stated that the real reaction rate may be higher, as the system was performing a more or less complete denitrification.

Figure 3. Nitrogen fractions in inlet and outlet during the final part of test operation, January through March 2009.

Table 6. Nitrate profile through the reactor system during nitrification (February 4, 2009) and during denitrification (March 5, 2009).
4. Conclusions
Biological treatment by activated sludge has been shown to be successful on wastewater from a coke-oven plant. The content of complex nitrogen compounds such as cyanide and thiocyanate along with high concentrations of ammonia nitrogen have been removed after an acclimatization period. The needed solids retention time to establish a stable nitrification is probably less than 40 days. A complete denitrification was found possible as long as available organic carbon is sufficient. However, the needs for an external carbon source are found to be very limited, as the content of organic carbon in the coke-oven water is normally sufficient.
The nitrification rate at temperature of 25˚C to 30˚C was found to be at least 1.4 g Nox/kg VSS/h.
Different chock loads by temperature fall or peak concentrations of ammonia or thiocyanate would be mitigated by upstream equalization or by an extended treatment volume.
Operation of a scaled up pilot plant at actual operating conditions rather than bench scale operation may provide more information that is relevant for design of a full scale plant.
5. Acknowledgements
This paper has been made possible thanks to SSAB, Oxelösund, Sweden that financed the pilot plant study. The day by day operation of the pilot plant was in the capable hands of Hans Jonsson. Lars Alvin, at that time a staff member of Sweco, acted as co-ordinator for the study. Mr Guy Taylor has scrutinized this paper from linguistic point of view.
REFERENCES
- P. B. Altringer, R. H. Lien and B. E. Dinsdale, “Advances in Biological Cyanide Detoxification,” Randol Gold Forum, Vancouver '92, Vancouver, March 1992, pp. 395- 400.
- Y. M. Kim, D. Park, D. S. Lee and J. M. Park, “Instability of Biological Nitrogen Removal in a Cokes Wastewater Treatment Facility during Summer,” Journal of Hazardous Materials, Vol. 141, No. 1, 2007, pp. 27-32. doi:10.1016/j.jhazmat.2006.06.074
- C. A. Papadimitriou, X. Dabou, P. Samaras and G. P. Sakellaropoulos, “Coke Oven Wastewater Treatment by Two Activated Sludge Systems,” Global NEST Journal, Vol. 8, No. 1, 2006, pp. 16-22.
- M. A. Dytczak, K. L. Londry and J. A. Oleszkiewicz, “Activated Sludge Operational Regime Has Significant Impact on the Type of Nitrifying Community and Its Nitrification Rates,” Water Research, Vol. 42, No. 8-9, 2008, pp. 2320-2328. doi:10.1016/j.watres.2007.12.018
- C. A. Du Plessis, P. Barnard, R. M. Muhlbauer and K. Naldrett, “Empirical Model for the Autotrophic Biodegradation of Thiocyanate in an Activated Sludge Reactor,” Letters in Applied Microbiology, Vol. 32, No. 2, 2001, pp. 103-107.
- D. J. Richards and W. K. Shieh, “Anoxic-Oxic Activated-Sludge on Cyanides and Phenols,” Biotechnology and Bioengineering, Vol. 33, No. 1, 2004, pp. 32-38.
- C. Staib and P. Lant, “Thiocyanate Degradation during Activated Sludge Treatment of Cock-Ovens Wastewater,” Biochemical Engineering Journal, Vol. 34, No. 2, 2007, pp. 122-130. doi:10.1016/j.bej.2006.11.029
- S. Suntud, C. Kanidta and S. Pattama, “Some Properties of a sequencing Batch Reactor for Treatment of Wastewater Containing Thiocyanate Compounds,” Journal of Environmental Management, Vol. 85, No. 2, 2007, pp. 330- 337. doi:10.1016/j.jenvman.2006.09.016
- S. Morling, “Plant Performance of an Sequencing Batch Reactor in Poland, Operated with High Chromium Load, Reaching Advanced Nutrient Removal,” Water Practice and Technology, Vol. 4, No. 1, 2009.
- S. R. Pasaribu, “Biological Treatment of a Wastewater Containing Heavy Metals and Cyanide,” Jurnal Sistem Teknik Industri, Vol. 6, No. 5, 2005.

