Journal of Water Resource and Protection
Vol. 3 No. 6 (2011) , Article ID: 5651 , 8 pages DOI:10.4236/jwarp.2011.36054
GIS Based Identification and Assessment of Groundwater Quality Potential Zones in Puri City, India
1National Environmental Engineering Research Institute, Nehru Marg, Nagpur, India
2Project Engineer, Orissa Water Supply & Sewerage Board, Water Works, Puri, India
E-mail: r_vijay@neeri.res.in
Received March 19, 2011; revised May 2, 2011; accepted June 4, 2011
Keywords: Groundwater, contamination, anthropogenic activity, abstraction, GIS
ABSTRACT
Puri city is situated on the east coast of India and groundwater is the only source available to meet the potable water supply of the city. The objective of the study was to assess the impact of anthropogenic activities on groundwater quality and to identify the groundwater potential zones for drinking water production using GIS. Major sources of groundwater contamination in the city were open discharges of domestic sewage, inadequate sewerage system, open defecation, septic tanks, soak pits, contaminated water pools and unorganized solid waste dumping. Groundwater samples were collected and analyzed during post and pre monsoon to evaluate the drinking water quality as per Indian standards. The groundwater zones were prepared based on weighted index overlay analysis by assigning the weights based on the drinking water standards under different classes of individual water quality parameters. Finally, the potential zones were identified and assessed as suitable, moderately suitable and unsuitable for domestic purpose. Based on groundwater quality and geospatial analysis, measures were suggested to protect groundwater resources.
1. Introduction
Due to uneven spatial and temporal distribution of rainfall and lack of sufficient water management practices, developmental activities of the society are totally depend on groundwater resources [1]. Even in India, the groundwater is the main source for meeting the various needs of the society. Due to anthropogenic activities, lack of sanitation, improper waste disposal, faulty well construction and water source protection measures, groundwater is getting polluted [2,3]. Variation in groundwater chemistry with time provides information on the impact of land use land cover changes on the water quality [4]. Domestic sewage, septic tanks and soak pits are also contributing to groundwater pollution significantly in most of the cities due to presence of nutrients, detergents, human and animal excreta [5,6]. Among the groundwater pollutants, nitrates are perhaps the most ubiquitous of all groundwater contaminants [7]. Heavy pumping and excessive use of near-coast groundwater has caused rapid depletion of water tables as well as deterioration of water quality in most of the coastal cities [8-10].
Puri is a coastal city and an internationally acclaimed tourist spot due to high religious importance. Due to dense and high floating population in the city, inadequate sewerage system and anthropogenic activities, quality of the groundwater is deteriorating. Since the city is situated along the coast and groundwater is the only source available to meet the water supply, it is essential to safe guard the groundwater resources from human activities and saltwater intrusion. The objective of the present study was to identify and assess the groundwater potential zones for domestic purposes based on the physicochemical and bacteriological parameters. The groundwater potential zones were identified by assigning the weights based on the Indian drinking water standards under different classes of individual water quality parameters using geospatial techniques.
2. Study Area
Puri city is situated on shoreline of the Bay of Bengal, India, lies between 19˚47' to 19˚50' North latitudes and 85˚48' to 85˚52' East longitudes (Survey of India toposheet 74E/13). The city extracts water from groundwater resources (20.44 million litre per day) mainly from two water fields namely Chakratirtha and Balia Panda and some production wells in the city area (Figure 1). The general topography of the town slopes smoothly towards south-eastern though there are several local slopes in all directions due to the presence of sand mounds and dunes. The ground elevation varies from sea level to 18.8 m above mean sea level (msl). The climate of Puri is warm-humid with the maximum and minimum temperature are 37.5˚C and 27.0˚C in the summer while 28.2˚C and 15.2˚C in winter. The mean annual rainfall is about 1520 mm from the southwest monsoon. The population of the city was 157,640 as per 2001 census records [11].
The major hydrogeological units in the study area are consolidated (Khondalite suite of rocks) and unconsolidated formations (tertiary and quaternary sediments). The groundwater near the surface, occurs under phreatic condition. Groundwater at depth occurs under semi-confined condition. The water bearing zones are extensively interconnected and have prolific yield potentials. The thickness of the upper sand layer in the aquifer varies from 25 to 35 m based on the resistivity survey. The city is underlained by sand and clay of different thicknesses as the major constituent of the shallow aquifer [12].
3. Methodology
For this study groundwater was sampled and analysed and GIS based computation for identification and assessment of potential groundwater zones were carried out. The steps involved in the methodology are presented in the following sub-sections.
3.1. Sample Collection and Analysis
Groundwater samples were collected from main water supply sources through production wells from Chakratirtha and Balia Panda water fields and additional samples from city production wells, hand pumps and open wells as well as open water bodies (Figure 1). In the present study, around 50 groundwater samples were collected during post monsoon (November 2006) and pre monsoon (June 2007) seasons under specific areas to represent the groundwater quality scenario of the city. The fieldwork included water level measurements, collection of groundwater samples, inventory of bore wells and hydrogeological information of the area.
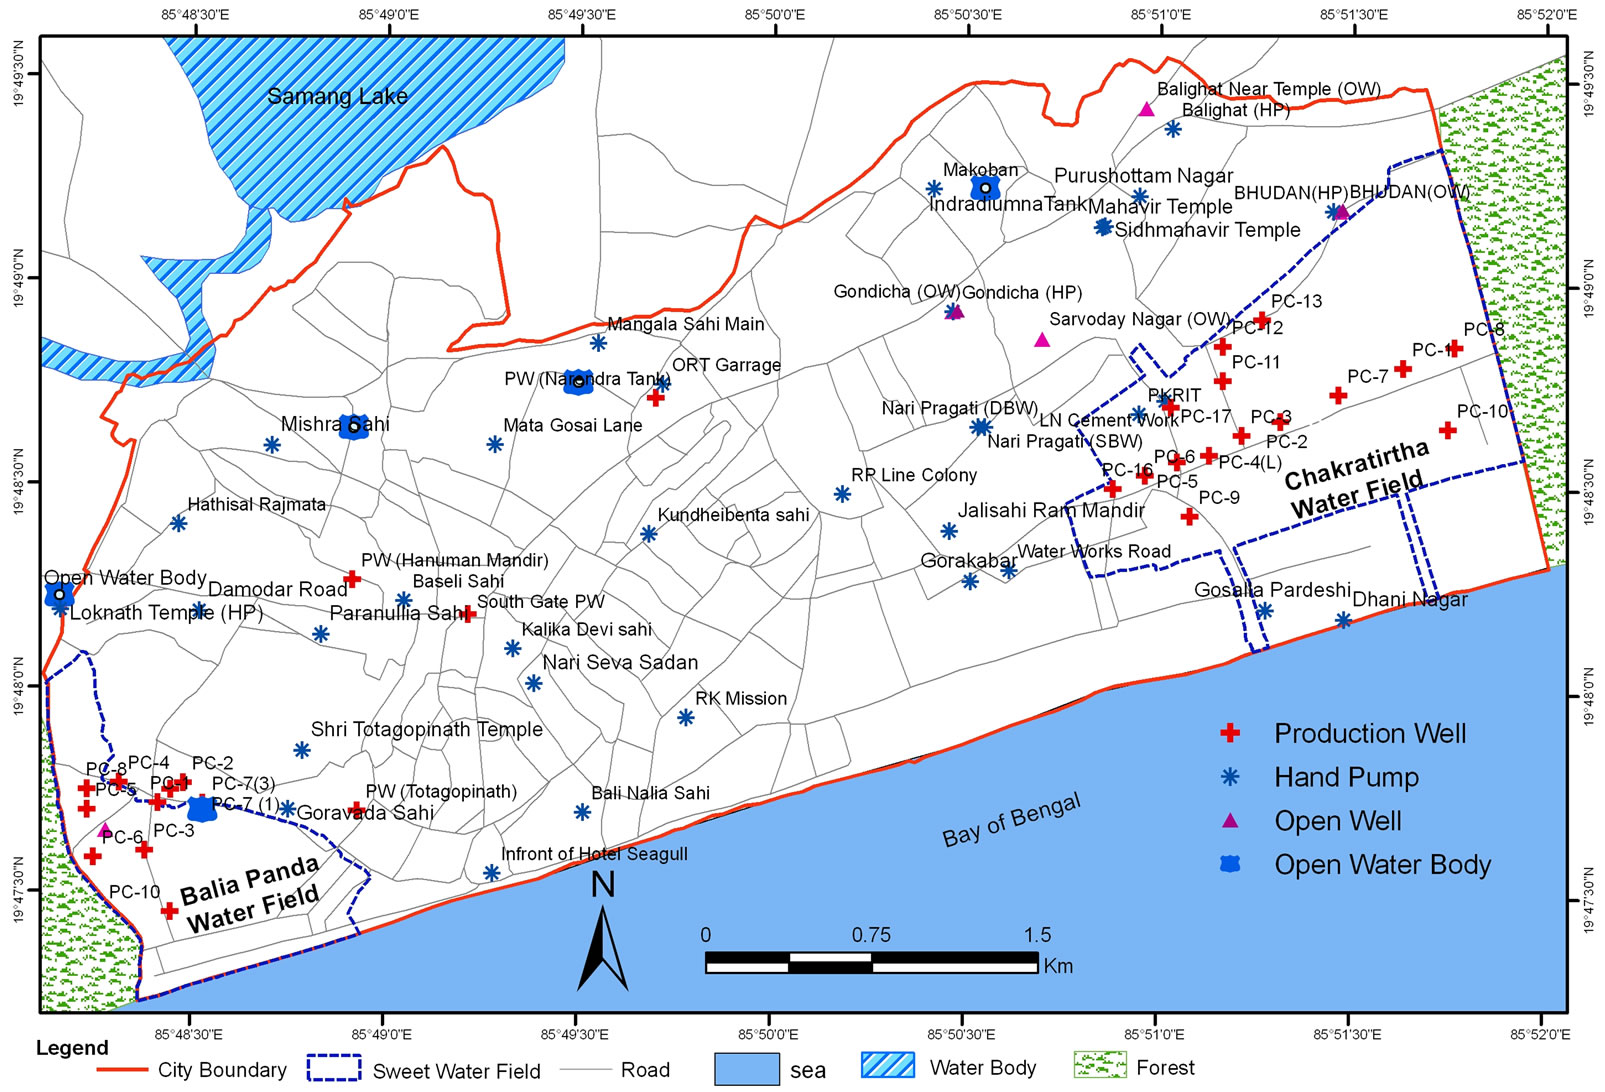
Figure 1. Study area and groundwater sampling locations.
Samples were collected, preserved and analyzed as described in [13], and Chemistry for Environmental Engineering [14] for physico-chemical and bacteriological parameters. Parameters considered in the groundwater quality analysis were based on drinking water standards. Groundwater samples were analyzed for pH, Total Dissolved Solids-TDS, Total Hardness, Alkalinity, Calcium, Magnesium, Sulphate, Nitrate, Chloride and Fluoride, Total Coliform (TC), Fecal Coliform (FC) and Iron from individual sample collected during post and pre monsoon
3.2. GIS Based Analysis
This includes two phases. Phase I involves preparation of thematic maps and phase II involves computation of groundwater quality zones.
Phase I—Database development This includes preparation of thematic maps of city boundary, road network, water fields (sweet water zones) and groundwater sampling locations (Figure 1). The groundwater samples from production wells, hand pumps, open wells and open water bodies were located in the physical environment using global positioning system (GPS) and transferred on GIS environment (ArcGIS 9.1). Groundwater quality data based on the physico-chemical and bacteriological analysis was attributed to each sampling locations. The current land use land cover (LULC) practice in city has been prepared based on the remote sensing analysis (ERDAS 8.7).
Phase II—Analysis This phase includes construction of spatial surfaces of each physico-chemical parameters using the point data. The surfaces were generated and classified based on the desirable and permissible limits of individual parameters according to Indian drinking water standards [15] to know the spatiotemporal distribution of groundwater quality. The weights were assigned to each class of individual surfaces based on drinking water criteria except for total hardness. Total hardness was classified according to Sawyer & McCarty, 1994 considering the soft, moderately hard, hard and very hard water [14]. Human judgment is also incorporated in the data analysis during assigning the weights for each class of individual parameter based on the impact and health effects. Highest weight was assigned to the class that is most favourable and the lowest weight was assigned to the class that is least favourable or unsuitable for domestic purpose.
Individual water quality surface was prepared and classified by assigning the various weights as defined in Table 1. The same process was repeated for all the water quality parameters. Finally, all the layers were integrated using weighted index overlay analysis [16] to differentiate groundwater quality potential zones. This overlay analysis results thousands of polygons and each polygon included number of weights which made the database complex. The cumulative weight of each polygon was calculated as a sum of all the weights assigned based on groundwater quality parameters and drinking water standards. These cumulative weights in the final layer were further classified as suitable, moderately suitable and unsuitable for domestic purpose.
4. Results and Discussion
The groundwater quality of post and pre monsoon is presented in Table 2 and Table 3 respectively based on physico-chemical and bacteriological analysis. Individual parameter is presented based on the average and standard deviation of the samples in particular specific areas. Due to averaging, individual values were within Indian drinking water standards in Table 2 and Table 3, although some of the samples were found above permissible limits. As per groundwater quality, TDS, hardness, alkalinity, chloride, sulphate, fluoride and nitrate were higher in city area compared to the water fields in both the seasons. Except TDS, fluoride, chloride at certain locations and nitrate at various locations, most of the parameters were within desirable and permissible limits of drinking water standards. The concentration of nitrate was high in pre monsoon while it was found low in post monsoon due to dilution available through groundwater recharge. Presence of nitrate in groundwater is mainly due to human activities like domestic effluent, human and animal excreta, septic tank, soak pits and inadequate sewerage system in the city. According to Indian drinking water standards, nitrate concentration above 45 mg/l is not suitable for drinking purpose.
Based on the bacteriological analysis, FC and TC were positive in more number of samples during pre monsoon (Table 3) as compared to post monsoon (Table 2). Even TC and FC were found in both the water fields which are the main sources of water supply. Open wells and open water bodies in the city were highly contaminated in terms of bacteriological results. This reveals that the bacteria were present in shallow as well as deeper aquifers due to percolation of municipal sewage and poor sanitary conditions. Among metals, iron concentration was found to be significant in the groundwater of city including both water fields. Other than iron, most of the heavy metals were found below standard and detection limit. Iron concentrations during post monsoon samples were within permissible limit due to recharge and dilution. During pre monsoon samples, iron concentration was within limits in the water fields and found beyond permissible limits in some of the city samples.
GIS based individual water quality surfaces were pre-
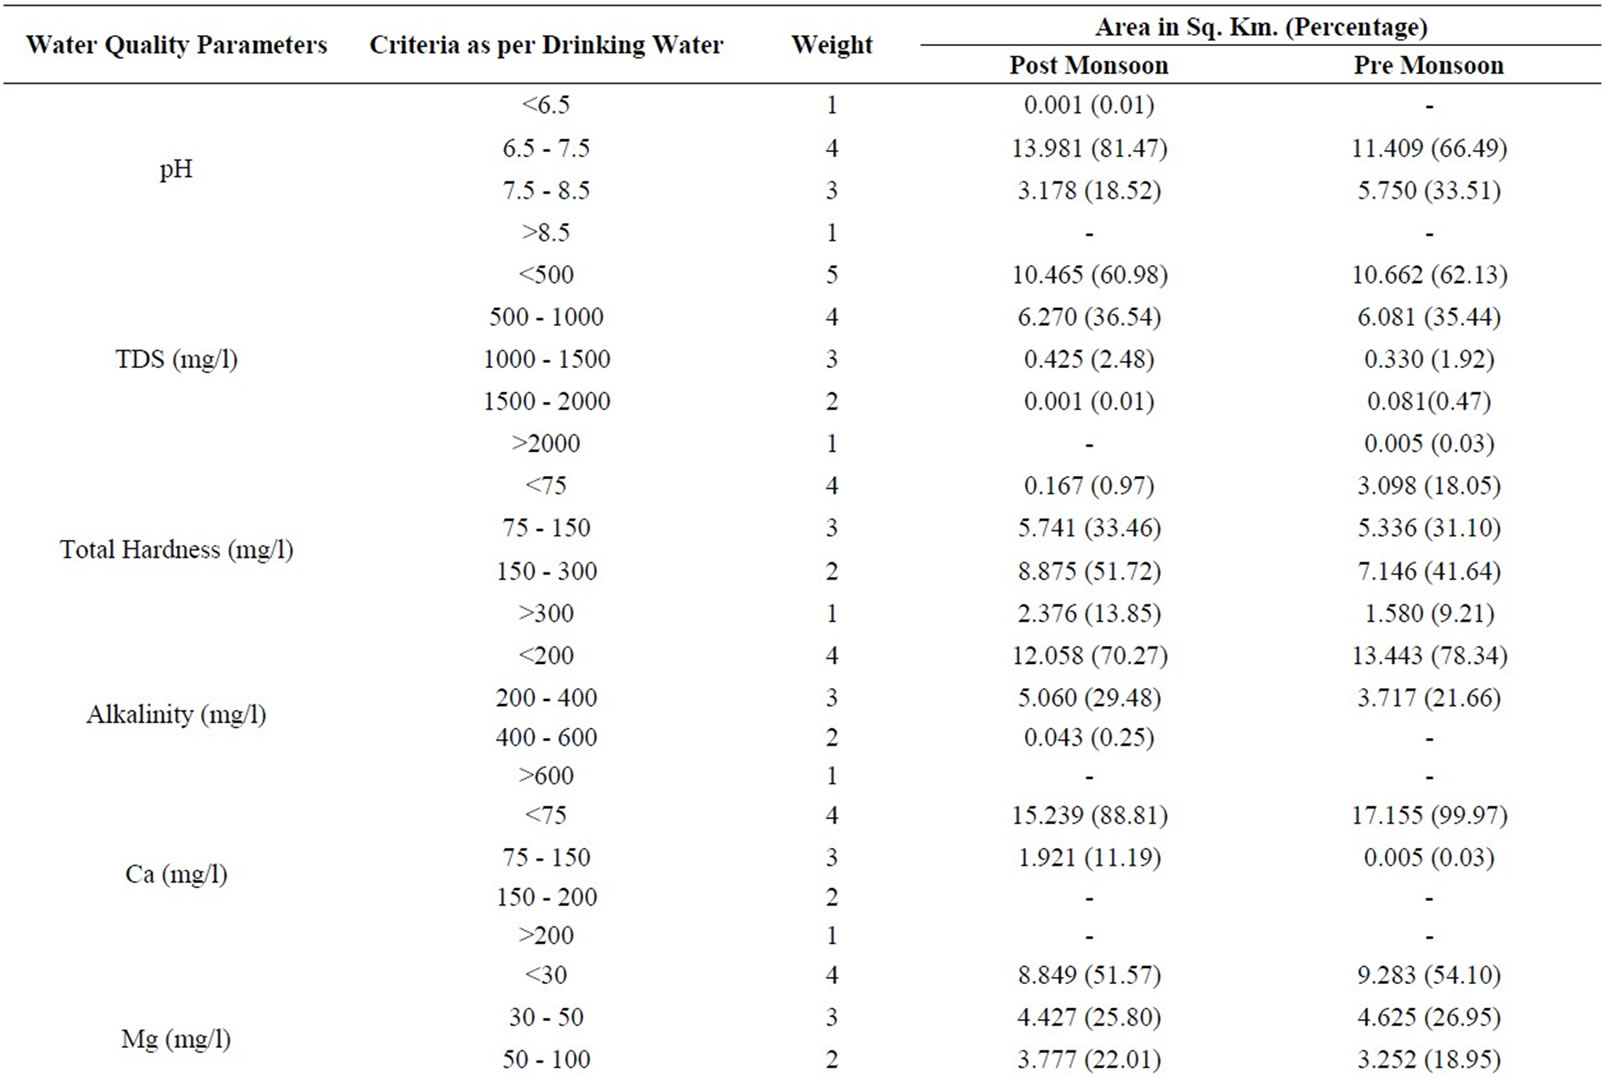
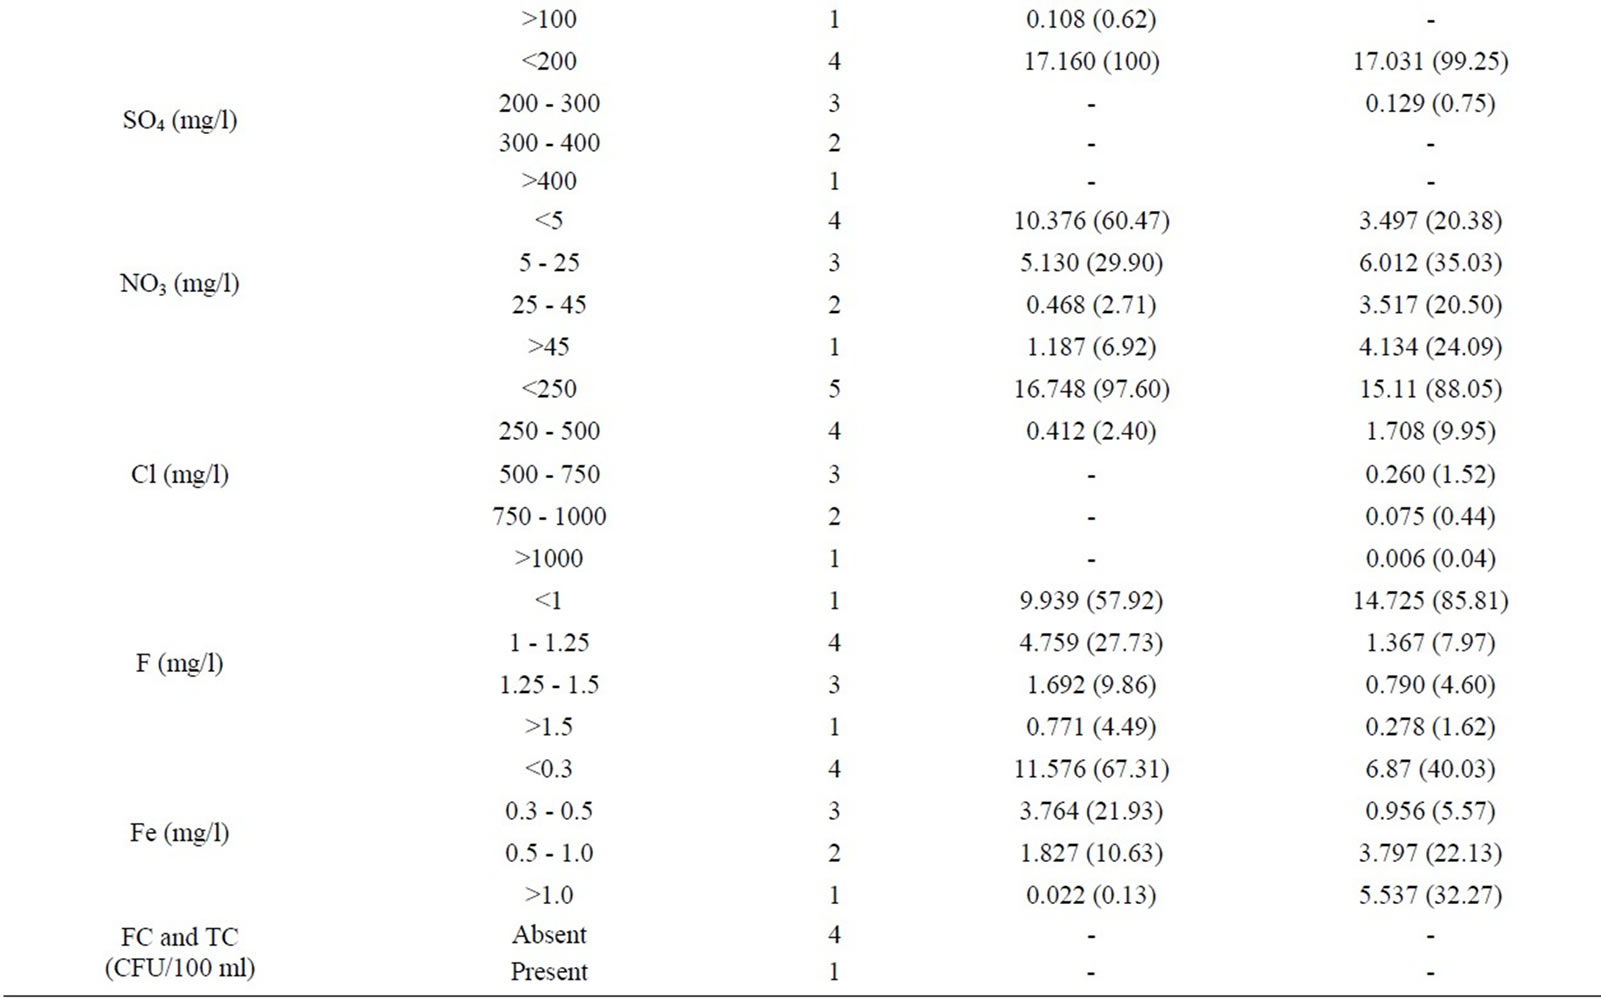
Table 1. Weights and area under different class of water quality parameters.
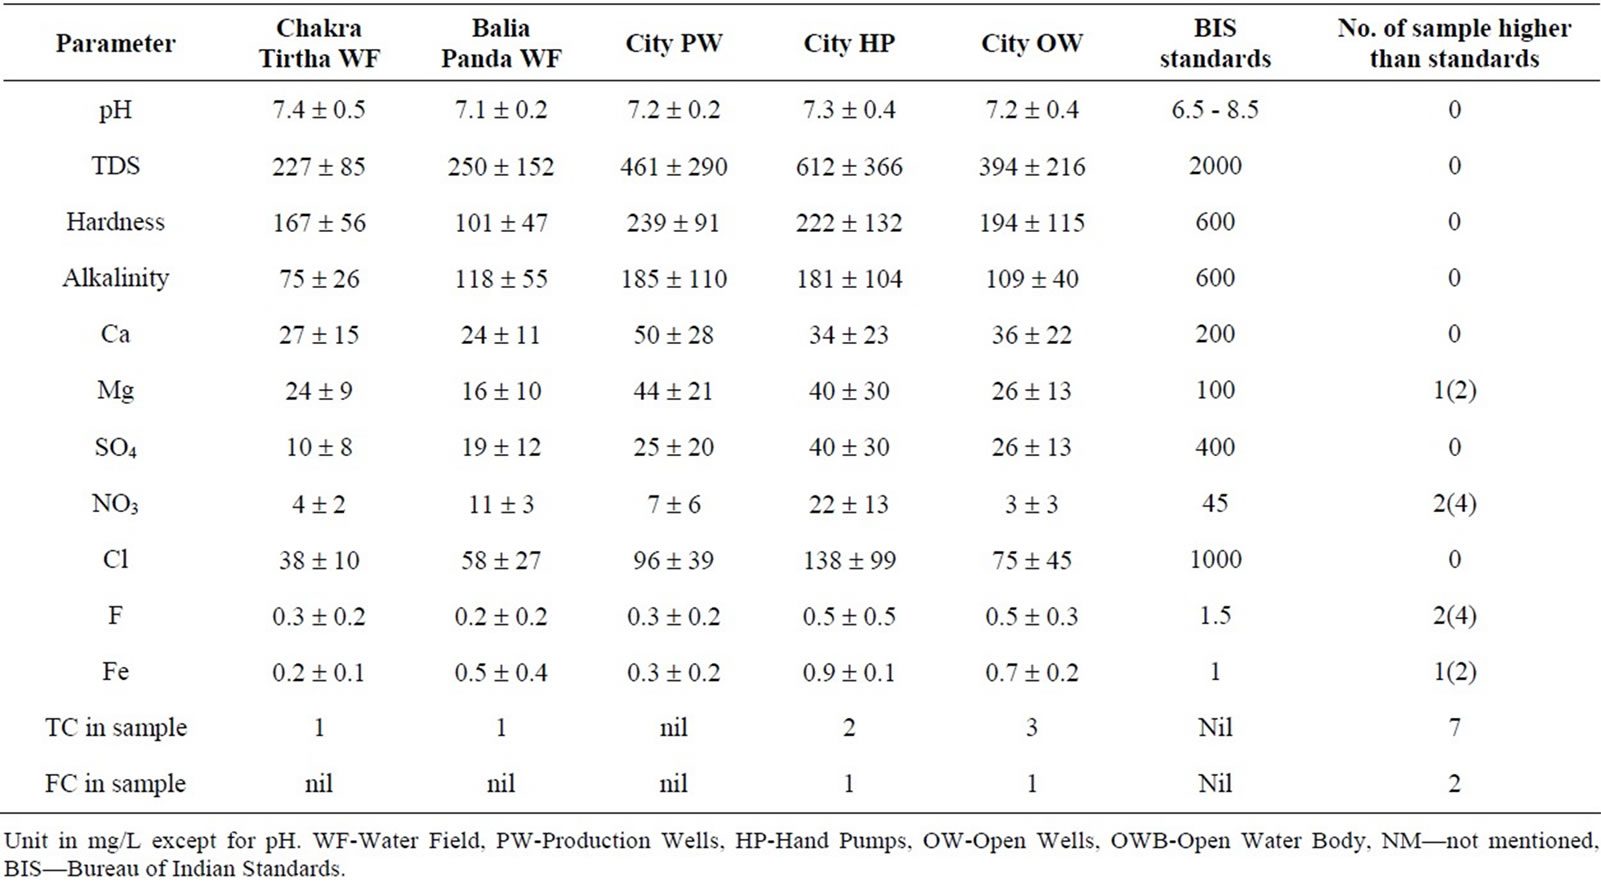
Table 2. Groundwater Quality in specific areas (Post Monsoon).
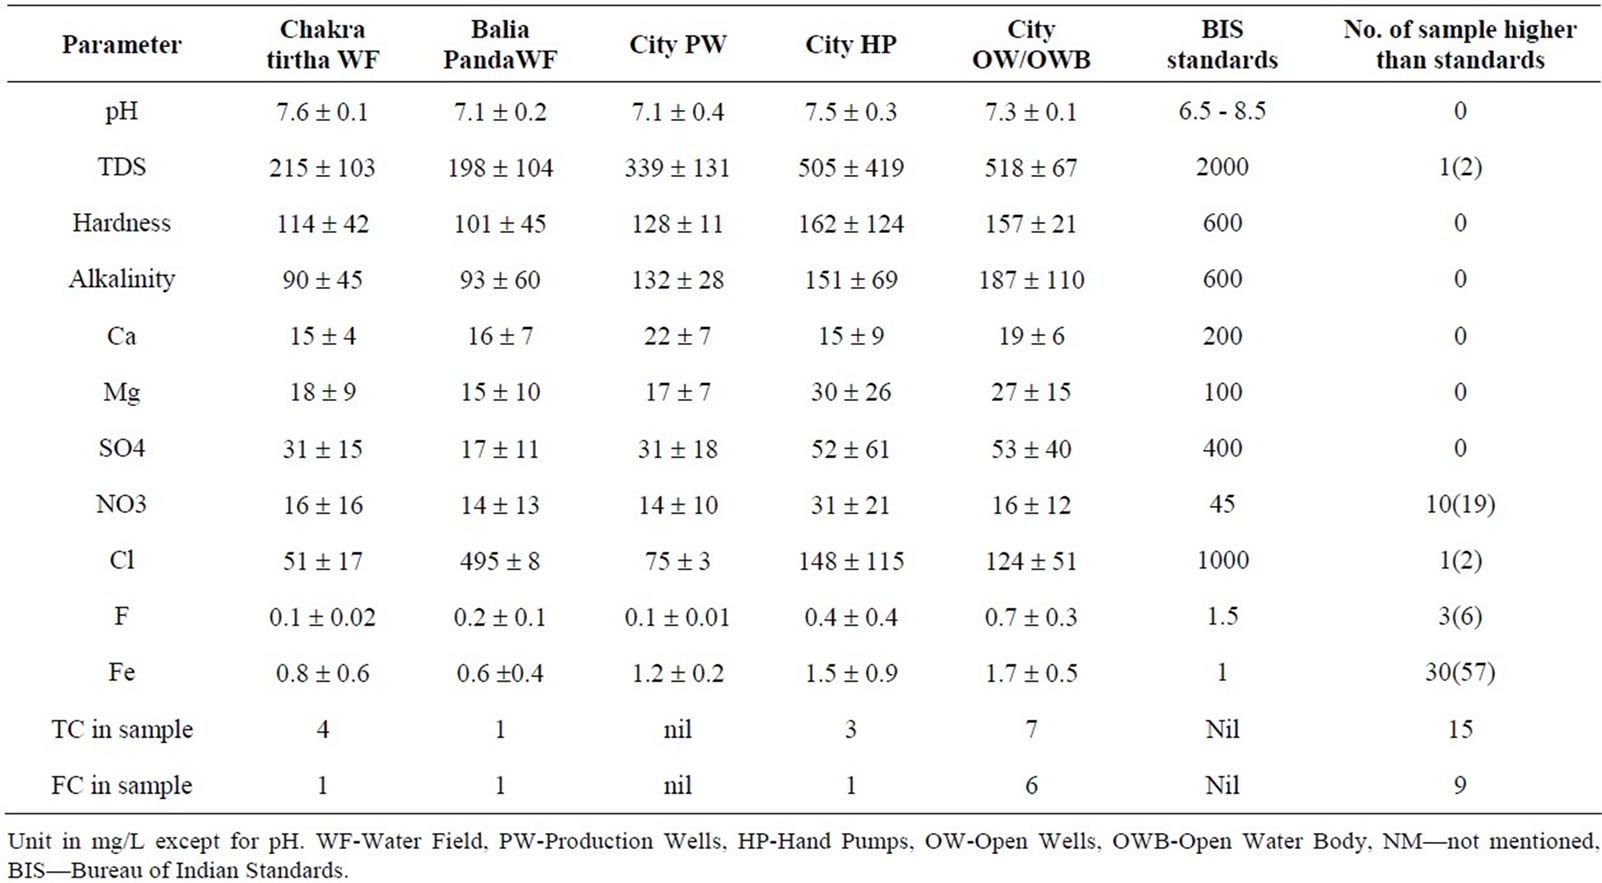
Table 3. Groundwater quality in specific areas (Pre Monsoon).
pared and reclassed for both post and pre monsoon seasons based on the desirable and permissible limits of drinking water standards.
Weights were assigned to the reclassed surface as per Table 1. This procedure was repeated for all the individual water quality surfaces to assess its spatial distribution (Table 1). Based on the spatial distribution of nitrate, 6.92% of city area during post monsoon and 24.09% area during pre monsoon were not suitable for drinking water production. The same procedure was followed to other water quality parameters which are critical for drinking and their respective areas during post and pre monsoon (Table 1).
To get an impression of the total water quality status, weighted index overlay analysis was carried out. In this analysis, all the weighted assigned water quality layers were overlaid and integrated by adding their individual weights. Based on the added weights, the groundwater quality zones were identified and classified as suitable, moderately suitable and unsuitable for domestic purpose.
The spatial distributions of groundwater quality potential zones under post and pre monsoon are illustrated in Figure 2 and Figure 3 respectively. The range of added weights indicated that the sum of the weights due to water quality parameters was less in pre monsoon (33 - 49) compared to post monsoon (37 - 51). The criteria for classification of groundwater quality zones into suitable, moderately suitable and unsuitable was defined as weights more than 44, between 39 to 44 and less than 39 respectively. Based on groundwater quality zones, suitable area was larger in post monsoon (73.22%) as compared to pre monsoon (46.93%) due to dilution, while unsuitable area was more in pre monsoon (21.14%) as compared to post monsoon (around 1%) due to anthropogenic activities.
LULC of the city is dominated by built up followed by vegetation, open land, grass land, beach, encroachment/slums and water bodies which covers percentage of area 37.77, 33.04, 13.95, 7.38, 3.15, 2.44 and 2.27 respectively (Figure 4). Built up is major LULC of the city and due to poor sanitary conditions and anthropogenic activities, groundwater quality is deteriorating significantly in the city area as compared to water fields [17]. There is good extent of open land exist towards the north - eastern and south western side of the city which covers both the Chakratirtha and Balia Pand water fields. These water fields facilitate the recharge of groundwater during monsoon periods and also provide the water supply to city through production wells. The slum is found as one of the LULC practices in the city and major portion is occupied in and around both the water fields. Due to unhygienic activities in slums, the groundwater quality is deteriorating in some of the patches which may increase significantly in future. The groundwater samples from these areas show the presence of TC and FC. Vegetation is also dominating land use land cover in the area andmost of the part is lying with suitable groundwater quality in both the scenarios. A long narrow strip beach extending along south west and north east direction is considered as the transitional zone of sweet and saline water.
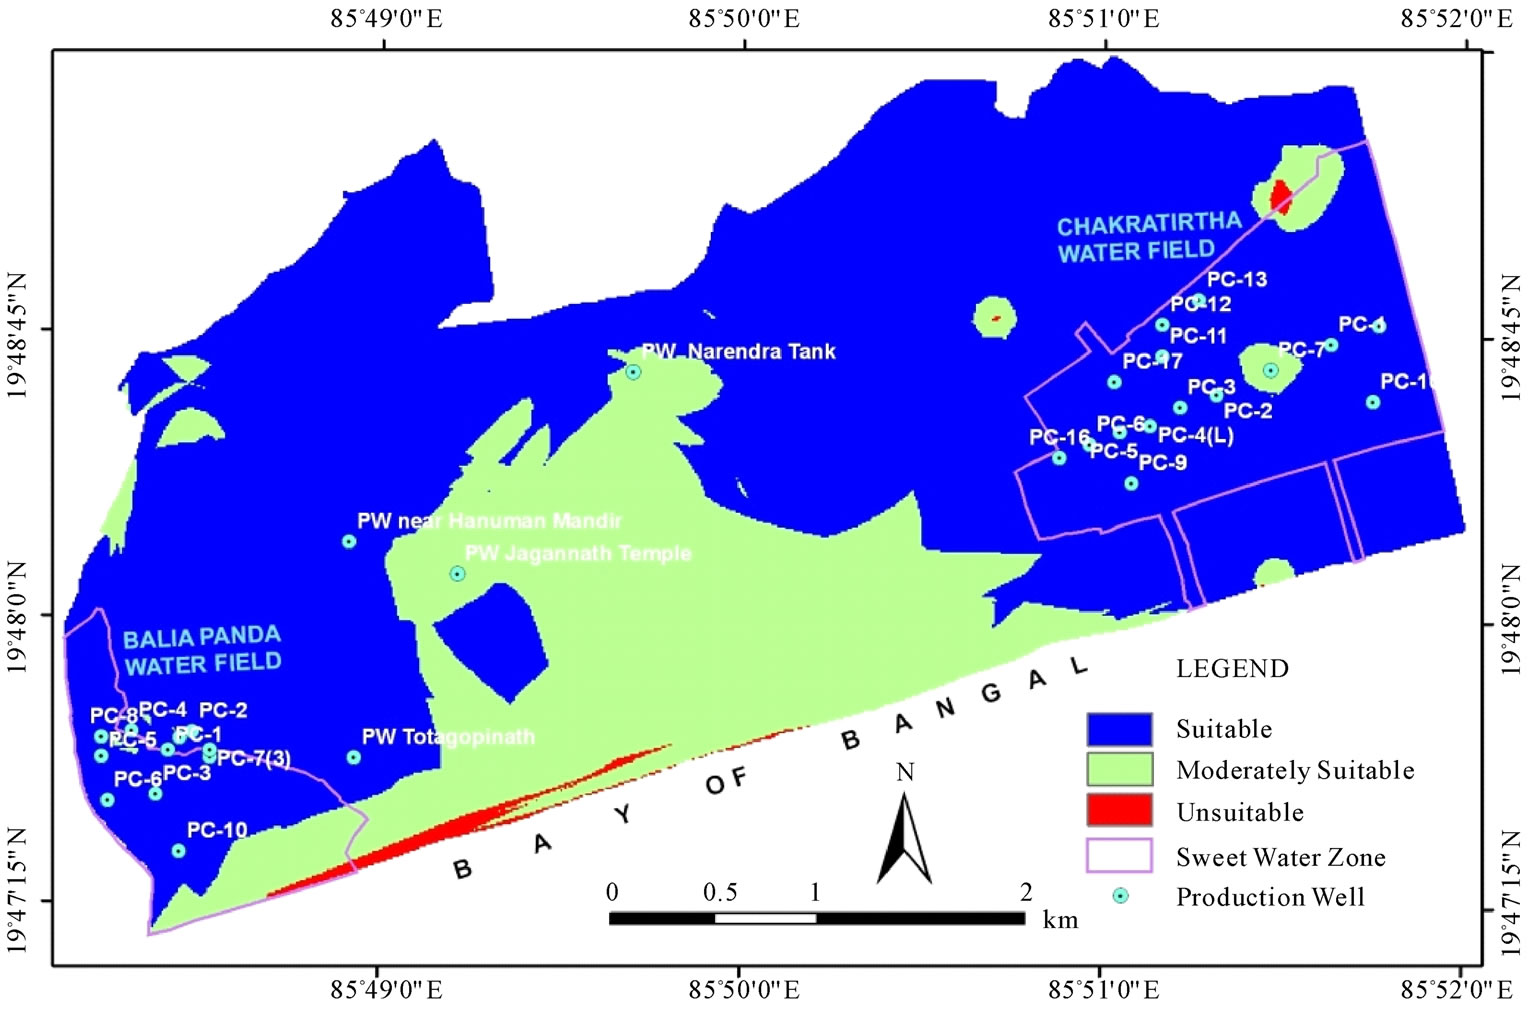
Figure 2. Potential groundwater zones for drinking water production (Post Monsoon).
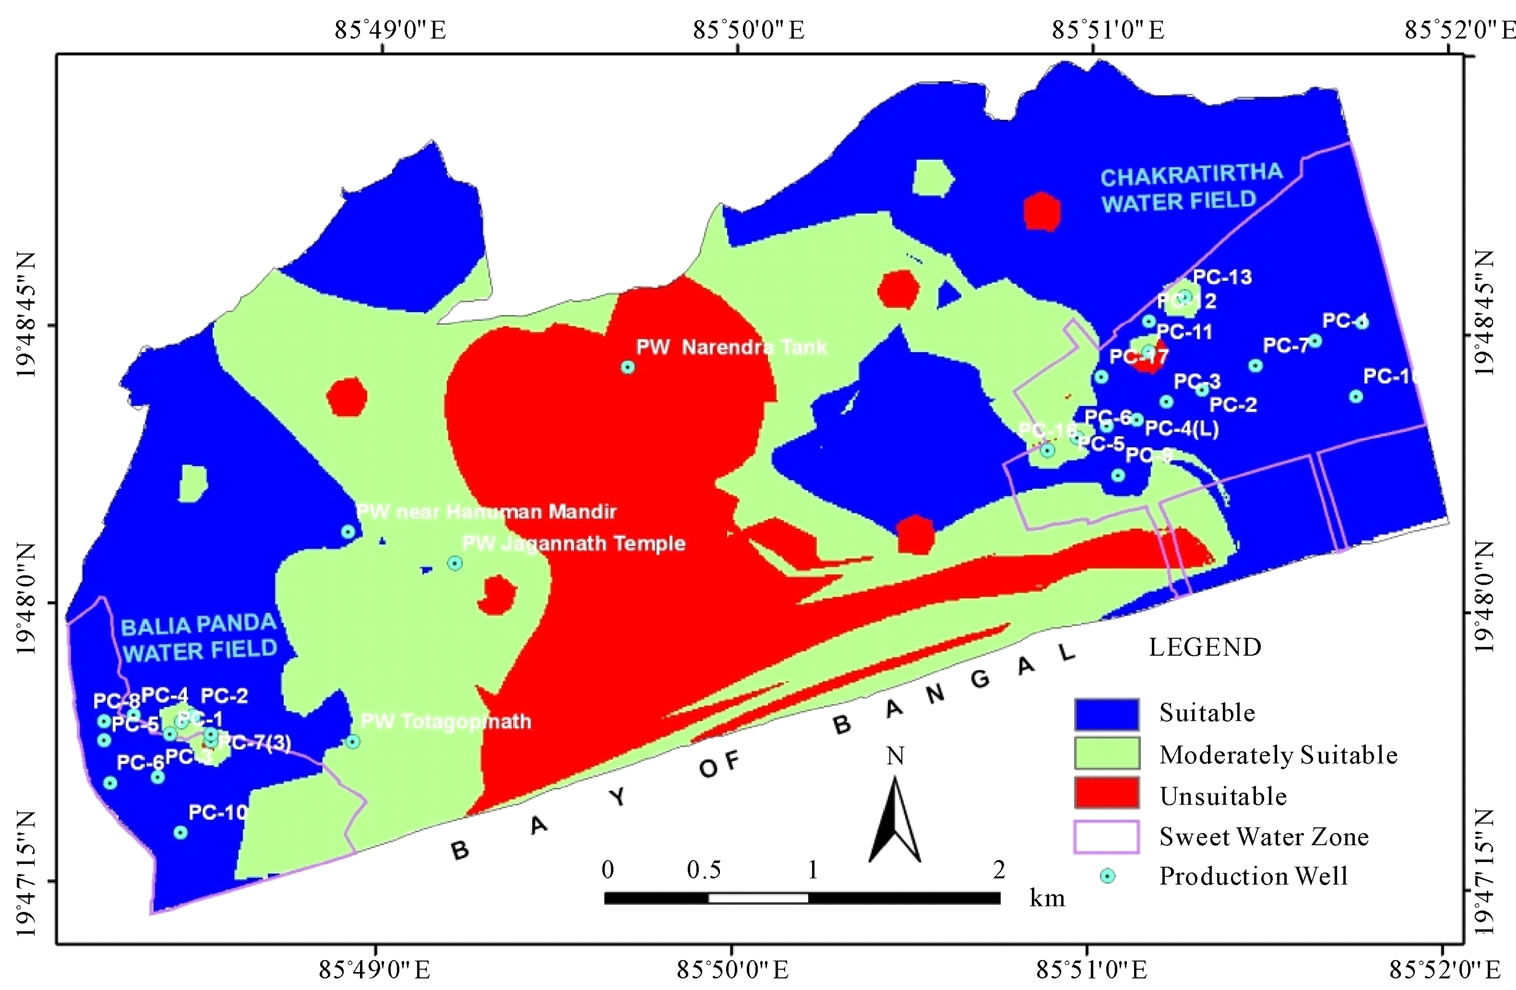
Figure 3. Potential groundwater zones for drinking water production (Pre Monsoon).
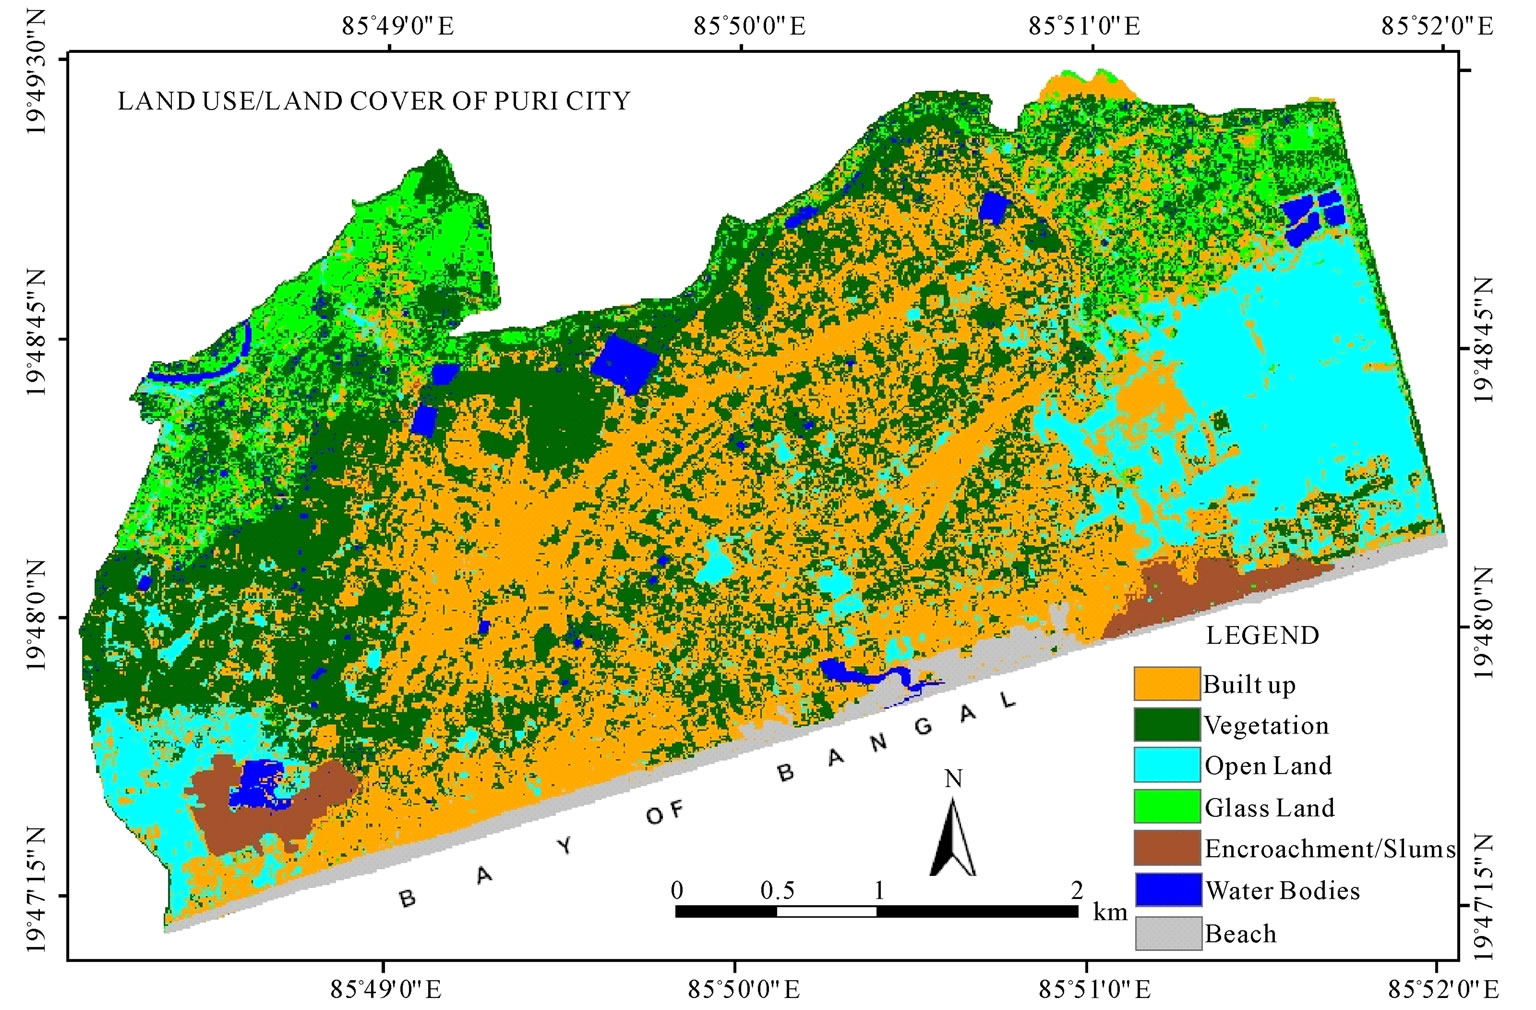
Figure 4. Land use land cover of the city.
5. Conclusions and Suggestions
Based on physico-chemical and bacteriological analysis of groundwater, geospatial techniques were applied to identify and assess the groundwater potential zones for drinking water production. The quality zones were categorized into suitable, moderately suitable and unsuitable. The spatial distribution shows that the percentage of suitable zones for drinking water production was higher in post monsoon as compared to pre monsoon due to high recharge and dilution of contaminants during monsoon and post monsoon. Groundwater quality zones indicated poor water quality in the city area due to dense habitation and anthropogenic activities. This extends the moderately suitable and unsuitable zones towards the well fields of Chakratirtha and Balia Panda. In addition to that the presence of FC and TC observed in some of the production wells of water fields, hence the water supply must be disinfected to minimize the health risk.
As a result, both the water fields require protection from the anthropogenic activities to prevent further groundwater contamination. Since sewerage system of the city is under construction, full-scale wastewater collection and treatment of municipal sewage as well ass organized waste dumping will help in improving groundwater quality of the city. Steps should be taken immediately to stop practicing of digging private soak pits, open defecation, contaminated water pools etc. The methodology can be applied in other regions in combination to geospatial techniques and groundwater quality data to assess and identify potential zones for different purposes.
6. Acknowledgements
The present study is a part of research project funded by OWSSB, Bhubaneshwar. Authors are thankful to Director, NEERI for providing encouragement and necessary infrastructural support. Also the contribution of Dr. P. R. Pujari, Scientist, Mr. R P Sahu, Ms. Priya Sontakke, Ms. Suvarna Deshmukh Project Assistants and Mr. Nandababu (OWSSB, Bhubanshwar) are also acknowledged for field support during samplings.
REFERENCES
- S. Yammani, “Groundwater Quality Suitable Zones Identification: Application of GIS, Chittoor Ara, Andhra Pradesh, India,” Environmental Geology, Vol. 53, No. 1, 2007, pp. 201-210. doi:10.1007/s00254-006-0634-1
- N. J. P. Rai and H. C. Sharma, “Bacterial Contamination of Groundwater in Rural Areas of Northwest Uttar Pradesh,” Indian Journal of Environmental Health, Vol. 27, No. 1, 1995, pp. 37-41.
- M. Shashikanth, K. Vijaykumar, M. Rajeshkhar and B. Vasanthkumar, “Chemistry of groundwater in Gulbarga district, Karnataka, India,” Environmental Monitoring and Assessment, Vol. 136, No. 1-3, 2008, pp. 347-354.
- R. C. Bridget and C. R. Reedy, “Impacts of Land Use and Land Cover Change on Groundwater Recharge and Quality in the Southwestern US,” Global Change Biology, Vol. 11, No. 10, 2005, pp. 1577-1593. doi:10.1111/j.1365-2486.2005.01026.x
- D. M. Kumar and T. Shah, “Groundwater contamination: The emerging challenge,” The Hindu Survey of the Environment, 2004, pp. 7-9, 11-12.
- M. de A. Eunice, A. Q. P. Helba, H. S. Ivam, A. de O. L. Raimundo and J. G. Maria, “Land Use Effects in Groundwater Composition of an Alluvial Aquifer (Trussu River, Brazil) by Multivariate Techniques,” Environmental Research, Vol. 106, No. 2, 2008, pp. 170-177. doi:10.1016/j.envres.2007.10.008
- L. W. Canter, “Nitrates in groundwater,” Lewis Publishers, Baca Raton, 1996.
- E. Gimenez and I. Morell, “Hydrogeochemical analysis of salinization processes in the coastal aquifer of Oropesa (Castellon, Spain),” Environmental Geology, Vol. 29, No. 1-2, 1997, pp. 118-131.
- A. P. Barker, R. J. Newton and S. H. Bottrell, “Processes affecting groundwater chemistry in a zone of saline intrusion into an urban sandstone aquifer,” Applied Geochemistry, Vol. 13, No. 6, 1998, pp. 735-749. doi:10.1016/S0883-2927(98)00006-7
- J. V. Cruz and M. O. Silva, “Groundwater salinization in Pico island (Azores, Portugal): origin and mechanisms,” Environmental Geology, Vol. 39, No. 10, 2000, pp. 1181-1189. doi:10.1007/s002540000109
- R. Vijay, P. Khobragade and P. K. Mohapatra, “Assessment of groundwater quality in Puri city, India: An impact of anthropogenic activities,” Environmental Monitoring and Assessment, Vol. 177, No. 1-4, 2011, pp. 409-418. doi:10.1007/s10661-010-1643-9
- “Note of groundwater resources and development potential of Puri District, Orissa,” Central Ground Water Board, Ministry of Water Resources, Bhubaneswar, 2004.
- “Standard Methods for the Examination of Water and Wastewater,” American Public Health Association, American Water Works Association, Water Environment Federation, New York, 1998.
- C. N. Sawyer, P. L. McCarty and G. F. Parking, “Chemistry for Environmental Engineering,” 4th Edition, McGraw Hill, New York, 1994.
- BIS 10500, “Drinking Water Standard,” New Delhi, 1991. http://bis.org.in/bis/html/10500.html
- C. G. Bonham, “Geographical Information Systems for Geoscientists: Modelling with GIS,” Pergamon Press, Oxford, 1994.
- R. Vijay, S. S. Ramya, P. R. Pujari and P. K. Mohapatra, “Spatio-temporal assessment of groundwater level and quality in urban coastal city Puri, India,” Water Science and Technology, In press.