Journal of Water Resource and Protection
Vol.2 No.4(2010), Article ID:1688,7 pages DOI:10.4236/jwarp.2010.24043
The Effect of the Land Use/Cover Changes on the Floods of the Madarsu Basin of Northeastern Iran
1Science and Research Center, Islamic Azad University, Tehran, Iran.
2Center of Excellence for Spatial Analysis of Environmental Hazards, Department of Geography, Tarbiat Moallem University, Tehran, Iran.
3Department of Physical Geography, Faculty of Geography, Tehran University, Tehran, Iran.
E-mail: alijani@tmu.ac.ir
Received December 25, 2009; revised January 22, 2010; accepted February 1, 2010
Keywords: Land-use/cover, Destructive flooding, Madarsu Bain Floods, Gorgan river floods, Remote Sensing and river floods, Floods in Iran
ABSTRACT
In order to understand the effect of the land use/cover change on the hydrologic regime of the Madarsu Basin in Golestan province of Iran, we selected the two floods of June 1964 and June 2003 with equal amount of rainfall but different rate of runoff. For these floods the closest time images of MODIS were selected. On these images we analyzed the land use/cover types and calculated their area and change rate between two floods. We also calculated the Curve Number (CN) for each land use/cover type according to the US Soil Conservation System (SCS) model. The results showed that: the intensity of the peak floods has increased from 1960 to 2002, and the natural lands of forests, rangelands, and bare lands have been decreased from 1960 to 2002. While the agricultural lands showed increase during the same period. The CN value has also increased during the study period causing the decrease of moisture retention capacity of the soil. As a result, despite the equal rainfall, the discharge rate of 2003 flood was about 10 times larger than that of the 1964 flood, which is the direct effect of the land use/cover change from the stable forests and rangelands to the unstable agricultural lands on the both soil moisture retention capacity and run off rate.
1. Introduction
The increase of human population and standards of living demand more harvest and production from the earth resources, especially the land resources. In most societies it is not easy to increase the per unit production rate and as a result, to meet the needs, the arable lands are increased at the expense of the natural land cover. The land cover or the natural resources are the part of the equilibrium state ecosystems. The destruction of this steady state causes many problems such as soil erosion and increase of the surface run off. One example of this process is happening in the Madarsu Basin of Gorgan river in the northern slopes of the Alborz mountains in Iran. Here, local farmers are always transforming the forest areas into the agricultural lands (Figure 1).
This process has decreases the soil moisture retention capacity, resulting in more surface run off and hence more sudden torrential floods. For example, the August 2001 flood of this Basin caused about 300 human casualties and about 60 million dollars of economic losses. The monitoring center of natural disasters of Iran, rated this flood as the first flood of the country in terms of the human casualties, and 15th one in terms of the economic losses [1]. According to most researchers the main reason for this torrential destructive flood is the destruction of the upstream land cover. Sadeghi [2] showed thatin the Kasilian Basin (Mazandaran province) the reduction of the forest lands increased the run off coefficient from 10 to 15 percent. The same result was indicated in the Neka river hydrographs during the deforestation activities of 1967-2000 period [3] and after the forest cuttings in the Gilan province of the country [4]. Many researches (such as [5-7]) have concluded that these floods are resulted from factors such as the human intervention in the natural hydrologic cycle, destruction of vegetation of the river basins, and expansion of impermeable surfaces through the urbanization processes.
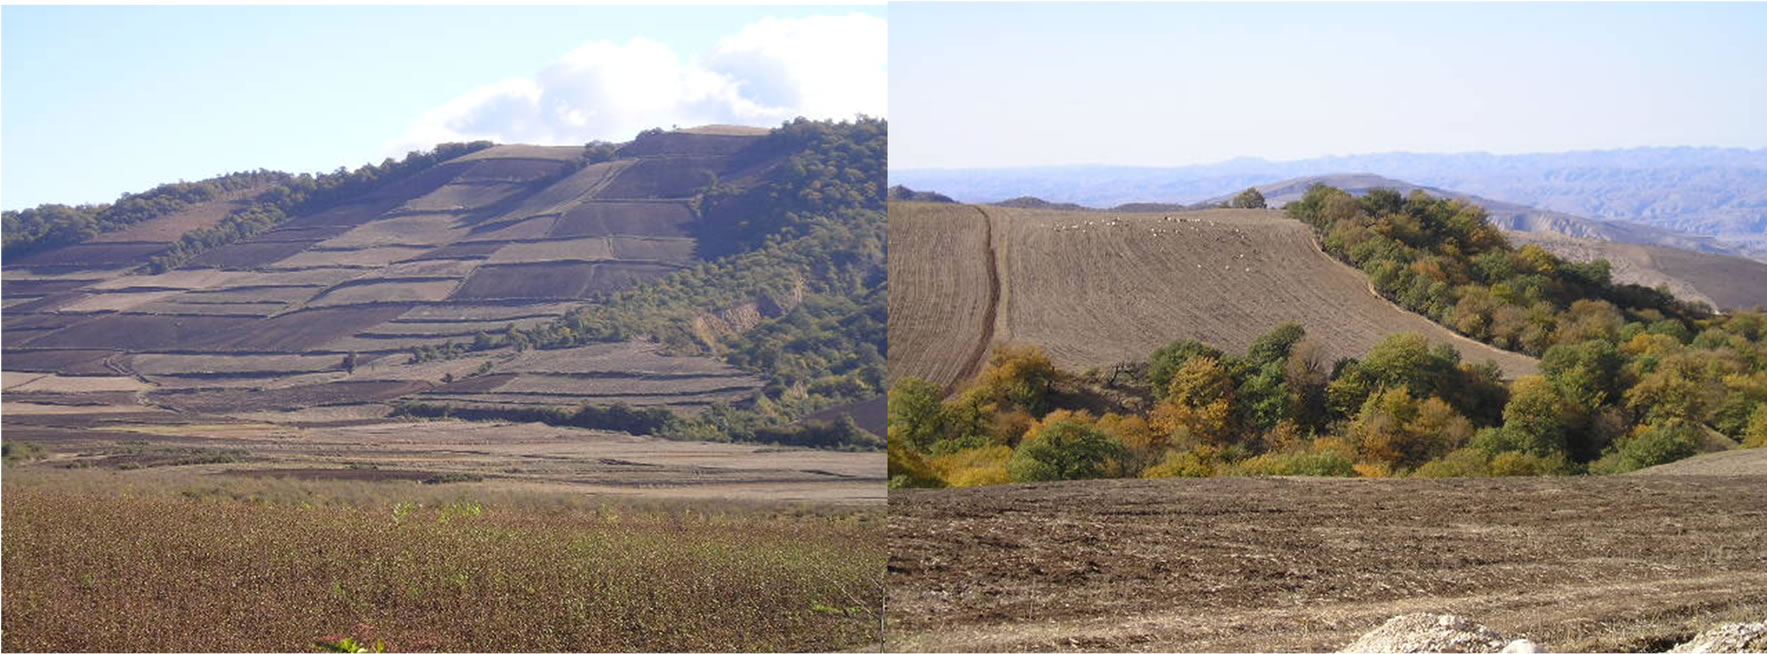
Figure 1. The continuous transfer of forested slopes into rain-fed agricultural lands in the Madarsu Basin.
As the result of these processes, as Khosrovshahi [8] has stated, the destructive floods have increased ten times since 50 years ago. The same findings are stated elsewhere in the world ([9-13]). During the last decades the natural cover of the land, especially the forest lands, has decreased all over Iran [3]. As a result, the torrential floods increased during the past 50 years.
Researchers have used different methods to evaluate the relation between the land use/cover types and the run off changes. Deroo and his colleagues [14] utilized a simple linear precipitation—run off model to study the effects of the land use/cover changes on the floods of Muse and Oder Basins. But Shrestha, [15] believed that the relation between precipitation and run off is non linear. Therefore, he used the ANN (Artificial Neural Network) model to analyze the relation between the rainfall and the run off in the Katmandu Basin in Nepal. His study demonstrated the effectiveness of this model and GIS (Geographic Information System) and RS (Remote Sensing) techniques in the hydrological researches.
Some researchers have used remote sensing techniques such as MODIS (Moderate Resolution Imaging Spectroradiometer) images and got more reliable results [16]. Vandersande, et al. [17] compared the images of IKONOS-2 (an earth observation satellite) with the images of EU CORINE (European Union Coordination of Information on the Environment) in the LISFLODD-FP (A two-dimensional hydrodynamic model, specifically designed to simulate floodplain inundation in a computationally efficient manner over complex topography.) hydrologic model for flood simulations and realized that the IKONOS-2 images were more precise than the others.
The expansion of the urban built areas is one of the main reasons for reduction of permeable lands which increases the surface floods. Noorazuan and his coworkers [18] indicated this process in the Langat River Basin in Malaysia. Through the use of GIS techniques they realized that in the urban areas the river discharge has increased.
Researches in different fields have so far confirmed the ability and precision of remote sensing techniques in analyzing and mapping the land use patterns, which is a corner stone for all land use studies. This research has used the accurate and effective remote sensing techniques to study the effect of the land use/cover patterns on the floods of the Madarsu Basin of Gorgan river .
2. Data and Methodology
The Madarsu Basin with 2364 square kilometers area is one of the main watersheds of the Golestan dam constructed over the Gorgan river (Figure 2). The Basin extends from 55º21´E to 56º28´ E and from 3º58´ N to 37º30´ N. Mean annual rainfall of the Basin is computed about 254 millimeters with high spatial and temporal variations. Spring is the wettest season with April experiencing the highest monthly rainfall. While summer is the driest season of the year. Mean annual temperature is 15℃ with the annual range of 2.9℃ to 21℃. The dominant flora of the Basin is Artemisia with varying biomes of herbs and trees. Most of the northwestern parts are dominated by Junipers. The hydrologic system of the Basin is much more variable than its rainfall. This is obvious from the annual peak discharges of the Basin (Figure 3). The annual peaks vary from 1 m3/s to 1650 m3/s . Some of these floods were very destructive such as the flood of August 2001. The floods of 2002 and 2005 were also destructive and caused about 28 to 60 million dollars of property damage and more than 40 human casualties. As is clear from Figure 3, the intensity of these peak discharges has increased during the study period and the torrential floods became frequent in recent years, the fact that supports the objective of this research.
In order to investigate the impact of the land use/cover changes on the stream discharge in the Madarsu Basin, we tried to find floods which had equal rain but different discharges. Because, our objective is to understand the impact of the land use/cover change. Thus, selecting floods with equal rainfall will automatically eliminate the effect of the rainfall variations. For this reason we analyzed the daily rainfall and discharge rates of Tangrah (Figure 2) discharge station during the 1960-2007 period. Floods were determined as those days whose discharge showed a remarkable shock or abnormal increase. Accordingly, the isolated floods of June 6, 1964 and June 9, 2003 with relatively equal rainfall were selected (Tables 1 and 2).Land use/cover variations of the Basin were extracted from the satellite images. These images were not available for the selected floods. Therefore, we tried to select the images of the closest times to these dates. As a result, one image from 1960 and another one from 2002 were selected. It should be mentioned that these time gaps will not affect the results. Because the land use/cover changes take some time to show up The images were taken from ETM (Enhanced Thematic Mapper) of LANDSAT Satellite. The identification and computation of land use/cover types from these images were accomplished by ENVI (A software used for processing and analyzing geospatial imagery) software. This is a complete software and contains most of the tools such as filters, classification, geometrical corrections, and spectral analysis. The evaluation of the land use/cover types was achieved via the class comparison method [19]. After the geometrical corrections, the images were undergone supervised and unsupervised classification.
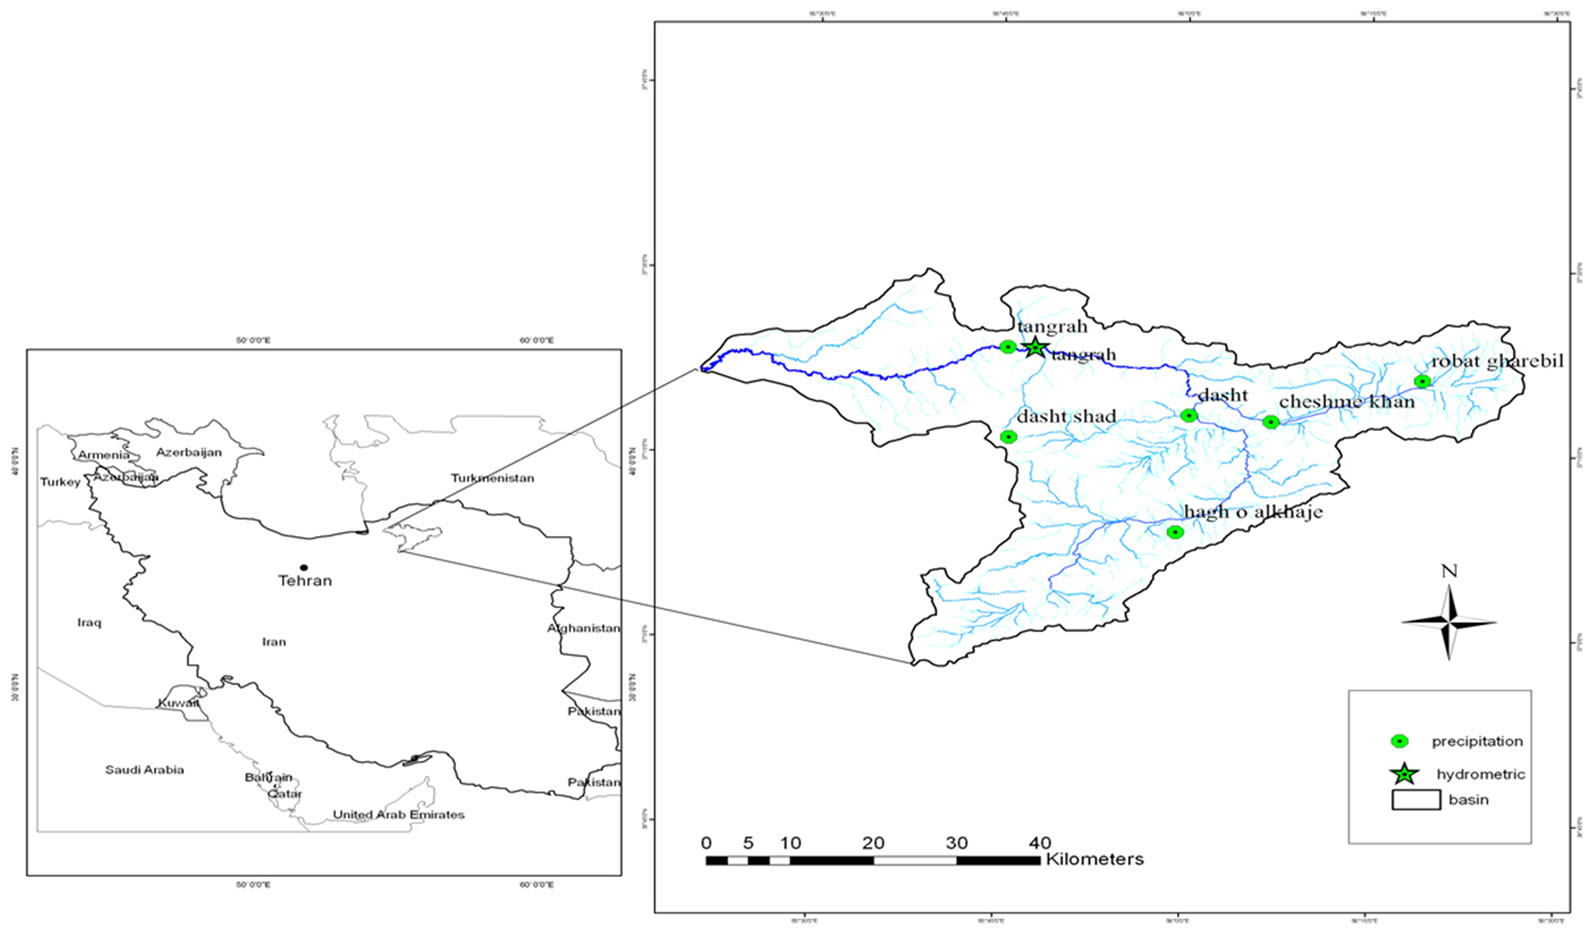
Figure 2. Locationof the study area.
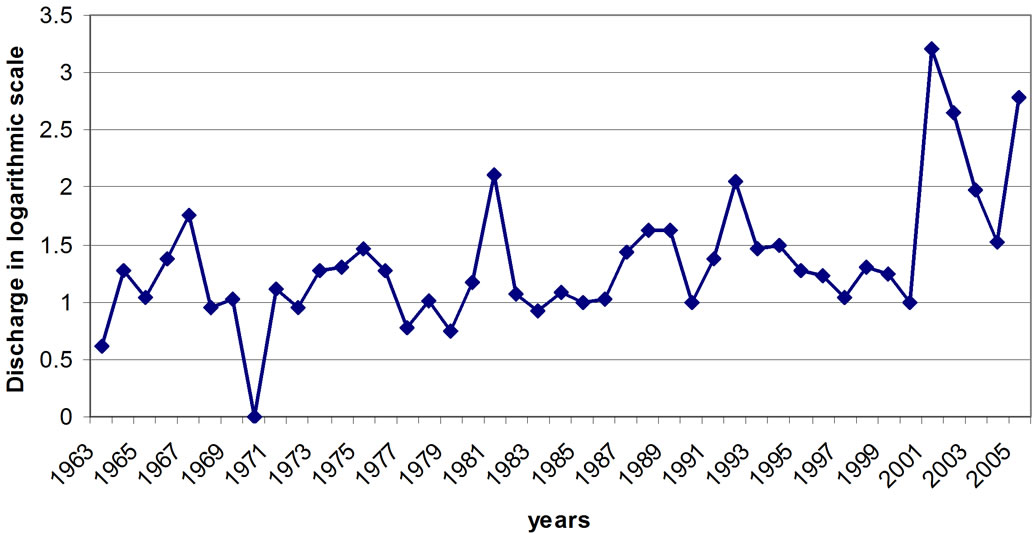
Figure 3. The time series of the annual pick floods of the study Basin.
To substantiate the effect of the land use/cover change on the Basin discharge, the Curve Number (CN) of each land use/cover type was calculated for each image. This number carries the combined effect of the soil characteristics and land use/cover of the surface. In each image the weighted CN of the Basin based on the all land use/cover types was calculated. The surface area of each land use/cover type was defined as its weight. The calculations were done according to the U.S. Soil Conservation System (SCS) procedures.
The discharge of the Basin during each flood was analyzed and its amount in different return periods was computed from the time series of Tangrah hydrometric station discharge values.
Finally the floods of both periods were compared and analyzed in terms of intensity and damages.
3. Results and Discussion
The characteristics of both floods are shown in Table 3 and their hydrographs are drawn in Figure 3. According to Table 3, rainfall of Tangrah station was 28.3 millimeters in both floods. But the peak discharge value of the 2003 flood was 3.76 m3/s, much higher than 0.369 m3/s value of the 1964 flood. This difference is much highlighted in the hydrographs of these floods. The flood of 2003 has produced much more run off than the 1964 one. Since rainfall is equal in both floods and both are isolated in a dry period (Tables 1 and 2), it is reasonable to assume that the only controlling factor should be the variations of the land surface. As a result, we examined the surface characteristics of the Basin among which the land use/cove and soil properties are very important.
The land use/cover types of the Basin were extracted from the ETM images through the use of ENVI software (Figure 5 and Table 4). According to this figure most of the Basin was covered by forests and rangelands in 1960. Dry farming is the third category in surface area which has occupied more area in 1960 than in 2003. The irrigated farming has increased from 1960 to 2003. The land use/cover changes from 1960 to 2002 are detailed in Table 4. About 77% of the Basin was occupied by forests and rangelands in 1960. Rain-fed farming was about 30% of the Basin. Irrigated farming had occupied a little amount (about 6.3% only) of the Basin in 1960. The Basin is totally utilized and bare lands were only 2.3% of the Basin. There seems remarkable change from 1960 to 2002 in the area of forests and range lands. Range lands were decreased about 7.7% and forest lands were cut by
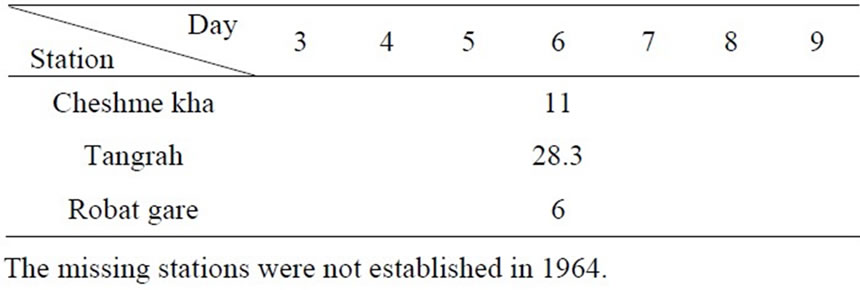
Table 1. Daily rainfall of June 1964.
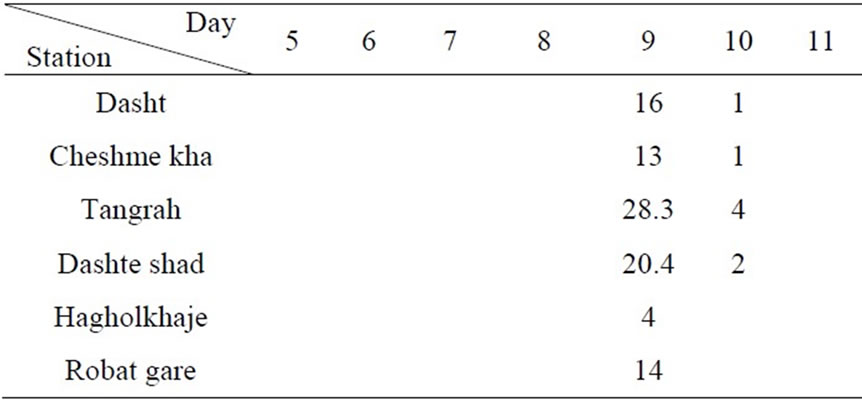
Table 2. Daily rainfall of June 2003.
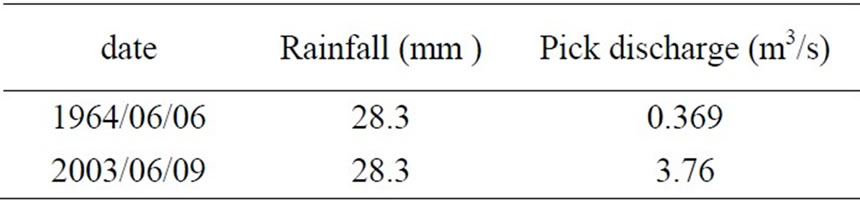
Table 3. Characteristics of the selected floods.
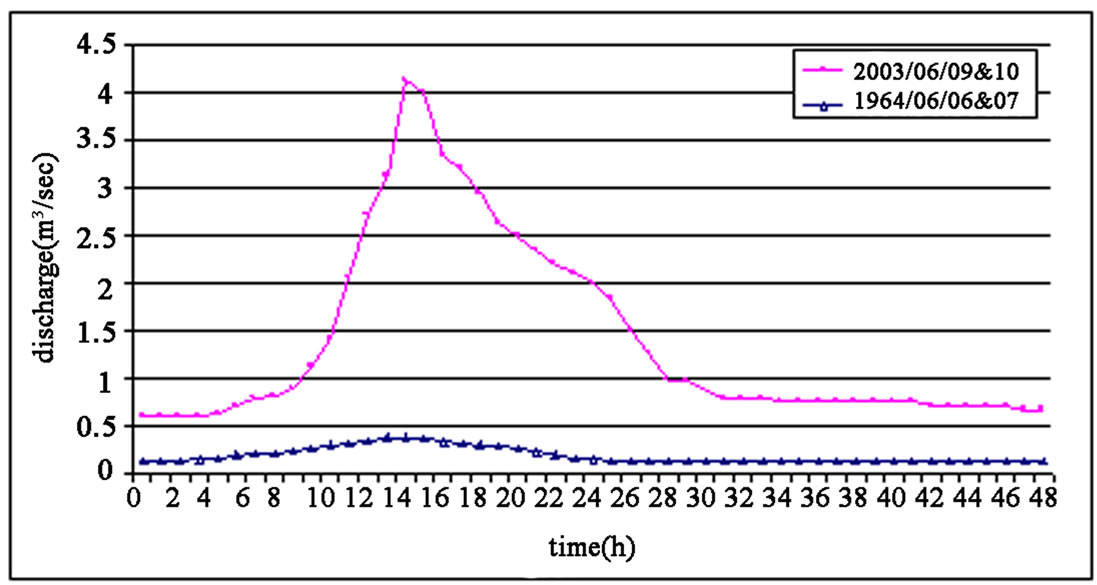
Figure 4. Hydrographs of June 1964 (blue) and June 2003(red) floods.
1.5%. Instead, in 2002 the irrigated farming was increased by 6.6% and rain-fed farming by 3.4%. In general, agricultural lands were increased by about 10% at the expense of the natural lands such as forests, bare lands, and range lands. This increase in agricultural lands is of course due to the population growth of the Basin. The Basin population was 28010 in 1960 but increased to 93141 in 2005, about 50% of which (46259) were living in the 44 villages of the flood prone areas. The annual growth rate of the population is about 1.72% [20]
In order to take into account the soil characteristics, the Curve Number (CN) of the Basin was calculated according to the different soil characteristics and land use/cover types of the Basin (Figure 6). The overall number was 66 in the 1960 image but increased to 74 in the 2000 image. As the Curve Number of the area increases its potential for flooding increases. According to Figure 6, the Number is not the same even over the same land use/cover type. For example in the range lands the Curve Number has increased from 1960 to 2000 by 10 units. This increase has happened in the parts under the cultivation in both images. Because the surface water retention capacity has decreased due to the continuous cultivation of the land. Comparison of the land use/cover maps of the two images indicate that the expansion of the agricultural lands, especially the irrigated farms, has lowered the water retention capacity of the surface causing flooding of the Basin.
Both the land use/cover change and the Curve Number increase are indications of more flooding in the Basin. The mean run off and peak discharges of the Basin increased so much during the 2003 flood. As was mentioned earlier, forests and range lands are components of the steady state in which every component acts in its complete and ideal capacity. There is no malfunctioning in the system. But when these natural sources were destroyed and changed to the agricultural lands, their tex-ture and drainage and even water retention capacity de-
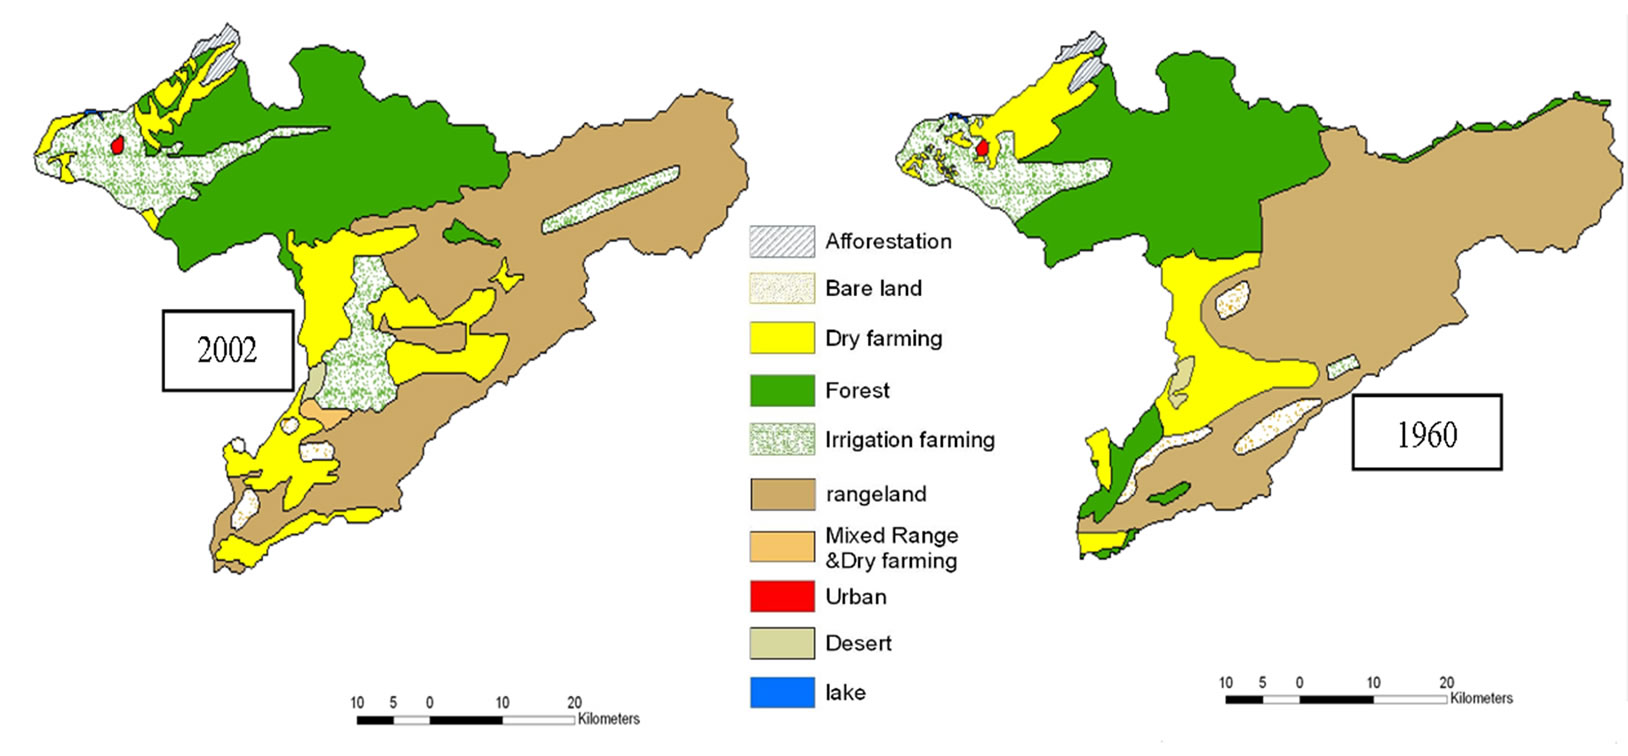
Figure 5. The land use/cover changes of Madarsu Basin in the two studied images of 1960 and 2002.
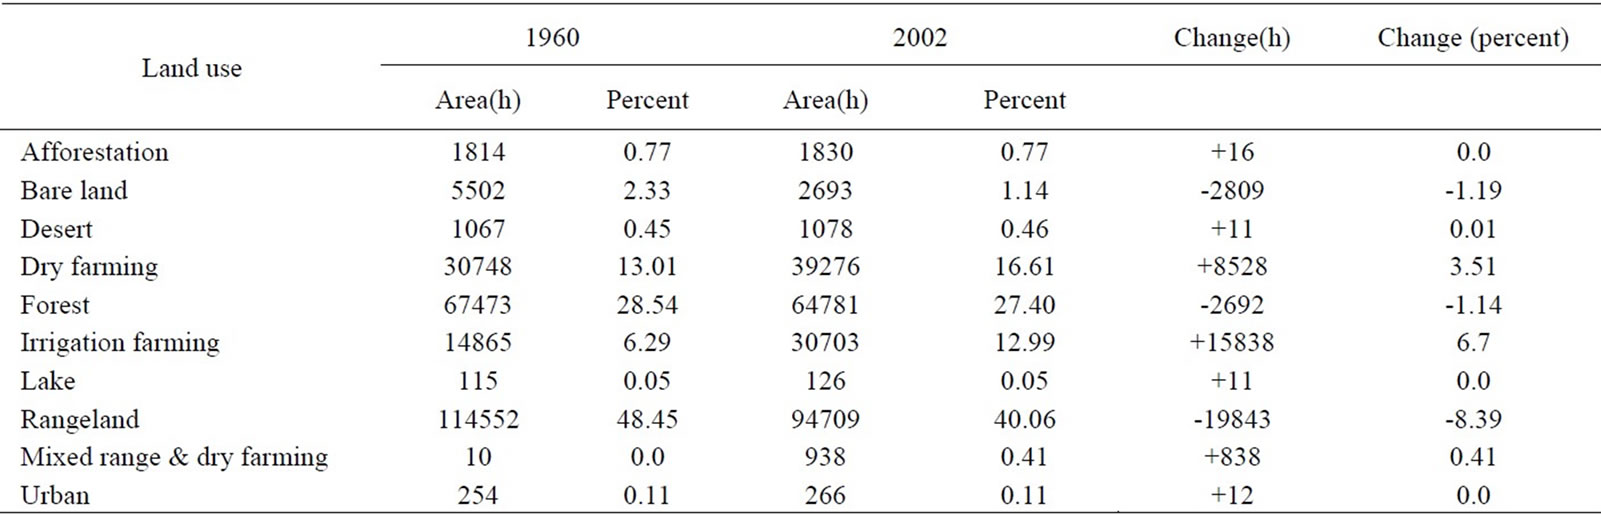
Table 4. Land use/covertypes of Madarsu Basin.
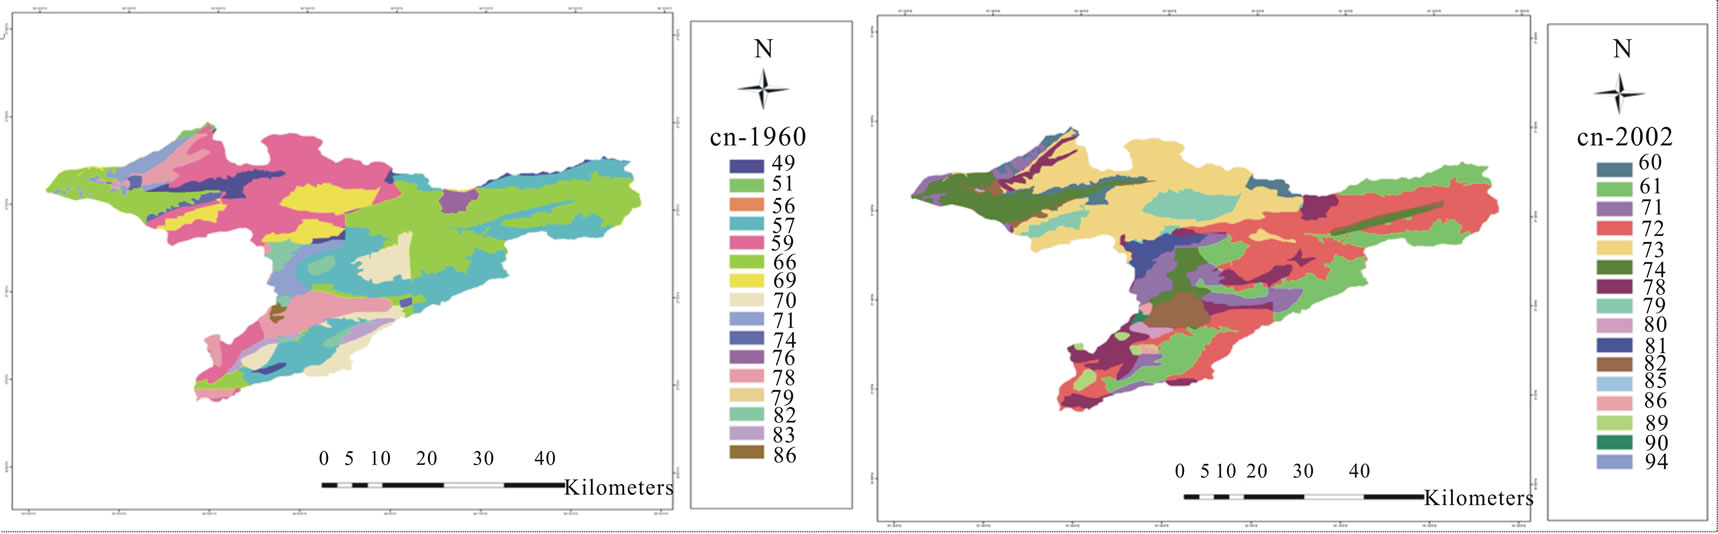
Figure 6. The Curve Number of the Madarsu Basin according to the US Soil Conservation System in the 1964 image (upper map) and 2002 image (lower map).
creased. Most of the precipitation falling on the surface turned into the surface run off and went out of the Basin. This, in turn, lowered the concentration time of the Basin. The peak discharge time reached very soon. The total period of the hydrograph decreased and all these processes caused the short duration torrential floods. According to Table 3, the peak discharge has increased 10 times from the 1964 flood to the 2003 flood. This increase has also increased the extreme amounts of the hydrologic system of the Basin, especially the peak discharge (Figure 7). That is, as the amount of rainfall or flood increased, the difference between the two floods became bigger.
4. Conclusions
The comparison of the land use/cover types of the two images of 1960 and 2002, indicated that the area of the bare lands, forest areas, and rangelands have decreased about 2809, 2692, 16843 hectares, respectively. But the

Figure 7. The amount of peak discharges of both studied floods of the Madarsu Basin in different return periods.
surface area of the dry farming and irrigated farming h ave increased about 8519 and 15838 hectares respectively. It seems that most of the land use/cover change has happened into the farming lands due to the increase in the population of the Basin. And most of this change has occurred in the areas where the rate of runoff is higher. On the other hand, the higher rate of grazing has put much pressure on the rangelands and has decreased their fertility. All of these factors have increased the erosion capacity and runoff intensity of the Basin. The decrease of vegetation intensity due to the grazing has also increased the runoff capacity of the Basin. As a result of these processes, the Curve Number has increased about 12% during the study period. According to Figure 7 the runoff rate has increased exponentially rather than linearly. That is, the higher values have increased more than the lower values. Thus, the continuation of the land use/cover change is becoming a serious threat to the Basin. This should be considered by the development planners of the Basin. The land use/cover change should be controlled in the vulnerable regions and some measures should be taken for the stabilization of the soil and vegetation cover. The comparison of the two hydrographs and the change in the land use/cover types highlighted this point that the land use/cover is much more important to the natural resources management than the climatic variations. During these floods, despite the equal amount of rainfall, the 2003 flood produced ten times bigger run off than the 1964 flood. The only reason for which is the destruction of the natural resources and their transfer to the unstable farm lands, as is mentioned by others [4,5, 10] too. It is highly recommended that the natural resources managers and planners should take this finding into consideration and prevent the increasing destruction of the land sources. Otherwise, we should expect the torrential floods like the one of August 2001 more and more. In brief, this research documented the impact of the land use/cover change on the degradation of the steady state environment and demonstrated that not taking into account this power would increase the destroying agents such as torrential floods in an exponential way.
REFERENCES
- Pagheh, “Studying the Fallowing Effect in the Flood of Lankaran Basin, Garmabdsht Watershed Management,” MSc’s Thesis, University of Gorgan, Gorgan, 2003.
- H. M. Sadeghi, “Studying the Causes of the Floods and their Control in Damavand Watershed,” Journal of Forest and Pasture, Vol. 26, 1995, pp. 25-31.
- M. J. Pouraghnyaii, “The Effect of Vegetation Changes in the Flood Regime of Neka River Watershed Basin,” Master’s Thesis, University of Tehran, Tehran, 2001.
- S. Zahedi and A. Ghodrati, “The Effect of Rainfall and Forest Use on the Flooding Regime of Shfarud Basin, Gilan Province,” The 3rd regional and 1st National Conference on Climate Change, Isfahan University, Isfahan, 21-23 October 2003.
- J. K. Lorup, J. C. Refsgaard and D. Mazimavi, “Assessing the Effect of Land Use Change on Catchment Runoff by Combined Use of Statistical Test and Hydrological Modeling. Case Studies from-Zimbabwe,” Journal of Hydrology, vol. 205, 1998, pp. 147-163.
- A. Loukas, L. Vasiliades and N. R. Dalezios, “Flood Producing Mechanisms Identification in Southern British Clombia, Canada,” Journal of Hydrology, vol. 277, 2000, pp. 218-235.
- E. Tabacchi, L. Lambs, H. Guilloy, A. M. PlantyTabacchi, E. Muller and H. Decamps, “Impact of Riparian Vegetation on Hydrological Processes,” Hydrological Processes, vol. 14, No. 16-17, 2000, pp. 2959-2976.
- M. Khosroshahi, “Determining the Role Sub-Basins in the Flood Intensity of Damavand Watershed,” Master’s Thesis, University of Tarbiat Modarres, Tehran, Iran, 2001.
- R. Suwanwerakamtorn, “GIS and Hydrologic Modeling for Management of Small Watersheds,” ITC Journal, vol. 4, 1994, pp. 343-349.
- W. K. B. Elkaduwa and R. Sakthivadivel, “Use of Historical Data as a Decision Support Tool in Watershed Management: A Case Study of the Upper Nilwala Basin in Sri Lanka,” International Water Management Institute, Colombo, 1999.
- A. Wakeel, K. S. Rao K. Maikhurir and K. G. Saxena, “Forest Management and Land Use/Cover Changes in a Typical Micro Watershed in the Mid Elevation Zone of Central Himalaya, India,” Forest Ecology and Management, vol. 213, No. 1-3, July 2005, pp. 229-242.
- P.-J. Shi, Y. Yuan, J. Zheng, J.-A. Wang, Y. Ge and G.-Y. Qiu, “The Effect of Land Use/Cover Change on Surface Runoff in Shenzhen Region, China,” CETANA, vol. 69, No. 1, January 2007, pp. 31-35.
- Z. Desezo, J. Bartholy, R. Pongracz and Z. Barcza, “Analysis of Land-use/Land-cover Change in the Carpathian Region Based on Remote Sensing Techniques,” Physics and Chemistry of the Earth, vol. 30, No. 1-3, 2005, pp. 109-115.
- A. D. Roo, M. O. G. Schmuck, E. Koster, and A. Lucieer, “Assessing the Effects of Land Use Changes on Floods in the Meuse and Oder Catchment,” Physics and Chemistry of the Earth, Part B: Hydroligy, Oceans and Atmosphere, vol. 26, No. 7-8, 2001, pp. 593-599.
- M. N. Shrestha, “Integrated ANN Modeling for Assessment of Runoff Due to Land-use Change Using Remote Sensing and GIS,” 2000. http://www.gisdevelopment.net.
- X. Zhan, R. A. Sohlberg, J. R. G. C. Townshend, M. L. Dimiceli, J. C. Carroll, Eastman, M. C. Hansen and R. S. Defries, “Detection of Land Cover Changes Using MODIS 250 m Data,” Remote Sensing of Environment, vol. 83, 2002, pp. 336-350.
- C. J. van der Sande, S. M. de Jong and A. P. J. de Roo, “A Segmentation and Classification Approach of IKONOS-2 Imagery for Land Cover Mapping to Assist Flood Risk and Flood Damage Assessment,” International Journal of Applied Earth Observation and Geoinformation, vol. 4, No. 3, June 2003, pp. 217-229.
- M. H. Noorazuan, R. Ruslan, J. Hafizan, M. Sharifuddin, and J. Nazari, “GIS Application In Evaluating Land UseLand Cover Change and its Impact on Hydrological Regime in Langat River Basin, Malaysia,” Map Asia Conference, Malaysia, 14-15 October 2003.
- J. A. Richard and X. Jia, “Remote Sensing and Digital Image Analysis: An Introduction,” Springer-Verlag, Berlin, 1993.
- Japan International Cooperation Agency, “The Study on Flood and Debris Flow in the Caspian Coastal Area Focusing on the Flood-Hit Region in Golestan Province in Iran,” Final Report, vol. 4, October 2006.