Journal of Biomedical Science and Engineering
Vol.6 No.5A(2013), Article ID:32056,12 pages DOI:10.4236/jbise.2013.65A011
Cyclic nucleotide phosphodiesterase 3B is connected to osteopontin and protein kinase CK2 in pancreatic β-cells*
![]()
1Department of Experimental Medical Science, Division for Diabetes, Metabolism and Endocrinology, Lund University, Lund, Sweden
2Center for Complex Network Research (CCNR), Department of Physics, Northeastern University, Boston, USA
3Center for Cancer System Biology (CCSB) and Department of Cancer Biology, Dana-Farber Cancer Institute and Department of Genetics, Harvard Medical School, Boston, USA
4National Heart, Lung, and Blood Institute, National Institutes of Health (NIH), Bethesda, USA
5Pulmonary/Critical Care Medicine Branch, National Heart, Lung, and Blood Institute, National Institutes of Health (NIH), Bethesda, USA
Email: #emilia.heimann@med.lu.se
Copyright © 2013 Emilia Heimann et al. This is an open access article distributed under the Creative Commons Attribution License, which permits unrestricted use, distribution, and reproduction in any medium, provided the original work is properly cited.
Received 13 March 2013; revised 14 April 2013; accepted 14 May 2013
Keywords: Diabetes Mellitus; Pancreatic Islets; β-Cells; cAMP; Cyclic Nucleotide Phosphodiesterases; PDE; Osteopontin; Protein Kinase CK2
ABSTRACT
Islets from RIP-PDE3B mice, exhibiting β-cell specific overexpression of the cAMP/cGMP-degrading enzyme phosphodiesterase 3B (PDE3B) and dysregulated insulin secretion, were subjected to microarray analysis. We show that osteopontin (OPN) mRNA is increased in a dose-dependent manner in islets from RIP-PDE3B mice, as compared to wild-type islets. In addition, in silico analysis shows that PDE3B and OPN are interacting. Furthermore, OPN interacts with protein kinase CK2 in a distinct submodule of the protein-protein interaction network. We studied PDE3B and OPN proteins and, in some cases, also PDE1B and PDE4C, under conditions of relevance for insulin secretion. In the presence of forskolin, PDE inhibitors, insulin, or a protein kinase CK2 inhibitor, similar alterations in protein levels of PDE3B and OPN are shown. In summary, results from using a number of strategies demonstrate a connection between PDE3B and OPN as well as a role for protein kinase CK2 in pancreatic β-cells.
1. INTRODUCTION
Cyclic AMP (cAMP) and calcium are important second messengers that are critical for regulation of insulin exocytosis as well as a plethora of cellular processes within pancreatic β-cells [1]. Glucose is the main trigger of insulin exocytosis. Metabolized glucose increases the ratio of ATP to ADP, leading to the closure of ATP-dependent potassium channels, depolarization of the plasma membrane, and the opening of voltage-sensitive calcium channels [2]. Hormones, such as glucagon-like peptide 1 (GLP-1) and gastric inhibitory peptide (GIP), increase cAMP and potentiate glucose-induced insulin secretion in pancreatic islets and β-cells [3]. Cyclic nucleotide phosphodiesterases (PDEs), enzymes involved in regulating intracellular events through the control of the breakdown of cyclic AMP (cAMP) and/or cyclic GMP (cGMP), are to date comprised of eleven PDE families (PDE1-11) [4,5]. They are categorized into different PDE families depending on several aspects, e.g. their structural features, affinities for their substrates, and sensitivity for inhibitors and regulators [5]. PDEs are key modulators in a complicated network connected to cAMP, cGMP and calcium, e.g. the PDE1 family is dependent on calcium for activation [6]. In β-cells, the PDE1, PDE3 and PDE4 isoforms are expressed [7-13]. Furthermore, family-selective inhibition of PDE1 and PDE3, and to some extent also PDE4, potentiates glucose-stimulated insulin secretion (GSIS) in rodent pancreatic islets and β- cells [9,14]. Characterization of transgenic RIP-PDE3B mice, overexpressing β-cell PDE3B, clearly demonstrates the importance of PDE3B for regulating insulin secretion and whole body homeostasis [11,15]. These studies have shown that the RIP-PDE3B mice have impaired GSIS and cAMP-potentiated GSIS, deranged islet morphology, impaired glucose tolerance, and increased sensitivity to high fat-induced insulin resistance.
Osteopontin (OPN), also known as secreted phosphoprotein 1 (SPP1), is an integrinand calcium-binding phosphoprotein expressed in multiple cell types and involved in a broad spectrum of disease conditions, such as complications associated with diabetes mellitus [16-18]. OPN mRNA and protein are expressed in pancreatic islets and β-cells [19]. Experimentally induced diabetes, associated with an infiltration of inflammatory cells and increased production of nitric oxide (NO), gives rise to an increased level of β-cell OPN [19]. A recent study shows that OPN has a role in protecting the islets and β-cells from cytotoxicity through negatively regulating NO by inhibiting iNOS synthesis [20]. It is also known that β-cell OPN is differentially regulated by cytokines and glucose [16,20,21]. With regard to other cell types, previous studies have shown that elevated cAMP and/or cGMP levels through specific agents or selective as well as non-selective PDE inhibitors have an effect on OPN mRNA and protein levels [22-26]. However, the effect of modified intracellular cAMP levels and specifically the role of PDEs on OPN protein levels in pancreatic islets and β-cells is currently unknown. Hence, in this study, by integrating the gene-expression data with molecular interaction network and functional studies, we attempt to reveal the connection between PDEs and OPN in pancreatic β-cells.
2. MATERIAL AND METHODS
2.1. Animal Model
RIP-PDE3B/2 (~2-fold increase in PDE3B activity), RIP-PDE3B/7 (~7-fold increase in PDE3B activity) [15] and C57Bl/6 mice were bred in-house and kept under standardized conditions in the animal house facilities. All experimental procedures have been approved by the Committee of ethical animal research in Malmö and Lund (permission number: M249-11).
2.2. Cell Culture
The rat insulinoma cell line INS-1 (832/13) [27] was kept in RPMI 1640 (Sigma-Aldrich, St. Louis, MO, USA), containing 11 mM glucose and supplemented with 10% fetal calf serum, 100 units/ml penicillin, 100 µg/ml streptomycin, 2 mM L-glutamine and 50 µM β-mercaptoethanol. The cells were grown at 37˚C in an atmosphere of 5% CO2 and 95% air.
2.3. RNA Isolation
Total RNA was extracted using a RNeasy mini kit (Qiagen, Valencia, CA, USA) following the manufacturer’s directions. The concentration of the isolated RNA was determined using the Nanodrop ND-100 spectrophotometer (Nanodrop Technologies, Wilmington, DE, USA). Quality and integrity of the total RNA isolated was assessed on the Agilent 2100 bioanalyzer (Agilent Technologies, Palo Alto, CA, USA).
2.4. Target Preparation and Hybridization to Genechips
T7 based RNA amplification was carried out on 20 ng of the isolated total RNA using the Ambion MessageAmp Premier kit (Applied Biosystems/Ambion, Austin, TX, U.S.A.) as suggested by the manufacturer. Briefly, total RNA was incubated with oligo dT/T7 primers and reverse transcribed into double stranded cDNA. In vitro transcription and biotin labeling of the purified cDNA was performed using T7 RNA polymerase at 37˚C for 16 hours using message map premier IVT labeling kit following the manufacturer’s directions. The yield and integrity of the biotin labeled cRNA were determined using the nanodrop ND-1000 spectrophotometer and the Agilent 2100 bioanalyzer. 10 µg of biotin labeled RNA was fragmented to ~200 bp size by incubating in fragmentation buffer containing 200 mM Tris-Acetate pH 8.2, 500 mM Potassium Acetate and 500 Magnesium Acetate for 35 minutes at 94˚C prior to hybridization. Fragmented RNA was assessed for the fragment size on Agilent 2100 bioanalyzer and hybridized to Affymetrix mouse 430 2.0 genechips for 16 hours, washed and stained on an Affymetrix fluidics station.
2.5. Microarray Data Processing
Affymetrix GCOS version 1.4 was used to calculate the signal intensity and the percent present calls on the hybridized Affymetrix chip. The signal intensity values obtained for probe sets in the microarrays were transformed using an adaptive variance-stabilizing, quantilenormalizing transformation. Transformed data from all the chips were subjected to a principal component analysis (PCA) to detect outliers. To address the multiple comparisons, fold-cut off filters and false discovery rate (FDR) analysis filters were applied. Two-way hierarchical clustering was used to bring together sets of samples and genes with similar expression patterns. The hierarchical cluster was run from the JMP5.1 statistical software package (SAS Institute, Cary, NC, USA) using the ward method. Pathway analysis was performed using Ingenuity Pathway Analysis (Ingenuity Systems Inc., Redwood City, CA, USA).
2.6. Microarray Analysis
Pancreatic islets from 8 - 12 weeks old C57Bl/6, RIPPDE3B/2 and RIP-PDE3B/7 males were isolated by a collagenase digestion technique previously described [28]. RNA from isolated pancreatic islets (3 islets/mouse strain) was processed according to protocol, as described above, and analyzed by Affymetrix genechips. Microarray raw ratios were normalized and log-transformed on the base 10 scale. Relative gene expression was presented as fold change for RIP-PDE3B/2 or RIP-PDE3B/7 islets versus wild-type islet values.
2.7. Seed Gene Selection
We selected Spp1 (Opn), Pde3b and members of nuclear factor of activated T cells (Nfat) as seed genes. The selection of these genes was based upon: 1) the relevance of Pde3b regarding the phenotypic characteristics of the transgenic RIP-PDE3B mice; 2) the detected mRNA levels of Opn and Nfat5 within the RIP-PDE3B islet microarray data; and 3) the connection between NFAT4 and OPN, based on previous findings in the literature [29]. As the Nfat family consists of five members, Nfat1-5, we selected all of them as seed genes.
2.8. The Mouse Interactome
The mouse interactome consisting of 140,649 interactions was derived from the interologous interaction database (I2D), a database of predicted and experimentally validated protein-protein interactions (PPI) [30,31]. It is well known that all biological networks display the small world property suggesting the existence of short path lengths between any pair of genes in the network [32,33]. These short path lengths suggest that changes in the state of a node can impact the state of other neighboring nodes in the system. Thus, the measure of the shortest path length between pairs of seed genes was used to associate the biological link between them in the network. To connect the seed genes directly or indirectly, an all-seed gene pairs shortest path was calculated using the mouse interactome. In the search of minimal route connecting the seed genes, we restricted to path length of 1, 2 and 3. The sub-network connecting the 7 seed genes in shortest path length in the network consisted of 81 nodes (proteins) and 219 edges (interactions). We calculated the significance of the path length between seed gene pairs and all the gene pairs in the mouse interactome. The significance of path length was determined by MannWhitney-U test. Cytoscape was used to visualize the sub-network [34].
2.9. Cell Treatment
RPMI medium 1640 (Gibco®, Carlsbad, CA, USA) containing 300 mg/l L-glutamine and supplemented with 100 units/ml penicillin and 100 µg/ml streptomycin were used for treatment of INS-1 (832/13) cells. Cells were pre-incubated in RPMI 1640 supplemented with 1 mM glucose for 2 hours at 37˚C. The RPMI 1640 buffer was changed and cells were stimulated with 1 mM or 16 mM glucose in the presence or absence of one of the following stimuli: 5 - 50 µM quinalizarin (Calbiochem, Darmstadt, Germany), 100 mM forskolin (Sigma-Aldrich), 100 nM insulin (Novo Nordisk, Bagsvaerd, Denmark), 10 mM 8-Methoxymethyl-3-isobutyl-1-methylxanthine (8MMIBMX) (Biomol International, Lausen, Switzerland), 10 mM OPC3911 (Osaka Inc. Japan), 10 mM RO-20-1724 (Biomol International) or 25 mM 3-Isobutyl-1-methylxanthine (IBMX) (Sigma-Aldrich). Cells were stimulated for 24 hours at 37˚C and then harvested in a buffer containing 50 mM TES, pH 7.4, 250 mM sucrose, 1 mM EDTA, 2 mM EGTA, 40 mM phenyl-phosphate, 0.05 mM sodium orthovanadate and 5 mM NaF supplemented with Complete Protease Inhibitor Cocktail (containing inhibitors for serine-, cysteineand metalloproteases as well as calpains) (Roche, Pleasanton, CA, USA), and homogenized by 10 short sonication pulses. The homogenates were briefly centrifuged to remove cell debris. Total protein amount was determined according to Bradford [35].
2.10. Islet Treatment
The RPMI 1640 medium described above was used for treatment of RIP-PDE3B/7 and wild-type C57Bl/6 islets. Islets were pre-incubated in RPMI 1640 supplemented with 5 mM glucose for 2 hours at 37˚C. The RPMI 1640 buffer was changed and islets were incubated with 16 mM glucose for 18 hours at 37˚C and then prepared for SDS-PAGE and immunoblot analysis.
2.11. SDS-PAGE and Immunoblot Analysis
Homogenates from islets or cells were subjected to SDSPAGE. Proteins were electrotransferred to polyvinylidene membranes (Merck Millipore, Darmstadt, Germany) and the membranes were stained with Ponceau S (0.1% in 5% acetic acid) and then blocked with 10% milk in a buffer consisting of 20 mM Tris-HCl, pH 7.6, 137 mM NaCl and 0.1% (v/w) Tween-20 for 60 min. Membranes with proteins were probed with antibodies for PDE1B (Scottish Biomedical, Glasgow, UK) PDE3B (prepared against the peptide CGYYGSGKMFRRPSLP from rat PDE3B sequence [36]), PDE4C (Scottish Biomedical), OPN (Immuno-Biological Laboratories Co and NICHD, the University of Iowa) and β-actin (Sigma-Aldrich) and incubated overnight at 4˚C. Proteins were detected using the chemiluminescent Super Signal West Pico Luminol/ Enhancer solution (Thermo Fisher Scientific, Waltham, MA, USA) and the ChemiDoc XRS + Imager (Bio-Rad Laboratories, Hercules, CA, USA). Image Lab Software (Bio-Rad Laboratories) was used for quantification. Data are presented as fold of control, based on mean ± SD from the indicated number of experiments. Statistically significant differences were analyzed using Student’s t-test and significance levels were accepted when *p < 0.05, **p < 0.01 and ***p < 0.001.
3. RESULTS
3.1. Gene Expression Analysis of RIP-PDE3B Pancreatic Islets; Integration of Differential Expression Data into the Mouse PPI Network
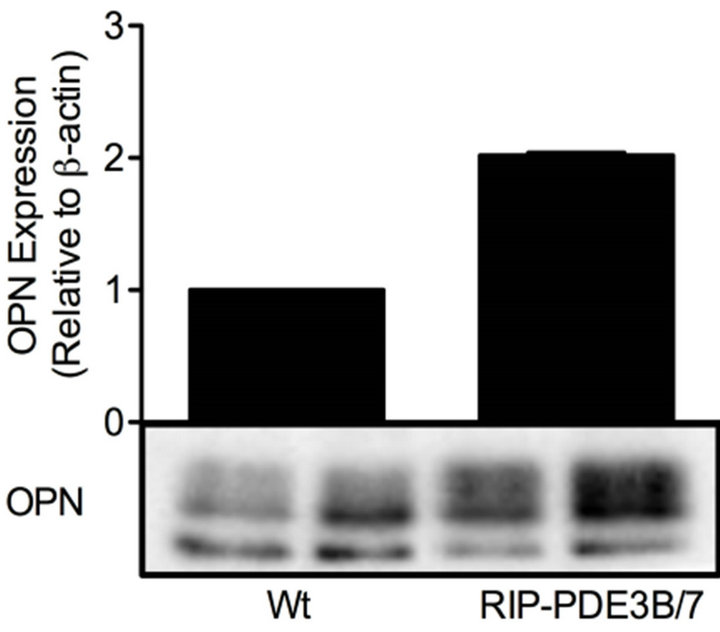
The gene expression profiles from the transgenic mouse models RIP-PDE3B/2 and RIP-PDE3B/7, showing 2- and 7-fold, respectively, increase in β-cell PDE3 activity, were screened in order to identify genes important for their phenotypic characteristics (typical characteristics are impaired insulin secretion and deranged islet morphology, changes that are more pronounced in the RIPPDE3B/7 mice) [15]. The results show that 38 and 1026 genes (data not shown) were altered in islets of RIPPDE3B/2 and RIP-PDE3B/7 mice, respectively, as compared to islets of wild-type mice. Of these genes, AFFX 18SRNAMur/X00686_5_at (no gene symbol), Apobec2, Cd79a, Dnaja1, Fxyd3, Pnlip and Spp1 (Opn) showed a “dose-dependent” alteration when RIP-PDE3B/2 and RIP-PDE3B/7 expression levels were compared (Table 1). Since OPN is highly relevant in the context of β-cell function and diabetes [16,18-21,29], we selected this gene as a target for further analysis. In addition to a marked increase in mRNA, Spp1 (hereafter called OPN when we describe the mRNA and protein) protein was increased in islets of RIP-PDE3B/7 mice (Figure 1(a)). In accordance with a previous study by us, PDE3B protein levels were increased in islets of RIP-PDE3B/7 mice compared to wild-type islets (Figure 1(b)) [15].
A sub-network with the shortest path length between
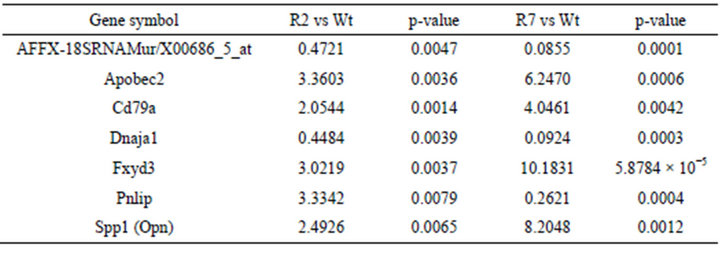
Table 1. Alterations in mRNA levels in islets of RIP-PDE3B mice. mRNA from RIP-PDE3B/2 (R2), RIP-PDE3B/7 (R7) and C57Bl/6 (Wt) islets were isolated and transcribed into cDNA for Affymetrix genechip analysis. The relative gene expression is presented as fold change of normalized values for RIP-PDE3B/2 and RIP-PDE3B/7 compared to C57Bl/6 mice (n = 3). A fold change above 2.0 indicates an induction whereas a fold change below 0.5 indicates a repression of gene expression.
 (a)
(a) (b)
(b)
Figure 1. OPN protein levels are elevated in RIP-PDE3B islets. Islet homogenates (15 µg) from RIP-PDE3B/7 and C57Bl/6 mice were run on SDS-PAGE and electro-transferred to nitrocellulose membranes. Membranes were subjected to immunoblotting using antibodies for PDE3B, OPN and β-actin. Quantification was made using Image Lab Software (Bio-Rad Laboratories). Quantified data are presented as fold of control (Wt), based on mean ± SD for each protein. (a) OPN (n = 2) and (b) PDE3B (n = 2).
pairs of seed genes (Pde3b, Spp1, Nfat1-5) was constructed to establish a relationship between PDE3B and OPN in the protein-protein interaction network (interactome). The sub-network in the interactome consisted of 81 genes with 219 links (Figure 2). The path length, illustrated in Figure 3(a), between seed gene pairs was significant compared to all gene-pairs in the interactome (p—0.005), as shown in Figure 3(b). This indicates that a high fraction of seed genes are interacting in minimum path length of 2 and 3 in the interactome than by chance. As shown in Figure 2, Nfatc1 and Nfatc2 were directly connected to each other and Nfatc1 was linked to Spp1 via Prkca. In the sub-network, Pde3b was connected to Spp1 through Ywhab and Csnk2a1. The differentially expressed data for both RIP-PDE3B/2 and RIP-PDE3B/7 mice were integrated into the sub-network, as shown in Figure 2. Five differentially expressed genes, Spp1, Nfat5, Ogt, Anp32a and Csnk2a1, were detected within the sub-network (Figure 2). As shown in Table 2, Spp1 (fold change value of 2.5) was the only gene that was detected in the RIP-PDE3B/2 mouse model whereas Spp1 (8.2), Nfat5 (2.4), Ogt (2.4), Anp32a (2.2) and Csnk2a1 (2.3) were detected in the RIP-PDE3B/7 mouse model. Taken together, the sub-network with the differentially expressed data for both RIP-PDE3B/2 and RIPPDE3B/7 mice showed that Spp1 connected to Pde3b via Csnk2a1. Therefore, we decided to study the regulation
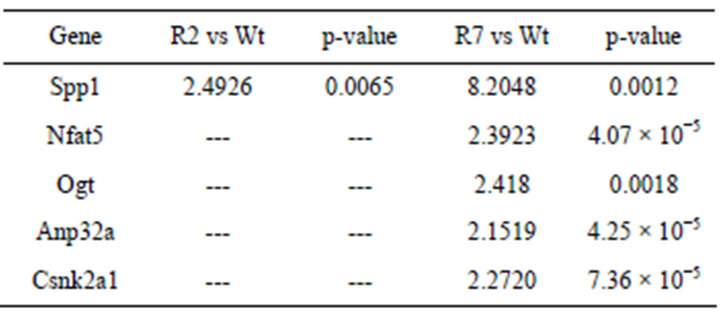
Table 2. Detection of five differentially expressed genes within the protein-protein interaction (PPI) network. The five differentially expressed genes detected within the PPI network are presented as fold change of normalized values for RIP-PDE3B/2 and RIP-PDE3B/7 compared to C57Bl/6 mice. A fold change above 2.0 indicates an induction.

Figure 2. Differential expression data of RIP-PDE3B was integrated with sub-network of 81 genes with 219 links. Size of nodes is based on the degree of connections. Differentially expressed genes, Spp1, Anp32a, Ogt, Nfat5 and Csnk2a1 were within this sub-network, where Ywhab and Csnk2a1 connect with Pde3b and Spp1.
of PDE3B and OPN proteins during conditions of relevance for β-cell function. Furthermore, we utilized an inhibitor for CSNK2A1 (hereafter called protein kinase CK2) to study its effect on PDE3B and OPN proteins in pancreatic b-cells.
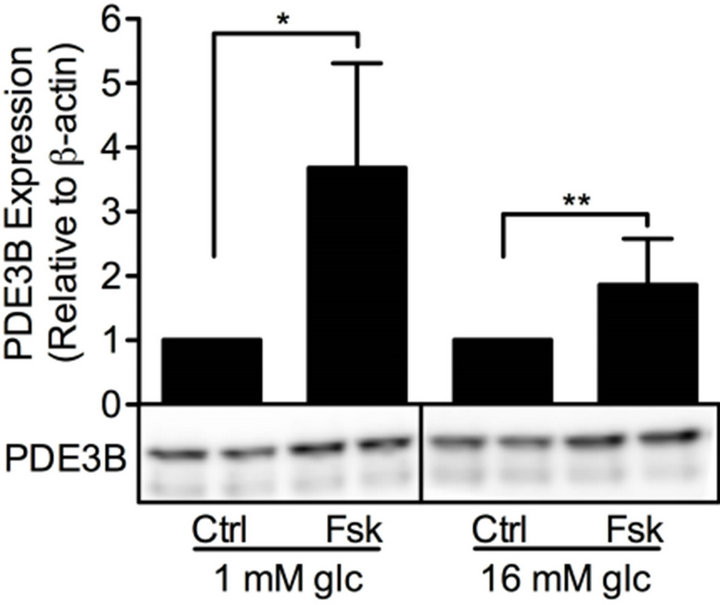
3.2. The Effect of Forskolin and PDE Inhibitors on PDE3B and OPN Proteins in β-Cells
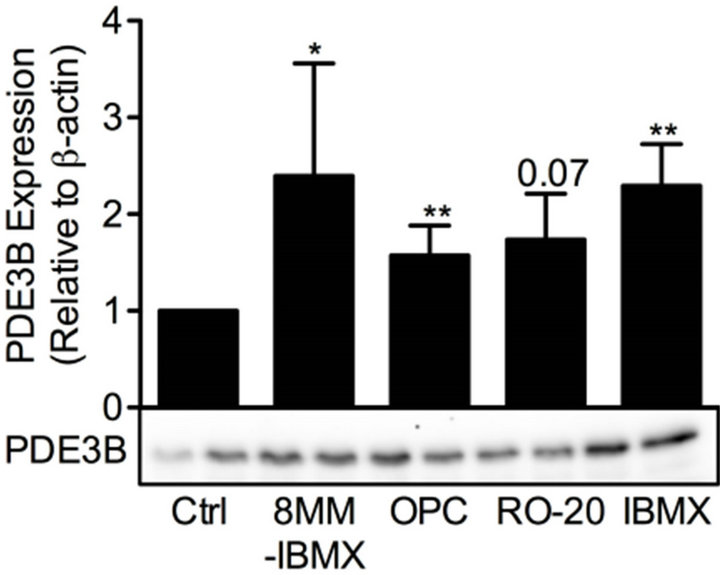
cAMP is essential for pancreatic β-cells as it regulates cell differentiation, growth and survival, as well as insulin exocytosis [3]. To study the effect of modulation of cAMP levels on PDE3B and OPN proteins, INS-1 (832/ 13) cells were treated for 24 h with low and/or high glucose in the presence or absence of 100 mM forskolin to increase the production of cAMP, with the non-selective PDE inhibitor IBMX (25 mM), or with selective inhibitors for PDE1 (10 mM 8MM-IBMX), PDE3 (10 mM OPC3911) or PDE4 (10 mM RO-20-1724).We show that, in INS-1 (832/13) cells, PDE3B and OPN proteins are induced, albeit to different extents, by forskolin (Figure 4) or the selective and non-selective PDE inhibitors (Figure 5). More specifically, the effect of forskolin on PDE3B, with a 1.8 to 3.8-fold increase, was slightly more powerful than that on OPN, which showed a 1.3 to 1.7-fold increase. In the presence of the PDE inhibitors, a similar pattern of induction was seen for PDE3B and OPN proteins, which were induced 1.6 to 2.4-fold and 1.5 to 2.5-fold, respectively.
3.3. The Effect of Glucose on PDE1B, PDE3B, PDE4C and OPN Proteins in β-Cells
As a next relevant condition for our studies, we used high glucose, the main trigger of insulin exocytosis. We studied the effects of glucose not only on PDE3B and OPN but also on PDE1B and PDE4C, as results in Figure 5 indicated a role for these latter PDEs in the regulation of PDE3B. Hence, INS-1 (832/13) cells were stimulated for 24 h with low and high glucose and the effect on PDE1, PDE3 and PDE4 family members as well as OPN was analyzed. As shown in Figure 6, high glucose
 (a)
(a)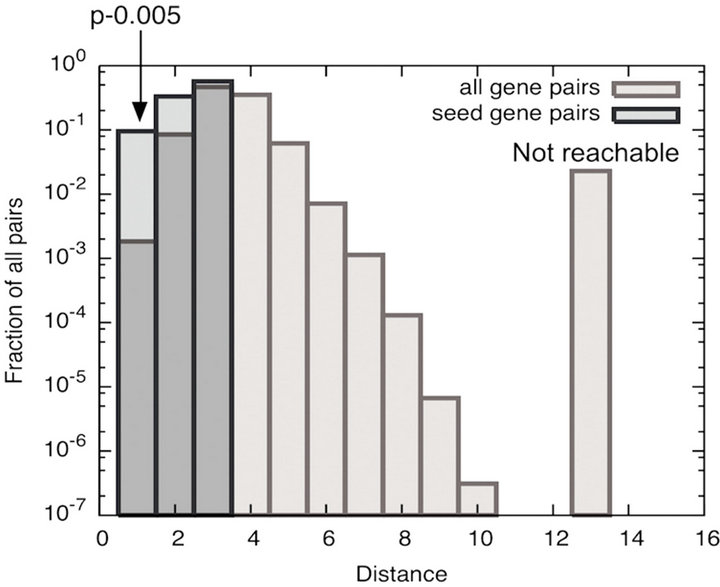 (b)
(b)
Figure 3. (a) Illustration of the path length in the interactome. The length of the path is the number of links we travel from one triangle to the other; (b) Significance of the shortest path among the seed genes in the interactome. We compared the distribution of path length among the 7 seed gene pairs and all gene pairs in the interactome. Histogram indicates that the shortest path length between seed genes were significant compared to all gene pairs in the interactome.
 (a)
(a)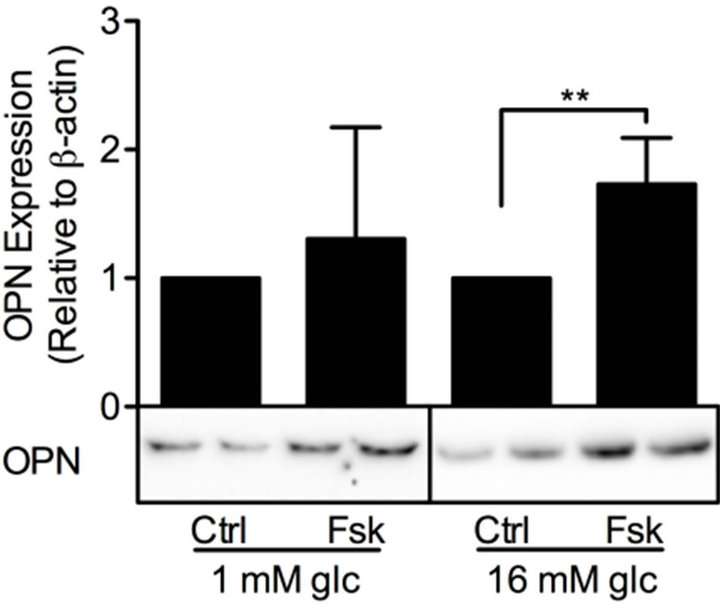 (b)
(b)
Figure 4. Forskolin induces PDE3B and OPN proteins. INS-1 (832/13) cells were stimulated for 24h with low or high glucose (glc) in the presence or absence of forskolin (fsk). Cells stimulated with low or high glucose are used as controls (ctrl). Homogenates (15 µg) were run on SDS-PAGE, electro-transferred to nitro-cellulose membranes and subjected to immunoblotting. β-actin was used as loading control. Quantification was made using Image Lab Software (Bio-Rad Laboratories) and data are presented as fold of control, based on mean ± SD for each protein. (a) PDE3B (n = 8 - 9) and (b) OPN (n = 7 - 10).
 (a)
(a)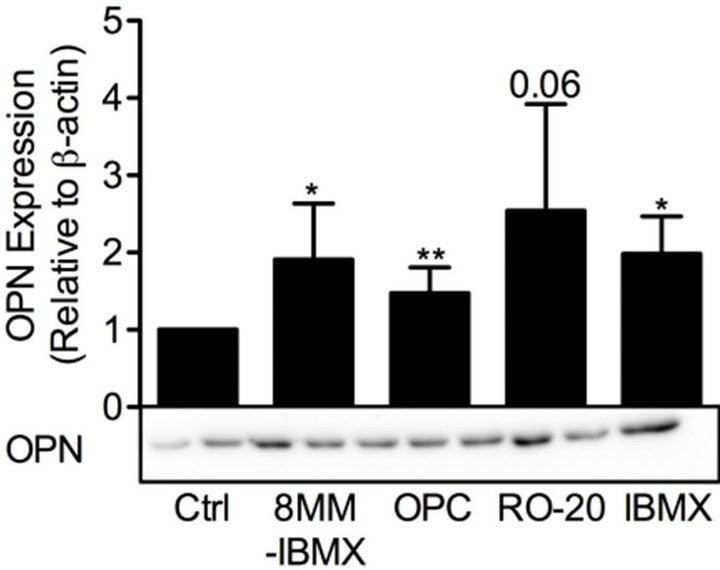 (b)
(b)
Figure 5. PDE inhibitors induce PDE3B and OPN proteins. INS-1 (832/13) cells were stimulated for 24 h with high glucose (glc) in the presence or absence of selective inhibitors for PDE1 (8MM-IBMX), PDE3 (OPC3911) and PDE4 (RO-20-1724) as well as the general PDE inhibitor IBMX. High glucose was used as control (ctrl). Homogenates (15 µg) were run on SDS-PAGE, electro-transferred to nitrocellulose membranes and subjected to immunoblotting. β-actin was used as loading control. Quantification was made using Image Lab Software (BioRad Laboratories) and data are presented as fold of control, based on mean ± SD for each protein. (a) PDE3B (n = 4 - 6) and (b) OPN (n = 4 - 7).
 (a)
(a)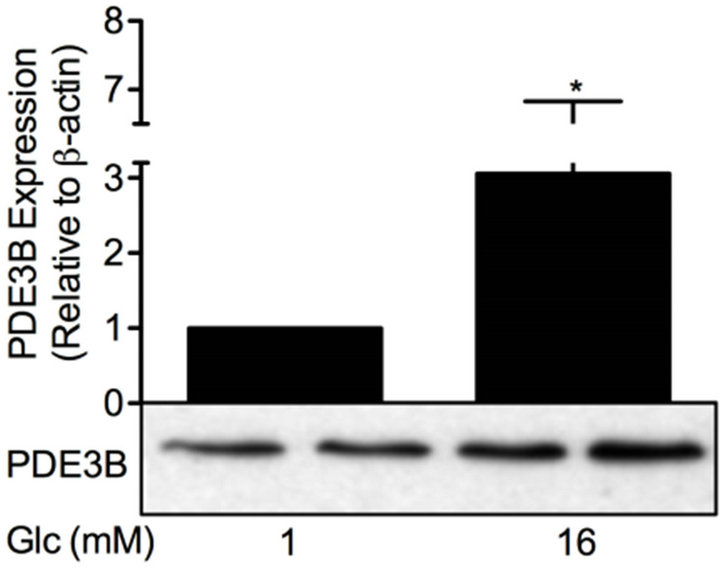 (b)
(b) (c)
(c)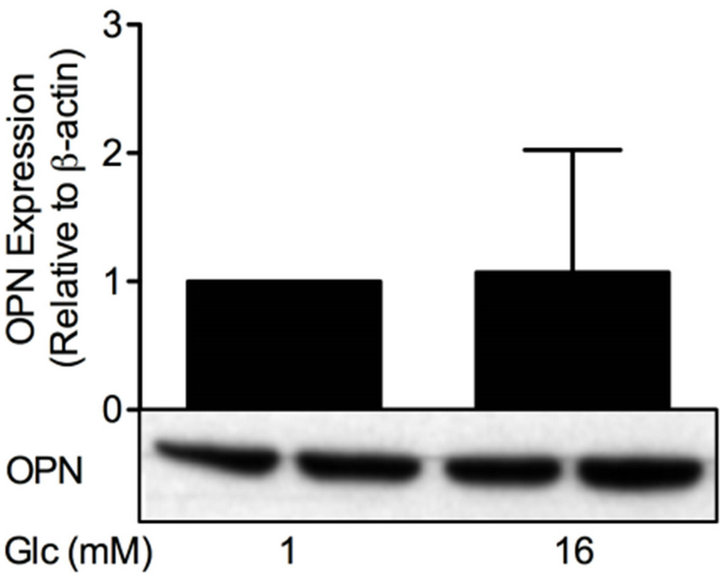 (d)
(d)
Figure 6. Glucose differentially affects PDE and OPN proteins. INS-1 (832/13) cells were stimulated for 24 h with low or high glucose (glc). Homogenates (15 µg) were run on SDSPAGE, electro-transferred to nitrocellulose membranes and subjected to immunoblotting. β-actin was used as loading control. Quantification was made using Image Lab Software (BioRad Laboratories) and data are presented as fold of control, based on mean ± SD for each protein. (a) PDE1B (n = 6); (b) PDE3B (n = 16); (c) PDE4C (n = 6) and (d) OPN (n = 24).
increased the protein levels of PDE1B (1.5-fold), PDE3B (3.1-fold) and PDE4C (2.3-fold) but did not have an effect on OPN protein.
3.4. The Effect of Insulin on PDE3B and OPN Proteins in β-Cells
Insulin is another stimulus of relevance for β-cell function, e.g. the autocrine effect of insulin on glucosestimulated insulin secretion has been shown to be both inhibitory and stimulatory [37]. We therefore investigated the effect of insulin on PDE3B and OPN proteins. INS-1 (832/13) cells were treated with low or high glucose in the presence or absence of 100 nM insulin for 24 h. As shown in Figure 7, insulin increased the protein
 (a)
(a)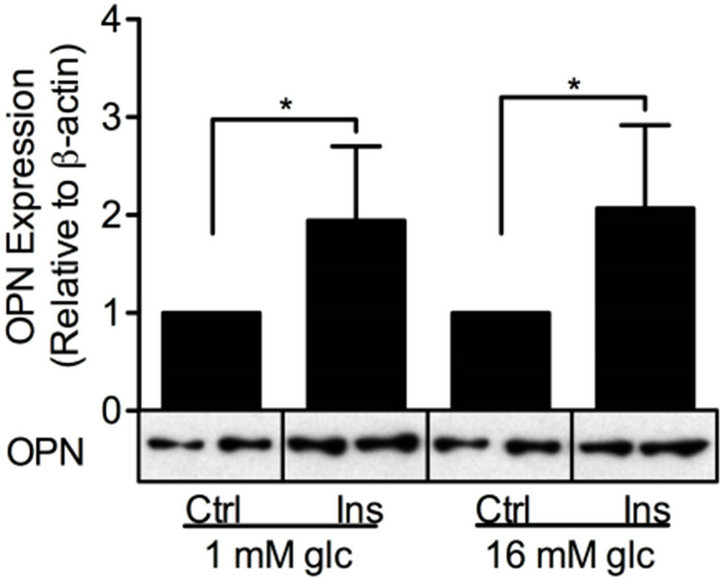 (b)
(b)
Figure 7. Insulin induces PDE3B and OPN proteins. INS-1 (832/13) cells were stimulated for 24h with low or high glucose (glc) in the presence or absence of insulin (ins). Low or high glucose-stimulated cells were used as controls (ctrl). Homogenates (15 µg) were run on SDSPAGE, electro-transferred to nitrocellulose membranes and subjected to immunoblotting. β- actin was used as loading control. Quantification was made using Image Lab Software (BioRad Laboratories) and data are presented as fold of control, based on mean ± SD for each protein. (a) PDE3B (n = 5) and (b) OPN (n = 6 - 7).
levels of PDE3B 2.1 to 3.5-fold and OPN 1.9 to 2.1-fold in INS-1 (832/13) cells.
3.5. The Effect of Inhibiting Protein Kinase CK2 on PDE3B and OPN Proteins in β-Cells
Inhibition of protein kinase CK2 by quinalizarin has previously been shown to elevate insulin secretion [38]. As protein kinase CK2 interacted with OPN in a distinct submodule within the protein-protein interaction network (Figures 2 and 8), we decided to investigate the effect of protein kinase CK2 inhibition on OPN and PDE3B proteins in INS-1 (832/13) cells. Thus, we treated INS-1 (832/13) cells with high glucose in the presence or absence of 5, 20 and 50 mM quinalizarin. As shown in Figure 9(a) and (b), quinalizarin reduced the protein levels of PDE3B (0.5 to 0.9-fold) and OPN (0.7 to 0.9-fold) in a dose-dependent manner in INS-1 (832/13) cells.
4. DISCUSSION
Our work establish a connection between PDE3B, OPN and protein kinase CK2, a kinase known to phosphorylate OPN [39]; 1) OPN and protein kinase CK2 mRNA were upregulated in mice overexpressing PDE3B; 2) Pde3b, Spp1 (Opn) and Csnk2a1 (protein kinase CK2) appeared within the same sub-network; 3) Spp1 and Csnk2a1 were first order of neighbors whereas Pde3b was connected to Spp1 via Ywhab and Csnk2a1 in the sub-network; 4) the protein kinase CK2 inhibitor quinalizarin induced a dose-dependent reduction of PDE3B and OPN proteins in pancreatic β-cells; and 5) OPN and PDE3B protein levels show the same pattern of alteration by forskolin, PDE1-, PDE3- and 4-inhibitors as well as insulin.
The use of selective PDE inhibitors allow for inhibiting specific PDE families localized to different regions in
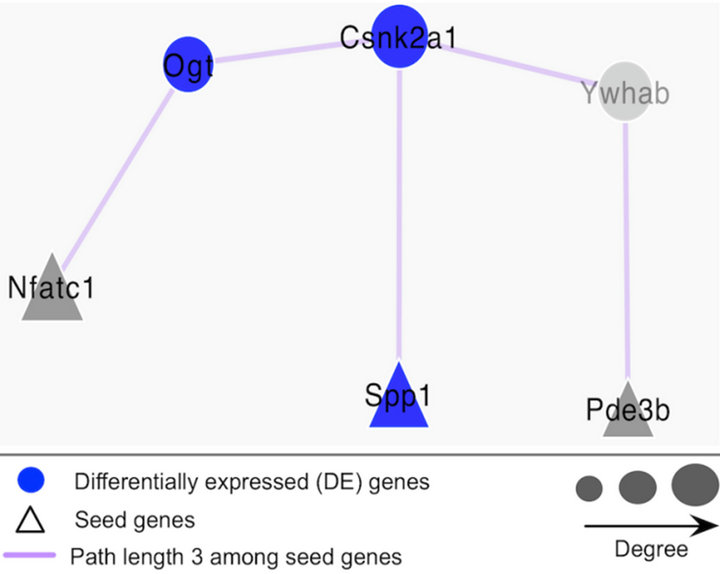
Figure 8. Illustration of the connection between SPP1 and PDE3B in the sub-network. With the path length of 3, Csnk2a1 and Ywhab connect with Spp1 and Pde3b in the sub-network.
the cell [40]. Interestingly, we found that PDE3B protein is induced not only by a selective PDE3 inhibitor but also by selective inhibitors for PDE1 and PDE4. This indicates, in the context of the β-cell, that PDE1, 3 and 4 communicate in the regulation of specific cAMP pools. Indeed, all three PDEs have been implicated in the regulation of insulin secretion [9,12-14]. The regulation of OPN protein by forskolin and PDE inhibitors follow a similar pattern as observed for PDE3B protein. Since there appears to be a cross-talk between PDEs, it is difficult to know the respective roles for PDE1, 3 and 4 in the regulation of OPN.
With regard to OPN, previous studies have shown that cAMP has a dual role in regulating OPN. Forskolin, cAMP-analogues, non-selective and selective PDE inhibitors, all having an effect on cAMP levels, either increased or reduced OPN mRNA and protein in different
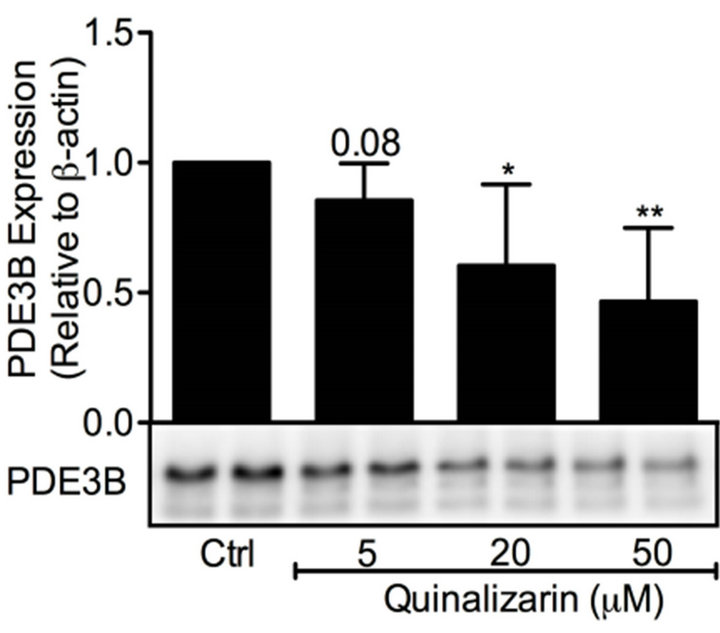 (a)
(a) (b)
(b)
Figure 9. Protein kinase CK2 inhibition reduces PDE3B and OPN protein levels. INS-1 (832/ 13) cells were stimulated for 24 h with high glucose (glc) in the presence or absence of quinalizarin. High glucose was used as control (ctrl). Homogenates (15 µg) were run on SDSPAGE, electro-transferred to nitrocellulose membranes and subjected to immunoblotting. β- actin was used as loading control. Quantification was made using Image Lab Software (BioRad Laboratories) and data are presented as fold of control, based on mean ± SD for each protein. (a) PDE3B (n = 5) and (b) OPN (n = 7).
cell types [22-26]. Recently, gastric inhibitory peptide (GIP), known to mediate its effects via cAMP as well as by other mechanisms, was shown to increase OPN at both mRNA and protein levels [21]. As for the long-term regulation of PDE3B by cAMP, up-regulation has been demonstrated in vascular smooth muscle cells and T lymphocytes, whereas the opposite effect has been shown in adipocytes [41-44]. Short-term treatment with cAMPelevating agents is known to phosphorylate and activate PDE3B in a number of cell models, including β-cells [45-47].
An autocrine action of insulin can be both inhibitory and stimulatory on glucose-stimulated insulin secretion [37]. The finding that PDE3B protein is induced by insulin in pancreatic β-cells is in agreement with the ability of insulin to phosphorylate and activate PDE3 in rat pancreatic islets and β-cells [45]. Moreover, insulin has been shown to induce PDE3B protein in 3T3-L1 adipocytes [48]. To our knowledge, insulin-induced effects on OPN protein have not been addressed previously but such effects could have an important role in mediating a positive autocrine effect on intracellular calcium levels and insulin exocytosis [49]. The importance of calcium has been described in a study on osteoblasts, where a phosphatedependent induction of OPN mRNA is dependent on the presence of calcium [50].
Glucose is the main trigger of insulin exocytosis in pancreatic β-cells. We show that high glucose induces PDE1B, PDE3B and PDE4C proteins in pancreatic β- cells. This is in agreement with our previous study showing that high glucose increases the activity of PDE3B in rat pancreatic islets and β-cells [45]. Although PDE1 isoforms are activated at the catalytic level by calcium and calmodulin [6], the role of calcium in regulating PDE1 gene expression is not known. Here we show that glucose induced upregulation of PDE1B protein, an enzyme activated by calcium and catalyzing degradation of cAMP, providing an interesting mechanism connecting cAMP and calcium signaling in pancreatic β-cells. In the present study, high glucose did not have an effect on OPN protein in pancreatic β-cells. In fact, other studies have shown that glucose has different effects on OPN promoter activity, mRNA and protein levels in pancreatic islets and β-cells [16,21].
In summary, by integrating gene expression with network analysis, we have shown that there is a connection between PDE3B, OPN and protein kinase CK2 in β-cells. The results indicate that the functional effect among the interacting genes is localized in the immediate vicinity in the network. In addition, the genes in the same functional module are not too far from each other. Furthermore, the results from the functional analysis imply that there is a connection, in terms of pattern in regulation, between OPN and PDE3B as well as between the three key PDEs: PDE1, PDE3 and PDE4 in β-cells. These proteins are considered to be of necessity for β-cell function and further studies are needed in order to exactly delineate theirconnection to each other and also in the context of signaling networks within pancreatic β-cells.
5. ACKNOWLEDGEMENTS
Ann-Kristin Holmén-Pålbrink and the NHLBI Genomics Core are acknowledged for their excellent technical assistance. We also thank Delong Liu (NHLBI Genomics Core) for his preliminary analysis of the Affymetrix gene microarray and Prof. Albert-László Barabási for providing the opportunity for EH to visit the Center for Complex Network Research (CCNR), Northeastern University, Boston, US. VCM, NR, and DL are supported by the NHLBI Intramural research Program. The monoclonal antibody for OPN developed by M. Solursh and A. Franzen was obtained from the Developmental Studies Hybridoma Bank developed under the auspices of the NICHD and maintained by The University of Iowa, Department of Biology, Iowa City, IA 52242.
REFERENCES
- Dyachok, O., et al. (2008) Glucose-induced cyclic AMP oscillations regulate pulsatile insulin secretion. Cell Metabolism, 8, 26-37. doi:10.1016/j.cmet.2008.06.003
- Straub, S.G. and Sharp, G.W. (2002) Glucose-stimulated signaling pathways in biphasic insulin secretion. Diabetes/Metabolism Research and Reviews, 18, 451-463. doi:10.1002/dmrr.329
- Furman, B., Ong, W.K. and Pyne, N.J. (2010) Cyclic AMP signaling in pancreatic islets. Advances in Experimental Medicine and Biology, 654, 281-304. doi:10.1007/978-90-481-3271-3_13
- Pyne, N.J. and Furman, B.L. (2003) Cyclic nucleotide phosphodiesterases in pancreatic islets. Diabetologia, 46, 1179-1189. doi:10.1007/s00125-003-1176-7
- Conti, M. and Beavo, J. (2007) Biochemistry and physiology of cyclic nucleotide phosphodiesterases: Essential components in cyclic nucleotide signaling. Annual Review of Biochemistry, 76, 481-511. doi:10.1146/annurev.biochem.76.060305.150444
- Sharma, R.K., et al. (2006) Regulation of calmodulinstimulated cyclic nucleotide phosphodiesterase (PDE1): Review. International Journal of Molecular Medicine, 18, 95-105.
- Shafiee-Nick, R., Pyne, N.J. and Furman, B.L. (1995) Effects of type-selective phosphodiesterase inhibitors on glucose-induced insulin secretion and islet phosphodiesterase activity. British Journal of Pharmacology, 115, 1486-1192. doi:10.1111/j.1476-5381.1995.tb16641.x
- El-Metwally, M., et al. (1997) The effect of selective phosphodiesterase inhibitors on plasma insulin concentrations and insulin secretion in vitro in the rat. European Journal of Pharmacology, 324, 227-232. doi:10.1016/S0014-2999(97)00076-9
- Han, P., et al. (1999) The calcium/calmodulin-dependent phosphodiesterase PDE1C down-regulates glucose-induced insulin secretion. The Journal of Biological Chemistry, 274, 22337-22344. doi:10.1074/jbc.274.32.22337
- Zhao, A.Z., et al. (1997) Attenuation of insulin secretion by insulin-like growth factor 1 is mediated through activation of phosphodiesterase 3B. Proceedings of the National Academy of Sciences of the United States of America, 94, 3223-3228. doi:10.1073/pnas.94.7.3223
- Walz, H.A., et al. (2006) Early and rapid development of insulin resistance, islet dysfunction and glucose intolerance after high-fat feeding in mice overexpressing phosphodiesterase 3B. Journal of Endocrinology, 189, 629- 641. doi:10.1677/joe.1.06522
- Walz, H.A., et al. (2007) Beta-cell PDE3B regulates Ca2+-stimulated exocytosis of insulin. Cell Signal, 19, 1505-1513. doi:10.1016/j.cellsig.2007.01.030
- Waddleton, D., et al. (2008) Phosphodiesterase 3 and 4 comprise the major cAMP metabolizing enzymes responsible for insulin secretion in INS-1 (832/13) cells and rat islets. Biochemical Pharmacology, 76, 884-893. doi:10.1016/j.bcp.2008.07.025
- Ahmad, M., et al. (2000) Effect of type-selective inhibitors on cyclic nucleotide phosphodiesterase activity and insulin secretion in the clonal insulin secreting cell line BRIN-BD11. British Journal of Pharmacology, 129, 1228- 1234. doi:10.1038/sj.bjp.0703165
- Harndahl, L., et al. (2004) Beta-cell-targeted overexpression of phosphodiesterase 3B in mice causes impaired insulin secretion, glucose intolerance, and deranged islet morphology. The Journal of Biological Chemistry, 279, 15214-15222. doi:10.1074/jbc.M308952200
- Gong, Q., et al. (2009) Expression and regulation of osteopontin in type 1 diabetes. Islets, 1, 34-41. doi:10.4161/isl.1.1.8629
- Chen, Y., Bal, B.S. and Gorski, J.P. (1992) Calcium and collagen binding properties of osteopontin, bone sialoprotein, and bone acidic glycoprotein-75 from bone. The Journal of Biological Chemistry, 267, 24871-8.
- Takemoto, M., et al. (2000) Enhanced expression of osteopontin in human diabetic artery and analysis of its functional role in accelerated atherogenesis. Arteriosclerosis, Thrombosis, and Vascular Biology, 20, 624-628. doi:10.1161/01.ATV.20.3.624
- Katakam, A.K., et al. (2005) Streptozotocin (STZ) mediates acute upregulation of serum and pancreatic osteopontin (OPN): A novel islet-protective effect of OPN through inhibition of STZ-induced nitric oxide production. Journal of Endocrinology, 187, 237-247. doi:10.1677/joe.1.06411
- Arafat, H.A., et al. (2007) Osteopontin protects the islets and beta-cells from interleukin-1 beta-mediated cytotoxicity through negative feedback regulation of nitric oxide. Endocrinology, 148, 575-584. doi:10.1210/en.2006-0970
- Lyssenko, V., et al. (2011) Pleiotropic effects of GIP on islet function involve osteopontin. Diabetes, 60, 2424- 2433. doi:10.2337/db10-1532
- Hsieh, M.S., et al. (2010) Dipyridamole suppresses high glucose-induced osteopontin secretion and mRNA expression in rat aortic smooth muscle cells. Circulation Journal, 74, 1242-1250. doi:10.1253/circj.CJ-09-0561
- Wakabayashi, S., et al. (2002) Involvement of phosphodiesterase isozymes in osteoblastic differentiation. Journal of Bone and Mineral Metabolism, 17, 249-256. doi:10.1359/jbmr.2002.17.2.249
- Daiter, E., et al. (1996) Cell differentiation and endogenous cyclic adenosine 3’,5’-monophosphate regulate osteopontin expression in human trophoblasts. Endocrinology, 137, 1785-1790. doi:10.1210/en.137.5.1785
- Cai, Y., et al. (2010) Adrenomedullin up-regulates osteopontin and attenuates vascular calcification via the cAMP/ PKA signaling pathway. Acta Pharmacologica Sinica, 31, 1359-1366. doi:10.1038/aps.2010.89
- Lo, K.W., et al. (2011) The small molecule PKA-specific cyclic AMP analogue as an inducer of osteoblast-like cells differentiation and mineralization. Journal of Tissue Engineering and Regenerative Medicine, 6, 40-48.
- Hohmeier, H.E., et al. (2000) Isolation of INS-1-derived cell lines with robust ATP-sensitive K+ channel-dependent and -independent glucose-stimulated insulin secretion. Diabetes, 49, 424-430. doi:10.2337/diabetes.49.3.424
- Harndahl, L., et al. (2002) Important role of phosphodiesterase 3B for the stimulatory action of cAMP on pancreatic beta-cell exocytosis and release of insulin. The Journal of Biological Chemistry, 277, 37446-37455. doi:10.1074/jbc.M205401200
- Nilsson-Berglund, L.M., et al. (2010) Nuclear factor of activated T cells regulates osteopontin expression in arterial smooth muscle in response to diabetes-induced hyperglycemia. Arteriosclerosis, Thrombosis, and Vascular Biology, 30, 218- 224. doi:10.1161/ATVBAHA.109.199299
- Brown, K.R. and Jurisica, I. (2007) Unequal evolutionary conservation of human protein interactions in interologous networks. Genome Biology, 8, R95. doi:10.1186/gb-2007-8-5-r95
- Brown, K.R. and Jurisica, I. (2005) Online predicted human interaction database. Bioinformatics, 21, 2076- 2082. doi:10.1093/bioinformatics/bti273
- Wagner, A. and Fell, D.A. (2001) The small world inside large metabolic networks. Proceedings of the Royal Society B: Biological Sciences 268, 1803-1810. doi:10.1098/rspb.2001.1711
- Adamic, L.A. and Huberman, B.A. (2000) Power-law distribution of the world wide web. Science, 287, 2115. doi:10.1126/science.287.5461.2115a
- Smoot, M.E., et al. (2011) Cytoscape 2.8: New features for data integration and network visualization. Bioinformatics, 27, 431-432. doi:10.1093/bioinformatics/btq675
- Bradford, M.M. (1976) A rapid and sensitive method for the quantitation of microgram quantities of protein utilizing the principle of protein-dye binding. Analytical Biochemistry, 72, 248-254. doi:10.1016/0003-2697(76)90527-3
- Taira, M. (1993) Molecular cloning of the rat adipocyte hormone-sensitive cyclic GMP-inhibited cyclic nucleotide phosphodiesterase. The Journal of Biological Chemistry, 268, 18573-18579.
- Leibiger, I.B., Leibiger, B. and Berggren, P.O. (2002) Insulin feedback action on pancreatic beta-cell function. FEBS Letters, 532, 1-6. doi:10.1016/S0014-5793(02)03627-X
- Meng, R., Gotz, C. and Montenarh, M. (2010) The role of protein kinase CK2 in the regulation of the insulin production of pancreatic islets. Biochemical and Biophysical Research Communications, 401, 203-206. doi:10.1016/j.bbrc.2010.09.028
- Ashkar, S., et al. (1993) In vitro phosphorylation of mouse osteopontin expressed in E. coli. Biochemical and Biophysical Research Communications, 191, 126-133. doi:10.1006/bbrc.1993.1193
- Francis, S.H., Blount, M.A. and Corbin, J.D. (2011) Mammalian cyclic nucleotide phosphodiesterases: Molecular mechanisms and physiological functions. Physiological Reviews, 91, 651-690. doi:10.1152/physrev.00030.2010
- Rahn Landstrom, T., et al. (2000) Down-regulation of cyclic-nucleotide phosphodiesterase 3B in 3T3-L1 adipocytes induced by tumour necrosis factor alpha and cAMP. Biochemical Journal, 346, 337-343. doi:10.1042/0264-6021:3460337
- Rose, R.J., et al. (1997) Cyclic AMP-mediated regulation of vascular smooth muscle cell cyclic AMP phosphodiesterase activity. British Journal of Pharmacology, 122, 233-240. doi:10.1038/sj.bjp.0701376
- Liu, H. and Maurice, D.H. (1998) Expression of cyclic GMP-inhibited phosphodiesterases 3A and 3B (PDE3A and PDE3B) in rat tissues: Differential subcellular localization and regulated expression by cyclic AMP. British Journal of Pharmacology, 125, 1501-1510. doi:10.1038/sj.bjp.0702227
- Seybold, J., et al. (1998) Induction of phosphodiesterases 3B, 4A4, 4D1, 4D2, and 4D3 in Jurkat T-cells and in human peripheral blood T-lymphocytes by 8-bromocAMP and Gs-coupled receptor agonists. Potential role in beta2-adrenoreceptor desensitization. The Journal of Biological Chemistry, 273, 20575-20588. doi:10.1074/jbc.273.32.20575
- Heimann, E., et al. (2010) Pression and regulation of cyclic nucleotide phosphodiesterases in human and rat pancreatic islets. PLoS One, 5, e14191. doi:10.1371/journal.pone.0014191
- Ahmad, F., et al. (2009) Differential regulation of adipocyte PDE3B in distinct membrane compartments by insulin and the beta3-adrenergic receptor agonist CL316243: Effects of caveolin-1 knockdown on formation/maintenance of macromolecular signalling complexes. Biochemical Journal, 424, 399-410. doi:10.1042/BJ20090842
- Lindh, R., et al. (2007) Multisite phosphorylation of adipocyte and hepatocyte phosphodiesterase 3B. Biochimica et Biophysica Acta (BBA)-Molecular Cell Research, 1773, 584-592. doi:10.1016/j.bbamcr.2007.01.010
- Oknianska, A., et al. (2007) Long-term regulation of cyclic nucleotide phosphodiesterase type 3B and 4 in 3T3-L1 adipocytes. Biochemical and Biophysical Research Communications, 353, 1080-1085. doi:10.1016/j.bbrc.2006.12.141
- Aspinwall, C.A., Lakey, J.R. and Kennedy, R.T. (1999) Insulin-stimulated insulin secretion in single pancreatic beta cells. The Journal of Biological Chemistry, 274, 6360-6365. doi:10.1074/jbc.274.10.6360
- Khoshniat, S., et al. (2011) Phosphate-dependent stimulation of MGP and OPN expression in osteoblasts via the ERK1/2 pathway is modulated by calcium. Bone, 48, 894-902. doi:10.1016/j.bone.2010.12.002
ABBREVIATIONS
SPP1: secreted phosphoprotein 1 OPN: osteopontin NFAT: nuclear factor of activated T cells CSNK2A1: protein kinase CK2 PDE: cyclic nucleotide phosphodiesterase cAMP: cyclic AMP; 3’-5’-cyclic adenosine monophosphate cGMP: cyclic GMP; 3’-5’-cyclic guanosine monophosphate NO: nitric oxide GIP: gastric inhibitory peptide GLP-1: glucagon-like peptide 1 GSIS: glucose-stimulated insulin secretion PPI: protein-protein interaction I2D: interologous interaction database PCA: principal component analysis FDR: false discovery rate IBMX: 3-Isobutyl-1-methylxanthine 8MM-IBMX: 8-Methoxymethyl-3-isobutyl-1-methylxanthine
NOTES
*Funding: This work was supported by the Swedish Research Council Project 3362 (to ED); the Crafoord Foundation, the Swedish Society of Medicine; the A. Påhlsson Foundation; and NovoNordisk Foundation, Denmark. EH was in part financed by Linné grant from Lund University Diabetes Center (LUDC).VCM and NR are supported by the NHLBI Intramural Research Program.
#Corresponding author.