Journal of Cancer Therapy
Vol. 4 No. 3 (2013) , Article ID: 31943 , 13 pages DOI:10.4236/jct.2013.43094
Correlation of Transcription of MALAT-1, a Novel Noncoding RNA, with Deregulated Expression of Tumor Suppressor p53 in Small DNA Tumor Virus Models
![]()
1Department of Dental Ecology, University of North Carolina at Chapel Hill, Chapel Hill, USA; 2Kunming University, Kunming, China; 3Department of Pathology, University of California-San Diego, La Jolla, USA; 4Lineberger Cancer Center, University of North Carolina at Chapel Hill, Chapel Hill, USA; 5Department of Microbiology and Immunology, University of North Carolina at Chapel Hill, Chapel Hill, USA; 6Center for Neurosensory Disorders, University of North Carolina at Chapel Hill, Chapel Hill, USA.
Email: cyriaquj@dentistry.unc.edu
Copyright © 2013 Liesl K. Jeffers et al. This is an open access article distributed under the Creative Commons Attribution License, which permits unrestricted use, distribution, and reproduction in any medium, provided the original work is properly cited.
Received February 21st, 2013; revised March 22nd, 2013; accepted March 31st, 2013
Keywords: p53; MALAT-1; Transcription; BK Virus; Polyoma Virus; Papillomavirus; HPV
ABSTRACT
Although metastasis-associated lung adenocarcinoma transcript (MALAT)-1 is known to be consistently upregulated in several epithelial malignancies, little is known about its function or regulation. We therefore examined the relationship between MALAT-1 expression and candidate modulators such as DNA tumor virus oncoproteins human papillomavirus (HPV)-16 E6 and E7, BK virus T antigen (BKVTAg), mouse polyoma virus middle T antigen (MPVmTAg) and tumor suppressor genes p53 and pRb. Using suppressive subtractive hybridization (SSH) and real-time reverse transcriptase polymerase chain reaction (RT-PCR) assays, MALAT-1 was shown to be increased in viral oncongene-expressing salivary gland biopsies from humans and mice. The results also indicated that MALAT-1 transcripts and promoter activity were increased in vitro when viral oncongene-expressing plasmids were introduced into different cell types. These same viral oncogenes in addition to increasing MALAT-1 transcription have also been shown to inhibit p53 and/or pRb function. In p53 mutant or inactive cell lines MALAT-1 was also shown to be highly upregulated. We hypothesize that there is a correlation between MALAT-1 over-expression and p53 deregulation. In conclusion, we show that disruption of p53, by both polyoma and papilloma oncoproteins appear to play an important role in the up-regulation of MALAT-1. MALAT-1 might therefore represent a biomarker for p53 deregulation within malignancies.
1. Introduction
Metastasis-associated lung adenocarcinoma transcript-1 (MALAT-1) is a novel large, noncoding RNA. The MALAT-1 gene, also known as the a gene, is found on chromosome 11q13 and is well conserved among mammalian species [1]. The MALAT-1 transcript, widely expressed in normal human and mouse tissue, has been shown to localize to the nucleus [2] and its 3’ end can be processed to yield a tRNA-like cytoplasmic RNA [3]. MALAT-1, which has been shown to be a potentially generic marker for epithelial carcinomas [4-7] and is greatly up-regulated in lung adenocarcinoma metastasis [1] endometrial stromal sarcoma of the uterus [7], nonhepatic human carcinomas [5] and recently was reported to be overexpressed in placenta previa and to play a role in trophoblast invasion regulation [8]. Up-regulation of MALAT-1 also has been shown to predict unfavorable outcomes of drug therapy in patients with osteosarcoma [4] and its 3’ end is an important biological motif in the invasion and metastasis of colorectal cancer cells [9]. These malignancies all have been associated with malfunction of p53 [10,11] a nuclear transcription factor that plays a role in cellular stress, including its accumulation during DNA damage and oncogene activation. P53 has been established as a key tumor suppressor, apoptosis inducer, and prognostic marker in cancer, with about 50% of human tumors encoding for a mutated p53 gene [12].
Several small DNA tumor viruses affect p53 function, including the polyomaviruses, the adenoviruses, and the papillomaviruses. These viruses play a role in the development of cancer in humans by encoding for proteins that interact with tumor suppressor genes p53 and pRb [13]. Polyomavirus large T antigen, for example, binds to and inhibits p53 and pRb [14-16]. The mouse polyoma virus middle T antigen (MPVmTAg) prevents p53-induced apoptosis through the phosphatidylinositol 3-kinase (PI3K) signal transduction pathway by way of PP2A interactions [17]. Adenovirus E1B [18] and high-risk human papillomavirus (HPV-16) E6 [19] proteins both bind to and compromise p53 function, whereas HPV-16 E7 inhibits pRb function [20].
The genomes of small DNA tumor viruses have consistently been detected in certain malignancies. HPV is consistently detected in cervical cancer [21] and in a subset of oral cancers [22], whereas BK virus (BKV) DNA has been isolated in several human tumors, both integrated into the genome and episomally, including in bone, pancreatic islet cells, the kidney, the urinary tract, the prostate, and various brain tissues [23-29]. In addition, overexpression of polyoma virus mTAg has been shown to cause salivary gland enlargement in mice and pathology similar to that observed in human salivary gland disease [30,31].
We hypothesized that MALAT-1 expression is affected by dysregulation of tumor suppressor p53. We used viruses, viral gene products, and cell lines to test the modulation of a cloned MALAT-1 promoter and to determine the effect of p53 or p53 mutants on MALAT-1 expression. We also conducted in vivo testing of MALAT-1 expression in a transgenic mouse model of salivary gland disease (SGD) and in 4 subjects with HIV-associated SGD (HIVSGD).
2. Materials and Methods
2.1. Subjects, Animals and Cell Culture
Minor salivary glands (MSG) were dissected from the lower lips of 4 HIV positive patients with SGD and from 4 healthy control subjects (with or without ranula) in IRB approved protocol at either the UNC University Hospital dental clinic or UCSF Oral AIDS Center. Biopsy samples were snap-frozen and kept in liquid nitrogen or formalin-fixed and embedded in paraffin until the RNA extraction procedure. Four MMTV/PyV-mT transgenic mice and 4 wild type mice parotid samples were kindly donated from Dr. Lesley Ellies.
HSG cells are an epithelial cell line isolated by using tissue culture techniques from an irradiated human submandibular salivary gland which showed no neoplastic lesion [32]. HSG cells were obtained as a gift from Dr. B. Baum (NIH) and cultured in McCoy’s 5A medium (Sigma). African monkey kidney cells or Vero cells (American Type Culture Collection [ATCC]) were cultured in DMEM (Sigma). All cell types were grown in medium supplemented with 10% fetal bovine serum (FBS) (Sigma), and 1% penicillin-streptomycin (pen/strep)(Gibco) unless otherwise stated and maintained in a humidified 37˚C, 5% CO2 chamber.
2.2. Suppression Subtractive Hybridization (SSH)
One to two µg of pooled biopsied salivary glands from HIV-SGD patients and pooled control (healthy persons) RNA was sent to Evrogen (Russian Republic) for SSH. In brief, SMART technology was used to synthesize cDNA, which was subsequently digested with RsaI in preparation for subtraction in both directions (HIV-SGD as driver/control as tester, and vice versa). Adaptors were ligated to the two cDNA populations, followed by two rounds of hybridization and amplification. The secondary PCR products from the two subtracted populations were then ligated into the pAL9 vector.
2.3. Sequencing of Subtracted cDNA Library
Two hundred and fifty positive clones from each of the subtractions were randomly selected and cultured in 1.5 mL LB-medium in duplicate 96-well plates at 37˚C overnight. Clones were selected by blue-white screening (Promega) and sequenced using a M13 forward promoter (-21) primer (5-TGT AAA ACG ACG GCC AGT-3) and BigDye 3.0 sequencing mix (Applied Biosystems) before analysis by capillary electrophoresis on an ABI 3700 genetic analyser (Applied Biosystems). The sequences of the inserts of differentially expressed genes were identified using NCBI Blast search (blastn).
2.4. RNA Extraction and cDNA Synthesis
Total RNA was extracted from pooled MSGs of HIVSGD patients, pooled MSGs of healthy controls, mouse parotid frozen tissues and Vero cells using RNeasy MiniKit (Qiagen,USA). Total RNA isolation from formalin fixed tissue using the Optimum FFPE RNA Isolation Kit (Ambion Diagnostics, INC) according to manufacturer’s instructions. The RNA was suspended in nuclease-free water and quantitated by UV spectrophotometry, aliquoted and stored at –80˚C. One μg total RNA from the HIV-SGD and control tissues, mice parotid tissue and Vero cells were reverse transcribed to cDNA using random primers and the SuperScriptTM II Reverse Transcriptase (RT) Kit (Invitrogen) as described by the manufacturer. Contaminating DNAs were removed by use of RQ1 DNase kit (Promega) as described by the manufacturer.
2.5. Northern Blot
Total RNA was isolated using TRizol (Invitrogen) as described by the manufacturer. Contaminating DNAs were removed by use of RQ1 DNase kit (Promega) as described by the manufacturer. 10 ug of RNA was subjected to electrophoresis and Northern blotting. MALAT-1 was hybridized with a 32P-labeled oligonucleotide probe for MALAT-1.
2.6. Semi-Quantitative and Quantitative Real-time RT-PCR
Semi-quantitative RT-PCR was performed using previously published primers for T Ag [33] and Taq Polymerase (Qiagen, USA). The following program was used for amplification: 95˚C for 2 min (1×); 94˚C for 45 sec, 56˚C for 45 sec, 72˚C for 30 sec with 2 sec increase per cycle (35×), 72˚C for 10 min (1×). Amplified cDNA was electrophoresed on 2% agarose gel (Sigma).
Real time RT-PCR was performed with LightCycler 480 Syber Green I Master Mix in the presence of transcribed cDNA and 0.25mM of gene specific primers. Experiments were performed in duplicate and β-actin was used as an internal control. Duplicate or triplicate Ct values were averaged, normalized to an average β-actin Ct value, and fold activation in healthy vs diseased tissue was calculated using the 2-ΔΔCt method. For Vero cells, gene expression values are presented as the changes (n-fold) in T Ag transcript levels, with the levels in nontransfected/mock samples arbitrarily set to 1.
2.7. Immunofluorescence, Immunohistochemistry
Frozen sections were cut from minor salivary glands (HIV-SGD and control glands) and from mouse parotid glands (transgenic and wild type) for immunofluorescent analysis. Tissue sections were fixed, blocked, then stained with either PAb416 (Genetex) antibody specific for SV40 T antigen or IgG isotype control. PAb416 has been shown to cross react with BKV Tag and is commonly used for BKV Tag detection. Both antibodies were incubated with fixed cells for 1 hr at 37˚C followed by a fluorescencein-conjugated anti-mouse (Sigma) antibody (1:20). Slides were overlaid with Vectashield (Vector Laboratories) then subjected to immunofluorescence microscopy. Formalin fixed sections were deparaffinized, and washed. Slides were incubated in 3% hydrogen peroxide and blocked and incubated with PAb416 (Genetex). DAKO LSAB+ peroxidase kit (DAKO Corporation) was used according to manufacturer’s specifications.
2.8. Plasmid Cloning, Transfection and Infection
A 5.5 kb region upstream of MALAT-1 transcription site was amplified using primers 5’GGGACGCGTAAAGAGGATTCTATCTAACAAGGA3’ and 5’GGGCTCGAGGAAACGTGAAAACCCACTCT3’ and inserted into pSeap2-Basic expression cloning vector (Clontech) using restriction sites MluI and XhoI. To determine MALAT-1 promoter activity, Vero cells were first infected with BKV as previously described [34] with 64 HAUs of virus for 24 h. At 24 h post infection (hpi), virus was removed from the culture media, cells were washed with 1× PBS and replaced with fresh medium containing the MALAT-1 promoter plasmid and β-gal construct plus transfection reagent. At stated times post transfection the cell monolayers or supernatant were collected for immunoblot assays, beta-galactosidase enzyme assay (Promega) or secreted alkaline phophatase enzyme assay (Promega) according to manufacturers instructions.
2.9. Immunoblotting
Total cell protein was extracted using 1% SDS lysis buffer (1% (w/v) SDS, 0.05M Tris.Cl pH8, 1mM DTT). Protein concentrations were determined using the BioRad protein assay, and equal amounts of protein were electrophoresed on a 10% Bis-Tris polyacrylamide minigel (Invitrogen). PAb416 (1:200) (Genetex) in 5% nonfat dry milk in 0.1% Tween-20 PBS (PBS-T) was used to detect T Ag expression and Actin (C-11)-R sc-1615-R (1:1000)(Santa Cruz Biotechnology) in 1% BSA/TBS-T for actin expression. After washing in PBS-T/TBS-T, blots were probed with a horseradish peroxidase-conjugated secondary antibody (1:10,000) (Promega). Antibody complexes were detected using SuperSignal West Pico Chemiluminescent substrate (Thermo scientific) and exposed to film (Kodak).
2.10. Beta Galactosidase Enzyme Assay
β-Galactosidase Enzyme Assay System with Reporter Lysis Buffer (Promega) was performed according to manufacturer’s instructions. Briefly, cells were collected, centrifuged and resuspended in 1× lysis buffer and transferred in triplicate to 96 well plates. Diluted sample was added to an equal volume of Assay 2× Buffer, which contained the substrate ONPG (o-nitrophenyl-beta-D-galactopyranoside). Samples were incubated for 30 minutes, terminated by addition of sodium carbonate, and the absorbance read at 420 nm with a spectrophotometer.
2.11. Secreted Alkaline Phosphatase Reporter Gene Assay, Chemiluminescent
SEAP assay was performed according to manufacturer’s instructions. Briefly, culture supernatant from transfected or mock (untreated) cells was collected at stated times post-transfection. Collected sample was diluted 1:4 in Dilution buffer, heated at 65˚C for 30 min then centrifuged at maximum speed to 30 s. Heat-treated samples were then transferred to a microplate (black or white), inactivated with Inactivation Buffer then treated with Substrate Reagent. Chemiluminescence was measured using a luminometer.
2.12. Statistical Analysis
One-way ANOVA tests were performed to determine statistically significant differences in MALAT-1 promoter activation and expression using Graph pad software.
2.13. miRNA Prediction
The entire MALAT-1 sequence was imported into an online program mfold (http://www.bioinfo.rpi.edu/applications/mfold) to predict the presence of micro RNAs within the genome.
3. Results
3.1. Differential Gene Expression in HIV-SGD by SSH
Differential gene expression in minor salivary glands from patients with HIV-SGD and healthy control subjects were examined with the use of SSH. Pooled RNA from four HIV-SGD positive subjects and from four HIV negative subjects was utilized to diminish individual variation. Two SSH libraries were constructed, disease (plus) and healthy library (minus). The minus library was enriched for genes whose expression was suppressed in HIV-SGD and the plus library was enriched for genes whose expression was induced by disease development. 250 randomly selected clones were sequenced from the minus SSH library and 250 clones from the plus library; of those 232 and 208 contained cDNA inserts, respectively. The SSH library was automatically processed using a specifically created software tool. This processing included 3 basic steps: finding adaptor sequences on the 5’ and 3’ ends of a clone as markers and extracting a fragment from the clone, blasting the batch of fragments, clustering alignments and linking with unique gene identification. We were able to align 436 sequences with known or predicted human genes. Our total number of alignments reached 502 due to 57 chimeric clones which had 2 or three clones from different RNA’s linked together during SSH. Of the 436 cDNAs 73 sequences were identified that did not match to any known or predicted mRNAs but aligned with the human genomic DNA and with EST databases. These were considered novel.
A non-redundant set of the genes was created which excluded highly expressed clones present in both disease and healthy genes in the plus library. There were 6 genes found more than once among sequenced SSH clones in each of the libraries (Table 1). It was shown previously that a number of cDNA fragments corresponding to a gene in the SSH library correlates with a degree of differential expression of the gene [35]. Considering all of the differentially expressed clones detected by SSH analysis, major functional classes of transcriptionally regulated genes in minus library included signal transduction (9%), cell cycle (8%), immune/defense (8%), synthesis/development/differentiation (8%) and transport (8%). Transcriptionally regulated genes in the plus expression library included those involved in signal transduction (15%), synthesis/development/differentiation (13%), apoptosis (8%), metabolism (8%) and transport. The largest category of de-regulated genes were unknown, among these was the metastasis associated lung adenocarcinoma transcript-1 (MALAT-1).
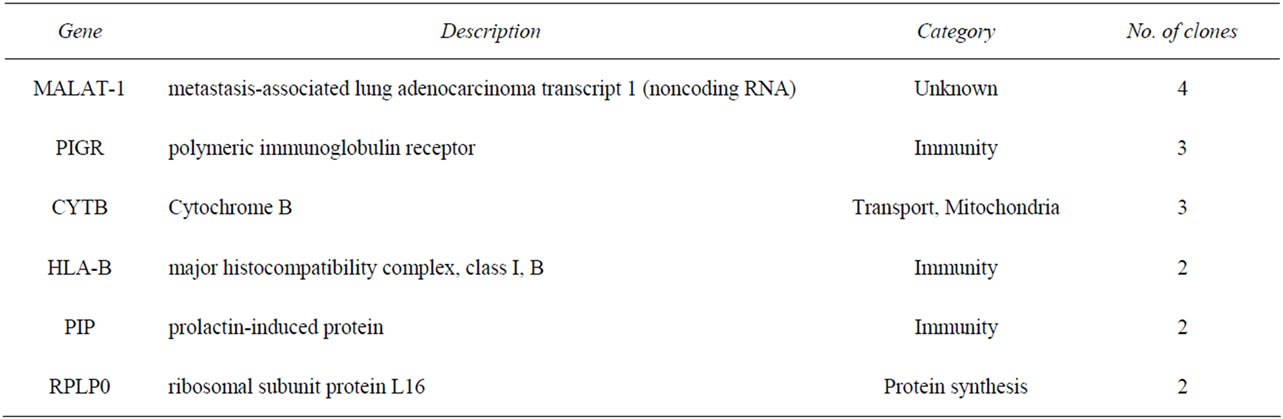
Table 1. Genes up-regulated in polyomavirus-associated salivary gland disease as assessed by suppressive subtractive hybridization.
3.2. MALAT-1 Transcript and Promoter Activity Is Deregulated in the Absence of p53 Expression, in Vitro
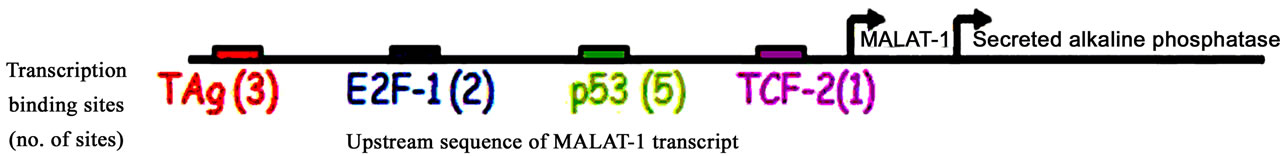
A reporter assay was developed to assess activation of MALAT-1’s enhancer/promoter region. First, we examined the MALAT-1 enhancer/promoter region 5.5 kb upstream of the ATG start site by means of open-source software (PROMO 3.0; available at http://alggen.lsi.upc.es/cgi-bin/promo_v3/promo/promoinit.cgidirDB=TF_8.3) [36]. This program identifies putative transcription factor binding sites in DNA sequences from the species (or group of species) of interest. The similarity between the sequence examined and the transcription binding site is >98% (or dissimilarity is <2%). Figure 1(a) shows the transcription sites found in the enhancer/promoter region of MALAT-1. We then quantified the MALAT-1-secreted embryonic alkaline phosphatase (SEAP) by chemiluminescent assay (Roche Diagnostic) and transiently cotransfected the reporter construct into p53-negative, sarcoma osteogenic (SAOS) cells with or without plasmids encoding wild-type p53 or p53 mutants R273H (a contact mutation), R175H (a structural mutation), H178Y, and L22QW23S [37-39]. The first two mutants are considered hot-spot mutations; that is, they abolish the wild-type tumor suppression function of p53 [40,41]. The H178Y mutant has been shown to rescue the loss of function G245S phenotype when coexpressed in vitro. The L22QW23S mutant maintains its ability to bind to p53-specific DNA elements but lacks transactivation activity[37]. Cotransfections were performed using p53 expression plasmids and MALAT-1 promoter in pSEAP vector and supernatant collected at 72 hours post transfection. Higher MALAT-1 expression levels were detected in cells that did not express p53 or that contained p53 mutations (Figure 1(b)). We also examined MALAT-1 expression profiles in cell lines containing p53 mutations (C33A, HSG), those containing DNA tumor viruses that sequester p53 (CaSki, SiHa), p53-negative cells (SAOS), and cells containing wild-type p53 (OKF6-Tert). Only the cell types expressing wild-type p53 showed low MALAT-1 levels (Figure 1(c)). These differences were statistically significant (P < 0.001).
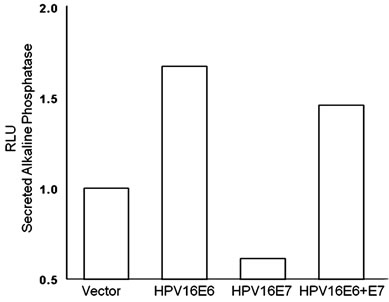
To further investigate the role of p53 in deregulating MALAT-1 expression, we over-expressed HPV16 oncogenes E6 and E7 which inhibit p53 and pRb respectively. Our results showed that over expression of HPV-16 E6 in oral keratinocytes significantly enhanced MALAT-1 expression while HPV-16 E7 did not. Coexpression of both E6 and E7 resulted in a net increase in MALAT-1 transcription (Figure 2(a)).
 (a)
(a)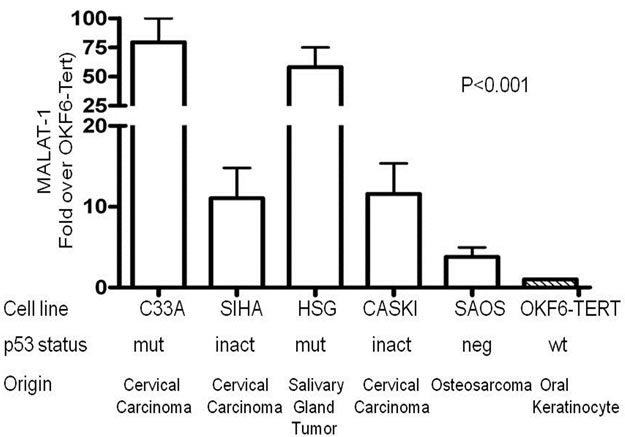 (b)
(b)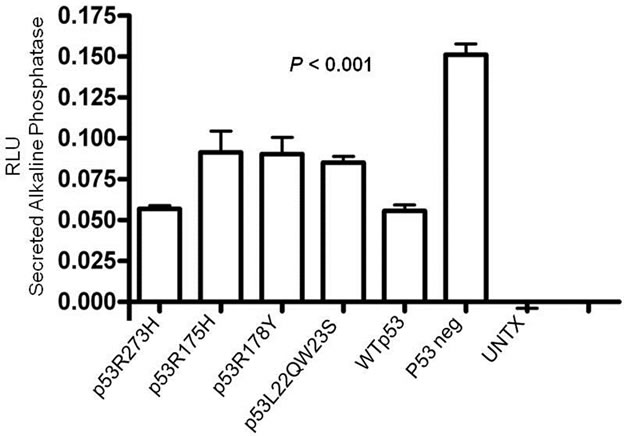 (c)
(c)
Figure 1. MALAT-1 promoter activity and transcript levels correlate with p53 activity. (a) Several consensus binding sites were detected upstream of the MALAT-1 start site, including five p53 binding sites (green), three T antigen binding sites (red), two TCF-2 binding sites (purple), and two E2F-1 binding sites (blue); (b) Representative data showing significantly increased MALAT-1 promoter activity in p53-deficient SAOS cells 72 hours after transfection with p53-expressing constructs. C. Representative levels of MALAT-1 expression in different cell types with or without p53 gene expression, presented as the change (n-fold) in MALAT-1 transcript levels (level in OKF6 cells arbitrarily set to 1).
 (a)
(a)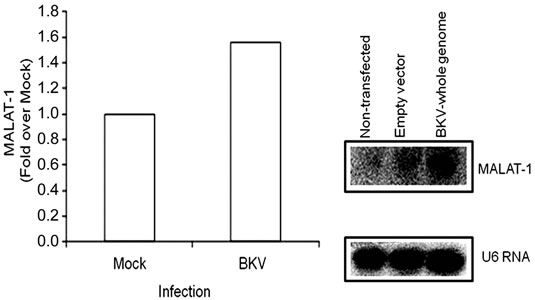 (b)
(b)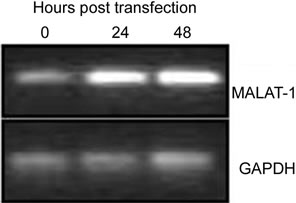 (c)
(c)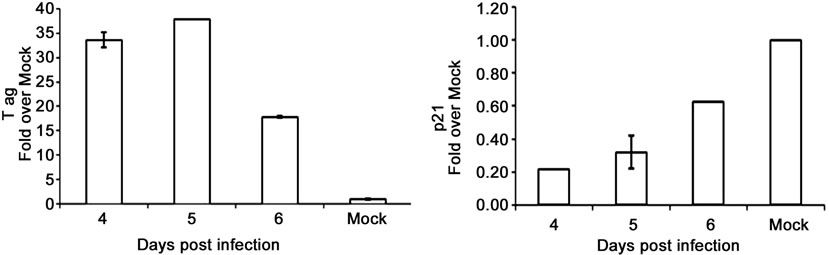 (d)
(d)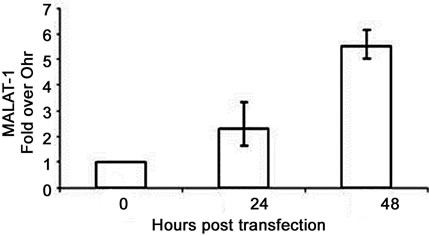 (e)
(e)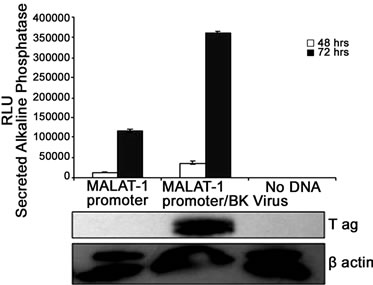 (f)
(f) (g)
(g)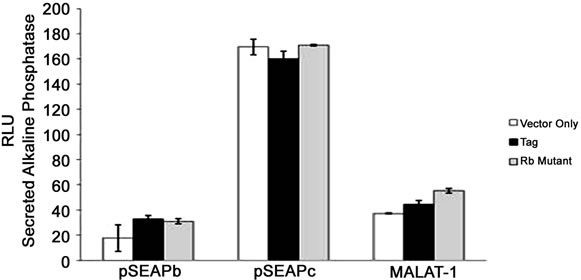 (h)
(h)
Figure 2. MALAT-1 promoter activity and transcript levels correlate with DNA tumor virus oncogene expression. (a) Representative data showing increased MALAT-1 promoter activity 48 hours after HPV16 E6 transfection and not with HPV16 E7. (b) Higher levels of MALAT-1 transcription, expressed as n-fold change in BK polyomavirus-infected human parotid gland (HSG) cells. Levels in mock samples were arbitrarily set to 1. Left. Northern blot showing a four-fold increase in MALAT-1 transcript levels in Vero cells transfected with BKV DNA. Right. (c) Semi-quantitative real-time RT-PCR shows amplified MALAT-1 cDNA bands from BKV-transfected Vero cells at stated times after transfection. (d) Quantitative real-time RT-PCR shows increased MALAT-1 transcript levels in BKV-transfected Vero cells at stated times after transfection. Expression values presented as the change (n-fold) in MALAT-1 transcript levels, with levels at time 0 arbitrarily set to 1. (e) Quantitative real-time RT-PCR showing BKV Tag and p21 transcript levels over stated times after BKV infection. (f) MALAT-1 promoter activity in BKV-infected and uninfected Vero cells at 48 and 72 hours after transfection. Top. BKV T ag protein (top) detected in Vero cells infected with BK virus and transfected with the MALAT-1 promoter plasmid. (g) BKV T ag up-regulated MALAT-1 promoter activity regardless of T ag pRb binding status in Vero cells containing wild-type p53 compare to positive and negative controls, pSEAPc and pSEAPb, respectively. (h) Neither wild-type BKV T ag nor T ag pRb binding mutant enhanced MALAT-1 transcript levels in human salivary gland cells containing mutant p53 expression.
To confirm that viral oncogenes that inhibit p53 may play a role in MALAT-1 deregulation, we infected or transfected BK virus or viral genome into HSG or Vero cells. BKV T ag binds to and inhibits p53 and pRb function[16]. Both human parotid salivary gland (HSG) and African monkey kidney (Vero) cells were used for in vitro studies because BKV has been shown to replicate in both cell types [34]. MALAT-1 transcript levels were 1.6-fold higher in BKV-infected salivary gland cells versus uninfected/mock cells 4 days after infection (Figure 2(b)). MALAT-1 transcription was also consistently increased in Vero cells that overexpressed BKV whole genome compared to empty vector and nontransfected according to Northern blot testing (Figure 2(b)). Semiquantitative real-time reverse transcriptase polymerase chain reaction (RT-PCR; Figure 2(c)), and quantitative real-time RT-PCR (Figure 2(d)) for MALAT-1 in T antigen transfected Vero cells also showed an increase in MALAT-1 transcripts. A 2.3 and 5.5 fold increase in MALAT-1 at 24 and 48 hours post transfection was detected by qRT-PCR in Vero cells.
To assess the correlation between p53 and T ag oncogene expression, we measured T ag and p21 transcript levels in BKV infected Vero cells. T antigen is known to bind to and inhibit p53 activity, while p21 is a downstream effector of p53 and would be expected to decrease in the absence of p53 expression. The results as expected indicated that p21 transcripts were low with high levels of BKV T ag expression, and high with low levels of T ag expression (Figure 2(e)). To determine whether BKV T ag expression regulates MALAT-1 promoter activity, we transfected Vero cells with the MALAT-1 promoter followed by BKV infection. MALAT-1 promoter activity was up-regulated 7-fold at 72 hours post BKV infection in comparison to uninfected. BKV T ag expression within these cells was confirmed in the immunoblot assay (Figure 2(f)).
BKV T ag comprises of several transcription binding sites including p53 and pRb. To determine whether p53 or pRb plays a role in MALAT-1 regulation, we cotransfected both Vero (wild-type p53) and HSG (mutated p53) cells with either BKV T ag or BKV T ag pRbbinding mutant and the MALAT-1 promoter expression plasmid. The results showed that MALAT-1 promoter activity was increased compared to vector only in Vero cells regardless of T ag phenotype (Figure 2(g)). Whereas, in HSG cells containing mutant p53, neither wild-type TAg nor Rb further enhanced MALAT-1 transcription above vector alone (Figure 2(h)).
Next, we investigated MALAT-1 levels in an in vivo model of BK T antigen-expressing salivary gland premalignant lesion (HIVSGD). Among all of the differentially expressed clones detected by SSH analysis, the most common category of deregulated genes was the “unknown” category, which included MALAT-1 (Table 1). Quantitative real-time RT-PCR detected a 2.6-fold increase in MALAT-1 expression in pooled DNA analysis from patients with HIVSGD versus healthy controls (Figure 3(a)). Semi-quantitative real-time RT-PCR likewise detected up-regulation of MALAT-1 in individual DNA samples from four patients with SGD (A-D) versus four healthy controls (A-D) (Figure 3(a)).
Immunohistochemical analysis of salivary gland biopsy samples from three patients with HIVSGD detected BKV T ag protein within the tissues as well as in a BKV positive kidney control with BKV nephropathy (BKVN) (Figure 3(b), top). In addition, p53 was colocalized with BKV T ag within biopsied salivary glands from the patients with SGD (representative figure, Figure 3(b), bottom). Downstream effectors of p53 (p21, PIGP-1, and WIG-1) were consistently down-regulated in semi-quantitative (left) and quantitative real-time (right) RT-PCR, whereas ING-3, negatively regulated by p53 expression and T ag was overexpressed, in both pooled cDNA (data not shown) and individual samples from patients with HIVSGD compared with healthy controls (Figure 3(c)).
In the murine model of polyomavirus-associated SGD, semi-quantitative real-time RT-PCR detected greater amplification of MALAT-1 cDNA from four transgenic mice with SGD, whereas transcripts were consistently reduced in four wild-type mice (Figure 3(d), middle). Immunofluorescence studies detected T ag within biopsied salivary glands of transgenic mice but not in the wild-type mice (Figure 3(d), top). Both ING-3 and MALAT-1 were greatly upregulated in transgenic mice versus wild-type mice in quantitative real-time RT-PCR assay (Figure 3(d), bottom).
4. Discussion
MALAT-1 is known to be up-regulated in several epithelial malignancies, including non-small cell lung tumors, stromal sarcomas, and nonhepatic carcinomas [4-7,42]. In this series of in vitro and in vivo experiments, we noted substantial MALAT-1 up-regulation in the presence of polyoma and papilloma oncoproteins that disrupt or negate p53 expression/function. In contrast, the pRb pathway did not appear to be critical to MALAT-1 regulation. Regardless of the mechanism of p53 deregulation—expression of frequently mutated p53 sites (Figure 1) or expression of tumorvirus oncoproteins targeting p53 (Figure 2 and 3)—MALAT-1 was consistently overexpressed. Thus MALAT-1 might represent a biomarker for p53 dysregulation within malignancies.
MALAT-1 expression in CaSki cells has been shown to be involved in cervical cancer cell growth, cell cycle progression, and invasion [43]. CaSki cells harbor HPV- 16, a small DNA tumor virus that encodes for the E6 protein. This protein is known to form complexes with p53 and target it for degradation [43]. In contrast, the HPV-16 E7 protein is known to sequester pRb and inhibit its normal function in the cell cycle. The enhanced expression of MALAT-1 in the presence of HPV-16 E6, and its downregulation in the presence of HPV-16 E7, lend support to the hypothesis that p53, but not the pRb pathway, appears to be critical to MALAT-1 modulation (Figure 3).
 (a)
(a)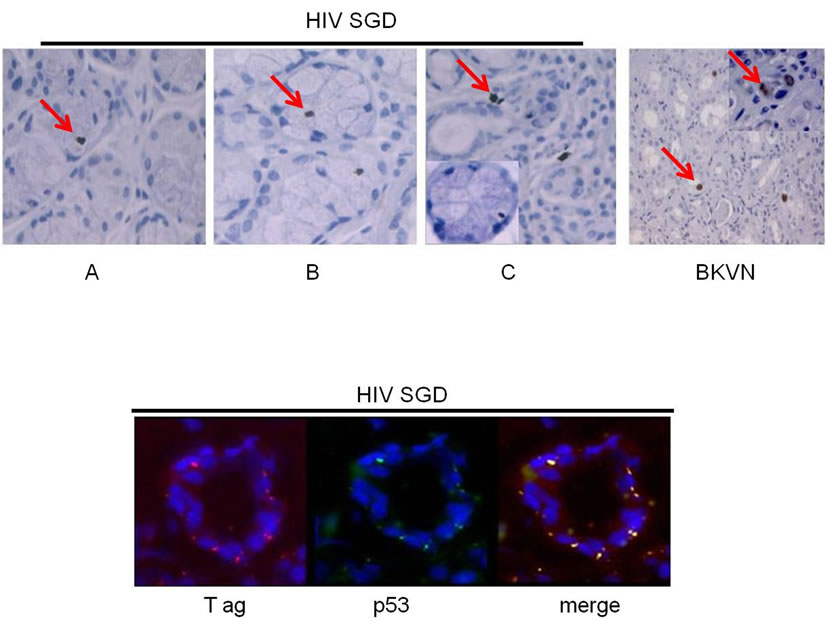 (b)
(b)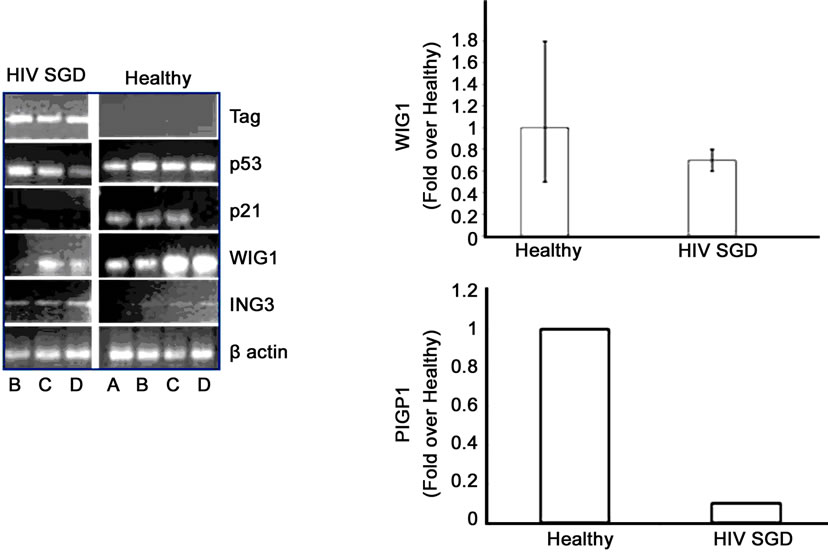 (c)
(c)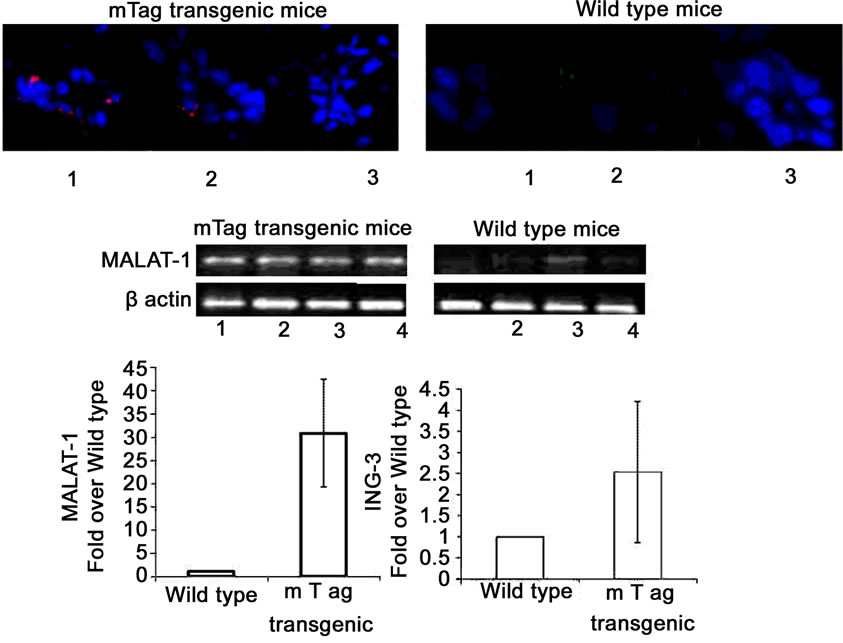 (d)
(d)
Figure 3. MALAT-1 transcript levels correlate with DNA tumor virus oncogene expression in vivo. (a) Quantitative real-time RT-PCR showing up-regulation of MALAT-1 in pooled DNA from four patients with HIV associated salivary gland disease (HIV SGD) compared with healthy control subjects, Top. Semi-quantitative real-time RT-PCR showing up-regulation of MALAT-1 in DNA from four patients with HIV SGD versus healthy control subjects, Bottom. (b) Nuclear BKVT ag (red arrows) detected via immunohistochemical analysis of representative biopsy samples from three patients with HIV-related SGD (Patient A 20×, B 40×, C 20× with inset at 40×) and in BKV-infected kidney cells from an individual with BKV nephropathy (positive control at 10×), Top. BKV T ag protein (red) and p53 protein (green) colocalized within salivary gland biopsy tissue from patients with HIV SGD (at 40× magnification). (c) Semi-quantitative (left) and quantitative real-time RT-PCR (right) showing detection of BKV T ag in HIV SGD and not in healthy controls, down-regulation of p53-regulated genes p21, PIGP1 and WIG1 and up-regulation of ING3 in salivary gland tissue from patients with HIV SGD versus healthy controls. Healthy cDNA levels were arbitrarily set at 1. (d) BKV T ag protein (red) detected via immunofluorescence in three middle T ag-expressing transgenic mice with SGD (left) compared with wild-type mice without the disease (20× and 40× magnification) (right), Top. Semi-quantitative real-time RT-PCR showing up-regulation of MALAT-1 transcript levels in transgenic mice salivary gland biopsies compared with wild-type mice, Middle. Quantitative real-time RT-PCR showing up-regulation of MALAT-1 and ING3 in transgenic mice with SGD versus wild-type mice. Wild-type cDNA levels arbitrarily set at 1, Bottom.
In normal tissues, MALAT-1 is expressed in numerous cell types, with the highest relative expression found in the normal pancreas and lung (~2.0- and 1.6-fold relative increases in expression, respectively)[1]. Its expression is also associated with epithelial cell malignancies such as non-small cell lung cancer [1] endometrial stromal sarcoma [7] and nonhepatic carcinomas [5]. Of interest, all of these cancers are associated with p53 mutation (Table 2). However, normal salivary gland cells appear to express negligible MALAT-1 [1]. Our study shows, for the first time, that the presence of a polyoma virus (BKV) is linked to up-regulation of MALAT-1 in patients with HIVSGD. Interestingly, the perinuclear BKV Tag staining pattern in HIVSGD is very similar to that detected by the Imperiale group in prostate dysplasia [2,3]. Moreover, oncoprotein expression from three distinct DNA tumor viruses—HPV-16, BKV, and mouse polyoma virus—are capable of upregulating MALAT-1 potentially via p53 deregulation.
Interestingly, using an mRNA folding prediction program it appears that the 3’ end of the MALAT-1 gene may encode a microRNA (miRNA) (Figure 4). miRNAs are single-stranded RNA molecules of 21 - 23 nucleotides in length, which regulate gene expression. miRNAs are encoded by genes from whose DNA they are transcribed but miRNA are not translated into protein, that is they are
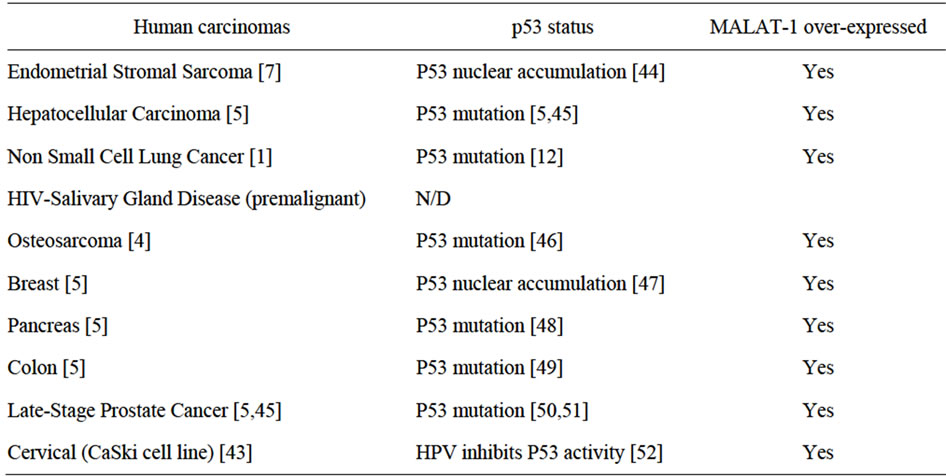
Table 2. Correlation among cancers that express high MALAT1 transcripts, involve p53 deregulation and are associated with DNA tumor virus infection.
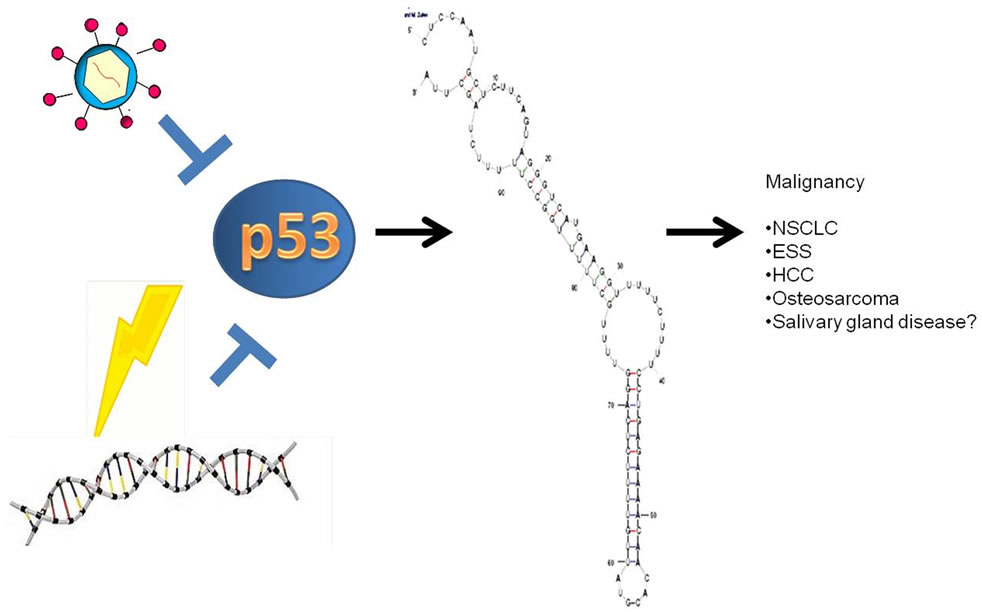
Figure 4. Model of MALAT-1 regulation including predicted miRNA at the 3’ end of the MALAT-1 RNA.
non-coding RNA; instead each primary transcript (a pri-miRNA) is processed into a short stem-loop structure called a pre-miRNA and finally into a functional miRNA. Mature miRNA molecules are partially complementary to one or more messenger RNA (mRNA) molecules, and their main function is to down-regulate gene expression. Like known miRNAs, MALAT-1 is a non-coding transcript, folds into a short stem loop structure at the 3’ end and is conserved across mammalian species. Modulation of MALAT-1 expression by p53, perhaps by miRNA regulation, is intriguing and opens the door toward understanding the regulation of this important malignancy-associated gene. Investigation of MALAT-1 as a miRNA is currently being explored and potential targets in SGD will be determined. In the meantime, MALAT-1 might represent a biomarker for p53 deregulation within malignancies.
5. Acknowledgements
Dr. Diatchenko is a cofounder and the Chief Scientific Officer of Alynomics, Inc., which has exclusive rights to develop and market proprietary genetic pain markers owned and patented by the University of North Carolina.The other authors have no potential conflicts to disclose.
REFERENCES
- P. Ji, S. Diederichs, W. Wang, S. Boing, R. Metzger, P. M. Schneider, N. Tidow, B. Brandt, H. Buerger, E. Bulk, M. Thomas, W. E. Berdel, H. Serve and C. Muller-Tidow, “MALAT-1, a Novel Noncoding RNA, and Thymosin Beta4 Predict Metastasis and Survival in Early-Stage Non-Small Cell Lung Cancer,” Oncogene, Vol. 22, No. 39, 2003, pp. 8031-8041. doi:10.1038/sj.onc.1206928
- J. N. Hutchinson, A. W. Ensminger, C. M. Clemson, C. R. Lynch, J. B. Lawrence and A. Chess, “A Screen for Nuclear Transcripts Identifies Two Linked Noncoding RNAs Associated with SC35 Splicing Domains,” BMC Genomics, Vol. 8, 2007, p. 39. doi:10.1186/1471-2164-8-39
- J. E. Wilusz, S. M. Freier and D. L. Spector, “3’ End Processing of a Long Nuclear-Retained Noncoding RNA Yields a tRNA-Like Cytoplasmic RNA,” Cell, Vol. 135, No. 5, 2008, pp. 919-932. doi:10.1016/j.cell.2008.10.012
- J. Fellenberg, L. Bernd, G. Delling, D. Witte and A. Zahlten-Hinguranage, “Prognostic Significance of DrugRegulated Genes in High-Grade Osteosarcoma,” Modern Pathology, Vol. 20, No. 10, 2007, pp. 1085-1094. doi:10.1038/modpathol.3800937
- R. Lin, S. Maeda, C. Liu, M. Karin and T. S. Edgington, “A Large Noncoding RNA Is a Marker for Murine Hepatocellular Carcinomas and a Spectrum of Human Carcinomas,” Oncogene, Vol. 26, No. 6, 2007, pp. 851-858. doi:10.1038/sj.onc.1209846
- D. S. Perez, T. R. Hoage, J. R. Pritchett, A. L. DucharmeSmith, M. L. Halling, S. C. Ganapathiraju, P. S. Streng and D. I. Smith, “Long, Abundantly Expressed NonCoding Transcripts Are Altered in Cancer,” Human Molecular Genetics, Vol. 17, No. 5, 2008, pp. 642-655. doi:10.1093/hmg/ddm336
- K. Yamada, J. Kano, H. Tsunoda, H. Yoshikawa, C. Okubo, T. Ishiyama and M. Noguchi, “Phenotypic Characterization of Endometrial Stromal Sarcoma of the Uterus,” Cancer Science, Vol. 97, No. 2, 2006, pp. 106-112. doi:10.1111/j.1349-7006.2006.00147.x
- J. J. Tseng, Y. T. Hsieh, S. L. Hsu and M. M. Chou, “Metastasis Associated Lung Adenocarcinoma Transcript 1 Is Up-Regulated in Placenta Previa Increta/Percreta and Strongly Associated with Trophoblast-Like Cell Invasion in Vitro,” Molecular Human Reproduction, Vol. 15, No. 11, 2009, pp. 725-731. doi:10.1093/molehr/gap071
- C. Xu, M. Yang, J. Tian, X. Wang and Z. Li, “MALAT-1: A Long Non-Coding RNA and Its Important 3’ End Functional Motif in Colorectal Cancer Metastasis,” International Journal of Oncology, Vol. 39, No. 1, 2011, pp. 169-175.
- R. H. Breuer, P. E. Postmus and E. F. Smit, “Molecular Pathology of Non-Small-Cell Lung Cancer,” Respiration, Vol. 72, No. 3, 2005, pp. 313-330. doi:10.1159/000085376
- F. S. Liu, M. F. Kohler, J. R. Marks, R. C. Bast Jr., J. Boyd and A. Berchuck, “Mutation and Overexpression of the p53 Tumor Suppressor Gene Frequently Occurs in Uterine and Ovarian Sarcomas,” Obstetrics & Gynecology, Vol. 83, No. 1, 1994, pp. 118-124.
- T. Soussi, “p53 Alterations in Human Cancer: More Questions than Answers,” Oncogene, Vol. 26, No. 15, 2007, pp. 2145-2156. doi:10.1038/sj.onc.1210280
- P. M. Howley and D. M. Livingston, “Small DNA Tumor Viruses: Large Contributors to Biomedical Sciences,” Virology, Vol. 384, No. 2, 2009, pp. 256-259. doi:10.1016/j.virol.2008.12.006
- D. P. Lane and L. V. Crawford, “T Antigen Is Bound to a Host Protein in SV40-Transformed Cells,” Nature, Vol. 278, No. 5701, 1979, pp. 261-263. doi:10.1038/278261a0
- M. T. S. Robles and J. M. Pipas, “T Antigen Transgenic Mouse Models,” Seminars in Cancer Biology, Vol. 19, No. 4, 2009, pp. 229-235. doi:10.1016/j.semcancer.2009.02.002
- C. V. Shivakumar and G. C. Das, “Interaction of Human Polyomavirus BK with the Tumor-Suppressor Protein p53,” Oncogene, Vol. 13, No. 2, 1996, pp. 323-332.
- W. Qian and K. G. Wiman, “Polyoma Virus Middle T and Small t Antigens Cooperate to Antagonize p53-Induced Cell Cycle Arrest and Apoptosis,” Cell Growth & Differentiation, Vol. 11, No. 1, 2000, pp. 31-39.
- P. Sarnow, C. A. Sullivan and A. J. Levine, “A Monoclonal Antibody Detecting the Adenovirus Type 5-E1b- 58Kd Tumor Antigen: Characterization of the E1b-58Kd Tumor Antigen in Adenovirus-Infected and -Transformed Cells,” Virology, Vol. 120, No. 2, 1982, pp. 510-517. doi:10.1016/0042-6822(82)90054-X
- B. A. Werness, A. J. Levine and P. M. Howley, “Association of Human Papillomavirus Types 16 and 18 E6 Proteins with p53,” Science, Vol. 248, No. 4951, 1990, pp. 76-79. doi:10.1126/science.2157286
- P. Sdek, Z. Y. Zhang, J. Cao, H. Y. Pan, W. T. Chen and J. W. Zheng, “Alteration of Cell-Cycle Regulatory Proteins in Human Oral Epithelial Cells Immortalized by HPV16 E6 and E7,” International Journal of Oral and Maxillofacial Surgery, Vol. 35, No. 7, 2006, pp. 653-657. doi:10.1016/j.ijom.2006.01.017
- D. R. Lowy, R. Kirnbauer and J. T. Schiller, “Genital Human Papillomavirus Infection,” Proceedings of National Academy of Sciences of USA, Vol. 91, No. 7, 1994, pp. 2436-2440. doi:10.1073/pnas.91.7.2436
- J. Rautava and S. Syrjanen, “Human Papillomavirus Infections in the Oral Mucosa,” Journal of the American Dental Association, Vol. 142, No. 8, 2011, pp. 905-914.
- A. Caputo, A. Corallini, M. P. Grossi, L. Carra, P. G. Balboni, M. Negrini, G. Milanesi, G. Federspil and G. Barbanti-Brodano, “Episomal DNA of a BK Virus Variant in a Human Insulinoma,” Journal of Medical Virology, Vol. 12, No. 1, 1983, pp. 37-49. doi:10.1002/jmv.1890120105
- A. Corallini, M. Pagnani, P. Viadana, E. Silini, M. Mottes, G. Milanesi, G. Gerna, R. Vettor, G. Trapella, V. Silvani, et al., “Association of BK Virus with Human Brain Tumors and Tumors of Pancreatic Islets,” International Journal of Cancer, Vol. 39, No. 1, 1987, pp. 60-67. doi:10.1002/ijc.2910390111
- D. Das, R. B. Shah and M. J. Imperiale, “Detection and Expression of Human BK Virus Sequences in Neoplastic Prostate Tissues,” Oncogene, Vol. 23, No. 42, 2004, pp. 7031-7046. doi:10.1038/sj.onc.1207920
- K. Dorries, G. Loeber and J. Meixensberger, “Association of Polyomaviruses JC, SV40, and BK with Human Brain Tumors,” Virology, Vol. 160, No. 1, 1987, pp. 268-270. doi:10.1016/0042-6822(87)90071-7
- T. Flaegstad, P. A. Andresen, J. I. Johnsen, S. K. Asomani, G. E. Jorgensen, S. Vignarajan, A. Kjuul, P. Kogner and T. Traavik, “A Possible Contributory Role of BK Virus Infection in Neuroblastoma Development,” Cancer Research, Vol. 59, No. 5, 1999, pp. 1160-1163.
- M. Negrini, P. Rimessi, C. Mantovani, S. Sabbioni, A. Corallini, M. A. Gerosa and G. Barbanti-Brodano, “Characterization of BK Virus Variants Rescued from Human Tumours and Tumour Cell Lines,” Journal of General Virology, Vol. 71, No. 11, 1990, pp. 2731-2736. doi:10.1099/0022-1317-71-11-2731
- P. Monini, L. de Lellis, A. Rotola, D. Di Luca, T. Ravaioli, B. Bigoni and E. Cassai, “Chimeric BK Virus DNA Episomes in a Papillary Urothelial Bladder Carcinoma,” Intervirology, Vol. 38, No. 5, 1995, pp. 304-308.
- M. J. Imperiale and E. O. Major, “Polyomaviruses,” In: A. M. Field, D. M. Knipe and P. M. Howley, Eds., Wolers Kluwer Health/Lippincott Williams & Wilkins, Philadelphia, 2007, p. 3091.
- J. E. Maglione, D. Moghanaki, L. J. Young, C. K. Manner, L. G. Ellies, S. O. Joseph, B. Nicholson, R. D. Cardiff and C. L. MacLeod, “Transgenic Polyoma Middle-T Mice Model Premalignant Mammary Disease,” Cancer Research, Vol. 61, No. 22, 2001, pp. 8298-8305.
- K. Shirasuna, M. Sato and T. Miyazaki, “A Neoplastic Epithelial Duct Cell Line Established from an Irradiated Human Salivary Gland,” Cancer, Vol. 48, No. 3, 1981, pp. 745-752. doi:10.1002/1097-0142(19810801)48:3<745::AID-CNCR2820480314>3.0.CO;2-7
- D. E. Rollison, U. Utaipat, C. Ryschkewitsch, J. Hou, P. Goldthwaite, R. Daniel, K. J. Helzlsouer, P. C. Burger, K. V. Shah and E. O. Major, “Investigation of Human Brain Tumors for the Presence of Polyomavirus Genome Sequences by Two Independent Laboratories,” International Journal of Cancer, Vol. 113, No. 5, 2005, pp. 769-774. doi:10.1002/ijc.20641
- L. K. Jeffers, V. Madden and J. Webster-Cyriaque, “BK Virus Has Tropism for Human Salivary Gland Cells in Vitro: Implications for Transmission,” Virology, Vol. 394, No. 2, 2009, pp. 183-193. doi:10.1016/j.virol.2009.07.022
- L. Diatchenko, Y. F. Lau, A. P. Campbell, A. Chenchik, F. Moqadam, B. Huang, S. Lukyanov, K. Lukyanov, N. Gurskaya, E. D. Sverdlov and P. D. Siebert, “Suppression Subtractive Hybridization: A Method for Generating Differentially Regulated or Tissue-Specific cDNA Probes and Libraries,” Proceedings of National Academy of Sciences of USA, Vol. 93, No. 12, 1996, pp. 6025-6030. doi:10.1073/pnas.93.12.6025
- D. Farre, R. Roset, M. Huerta, J. E. Adsuara, L. Rosello, M. M. Alba and X. Messeguer, “Identification of Patterns in Biological Sequences at the ALGGEN Server: PROMO and MALGEN,” Nucleic Acids Research, Vol. 31, No. 13, 2003, pp. 3651-3653. doi:10.1093/nar/gkg605
- J. Lin, J. Chen, B. Elenbaas and A. J. Levine, “Several Hydrophobic Amino Acids in the p53 Amino-Terminal Domain Are Required for Transcriptional Activation, Binding to mdm-2 and the Adenovirus 5 E1B 55-kD Protein,” Genes & Development, Vol. 8, No. 10, 1994, pp. 1235-1246. doi:10.1101/gad.8.10.1235
- G. Lozano, “The Oncogenic Roles of p53 Mutants in Mouse Models,” Current Opinion in Genetics & Development, Vol. 17, No. 1, 2007, pp. 66-70. doi:10.1016/j.gde.2006.12.003
- K. Otsuka, S. Kato, Y. Kakudo, S. Mashiko, H. Shibata and C. Ishioka, “The Screening of the Second-Site Suppressor Mutations of the Common p53 Mutants,” International Journal of Cancer, Vol. 121, No. 3, 2007, pp. 559-566. doi:10.1002/ijc.22724
- P. Hainaut and M. Hollstein, “P53 and Human Cancer: The First Ten Thousand Mutations,” Advances in Cancer Research, Vol. 77, 2000, pp. 81-86, 86a, 87-137. doi:10.1016/S0065-230X(08)60785-X
- A. Sigal and V. Rotter, “Oncogenic Mutations of the p53 Tumor Suppressor: The Demons of the Guardian of the Genome,” Cancer Research, Vol. 60, No. 24, 2000, pp. 6788-6793.
- Y. Sun, J. Wu, S. H. Wu, A. Thakur, A. Bollig, Y. Huang and D. J. Liao, “Expression Profile of MicroRNAs in c-Myc Induced Mouse Mammary Tumors,” Breast Cancer Research and Treatment, Vol. 118, No. 1, 2009, pp. 185-196. doi:10.1007/s10549-008-0171-6
- F. Guo, Y. Li, Y. Liu, J. Wang and G. Li, “Inhibition of Metastasis-Associated Lung Adenocarcinoma Transcript 1 in CaSki Human Cervical Cancer Cells Suppresses Cell Proliferation and Invasion,” Acta Biochimica et Biophysica Sinica, Vol. 42, No. 3, 2010, pp. 224-229. doi:10.1093/abbs/gmq008
- R. R. Nordal, G. B. Kristensen, A. E. Stenwig, C. G. Trope and J. M. Nesland, “Immunohistochemical Analysis of p53 Protein in Uterine Sarcomas,” Gynecologic Oncology, Vol. 70, No. 1, 1998, pp. 45-48. doi:10.1006/gyno.1998.5034
- S. Katiyar, B. C. Dash, V. Thakur, R. C. Guptan, S. K. Sarin and B. C. Das, “P53 Tumor Suppressor Gene Mutations in Hepatocellular Carcinoma Patients in India,” Cancer, Vol. 88, No. 7, 2000, pp. 1565-1573. doi:10.1002/(SICI)1097-0142(20000401)88:7<1565::AID-CNCR10>3.0.CO;2-9
- M. Overholtzer, P. H. Rao, R. Favis, X. Y. Lu, M. B. Elowitz, F. Barany, M. Ladanyi, R. Gorlick and A. J. Levine, “The Presence of p53 Mutations in Human Osteosarcomas Correlates with High Levels of Genomic Instability,” Proceedings of the National Academy of Science of USA, Vol. 100, No. 20, 2003, pp. 11547-11552. doi:10.1073/pnas.1934852100
- A. L. Borresen-Dale, “TP53 and Breast Cancer,” Human Mutation, Vol. 21, No. 3, 2003, pp. 292-300. doi:10.1002/humu.10174
- J. P. Morton, P. Timpson, S. A. Karim, R. A. Ridgway, D. Athineos, B. Doyle, N. B. Jamieson, K. A. Oien, A. M. Lowy, V. G. Brunton, M. C. Frame, T. R. Evans and O. J. Sansom, “Mutant p53 Drives Metastasis and Overcomes Growth Arrest/Senescence in Pancreatic Cancer,” Proceedings of the National Academy of Science of USA, Vol. 107, No. 1, 2010, pp. 246-251. doi:10.1073/pnas.0908428107
- B. Iacopetta, “TP53 Mutation in Colorectal Cancer,” Human Mutation, Vol. 21, No. 3, 2003, pp. 271-276. doi:10.1002/humu.10175
- A. G. Aprikian, A. S. Sarkis, W. R. Fair, Z. F. Zhang, Z. Fuks and C. Cordon-Cardo, “Immunohistochemical Determination of p53 Protein Nuclear Accumulation in Prostatic Adenocarcinoma,” The Journal of Urology, Vol. 151, No. 5, 1994, pp. 1276-1280.
- J. A. Eastham, A. M. Stapleton, A. E. Gousse, T. L. Timme, G. Yang, K. M. Slawin, T. M. Wheeler, P. T. Scardino and T. C. Thompson, “Association of p53 Mutations with Metastatic Prostate Cancer,” Clinical Cancer Research, Vol. 1, No. 10, 1995, pp. 1111-1118.
- M. Scheffner, B. A. Werness, J. M. Huibregtse, A. J. Levine and P. M. Howley, “The E6 Oncoprotein Encoded by Human Papillomavirus Types 16 and 18 Promotes the Degradation of p53,” Cell, Vol. 63, No. 6, 1990, pp. 1129-1136. doi:10.1016/0092-8674(90)90409-8