iBusiness
Vol.3 No.3(2011), Article ID:7481,6 pages DOI:10.4236/ib.2011.33041
Tariffication Strategies and Charging Effectivity
![]()
Department of Telecommunication and Multimedia, Faculty of Electrical Engineering, University of Žilina, Žilina, Slovakia.
Email: Cepciansky.G@zoznam.sk, Ladislav.Schwartz@fel.uniza.sk
Received December 1st, 2010; revised May 19th, 2011; accepted June 10th, 2011.
Keywords: traffic, charging, road tax, toll, probability distribution, quality of service, telecommunications, revenues, incomes, losses
ABSTRACT
The effort of all service providers is to maximize their revenues. The ideal case would be, when a service provider obtained payment for entire services provided. But it is not always possible. Some services may not be paid for. Distribution companies (electricity power, gas, and water), transport companies (airlines, railways, buses, and taxis), telecommunication companies and companies established by the government (e.g. cash of road tax) represent such type of enterprises. Their clients pay for the volume of drawn media, distance of transmission, service duration, amount of transmitted information or travelled distance. Most services are charged fully, but certain services are only charged partly or not at all. An appropriate theory concerning the service provision effectivity and charging policy will be done on examples from telecommunication business and from road tax cashing.
1. Introduction
Considering strategic intentions of a telecommunication enterprise, it is necessary to estimate revenues from telecommunication traffic and how the quality of the telecommunication network influences these revenues. Both have a strategic importance for a telecommunication operator in achieving optimal revenues and for its position in competition with other operators on telecommunication market.
1.1. Fully Charged Telephone Service
Let us consider a telephone call. The call is divided into the call units with duration, h that are charged with a rate, r of currency units depending on the type of the call (local, national, a call to the network of another operator, an internet call) and on the time of the call (peak or weak traffic, weekends, holidays). The longer the call duration is, the more the call units happen to be within the call and the higher could be the revenue for the operator. However, the longer the calls, the less frequently they are as indicated in Figure 1.
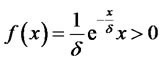
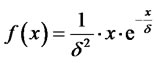
The revenue estimation is based on common knowledge characterized by a mathematical relation from probability theory [1-4], i.e. the longer the call, the less probable it is. This decrease is governed by the exponential law of the probability distribution given by the formula:
 (1)
(1)
where d is a parameter characterizing the size of decrease.
The problem is more evident from Figure 1. The whole plane under the curve f(x) is equal to 1. It can also be understood as the ratio of calls with all possible call durations to all calls (theoretically based on the condition
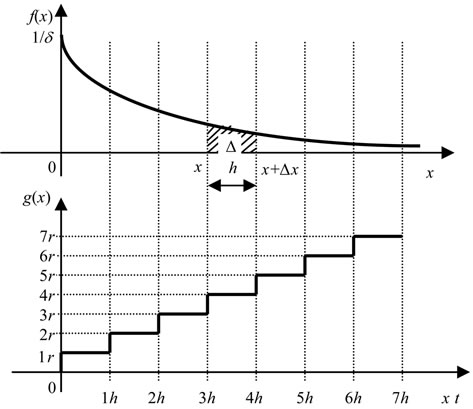
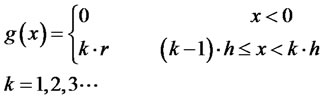
Figure 1. Stepped charging at exponential distribution.
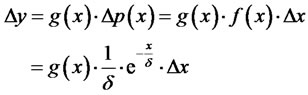
that the number of all calls would be infinite). Then the filled-in plane Dp(x) < 1 represents the ratio of calls that last from x to x + Dx(Dx = h) to all calls. For example these calls are charged by 4 call units with a rate r by means of a charging function:
 (2)
(2)
The part of calls represented by the filled-in plane Dp in Figure 1 contributes to the relative revenues (the revenue referenced to all calls) by the portion:
 (3)
(3)
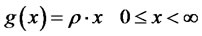
The total revenues during a monitored time will be:
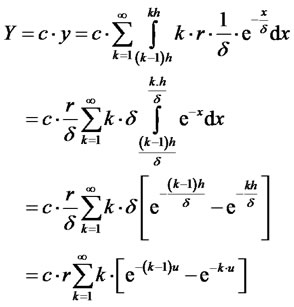 (4)
(4)
where c denotes the total count of charged calls of a given type in a given charging timeduring a monitored time period and
 (5)
(5)
Now let us determine the parameter d. In general, let us use the gamma distribution for this purpose:
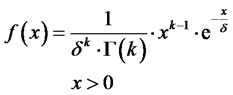 (6)
(6)
where
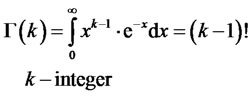 (7)
(7)
is the gamma function.
The mean value of the random variable x is:
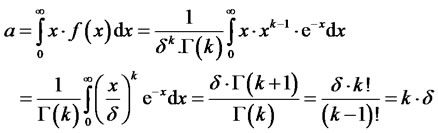 (8)
(8)
And so
 (9)
(9)
As it can be seen, the exponential distribution is the special case of the gamma distribution for k = 1.
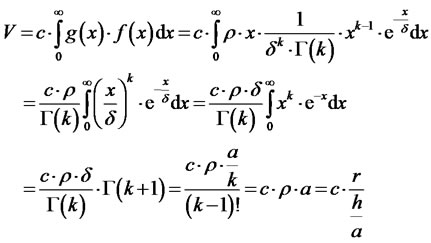
Now we can go on calculating equation (4):
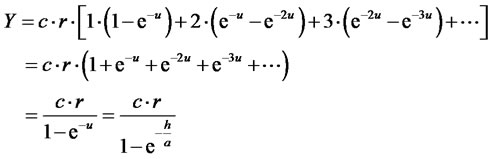
(10)
The term in brackets is the sum of the infinite geometrical series with quotient exp( ).
).
The exponential probability distribution tells that the shortest calls are most probable. This may not be always true. Therefore as the second case let us consider the gamma distribution with k = 2:
 (11)
(11)
This probability distribution is shown in Figure 2. It
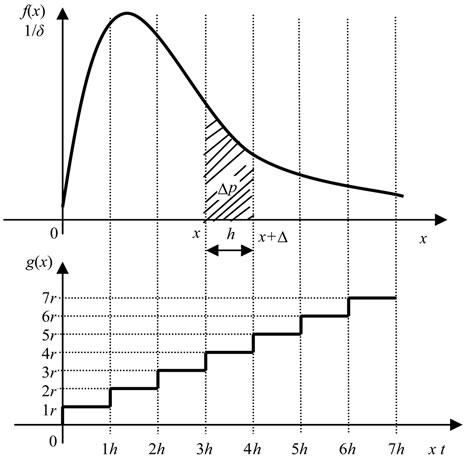
Figure 2. Stepped charging at the gamma distribution.
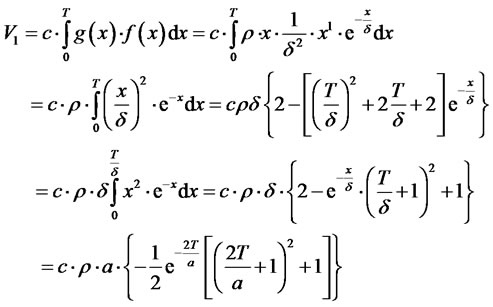
takes into consideration that the shortest calls are not the most probable. On this condition, the total revenues will be:
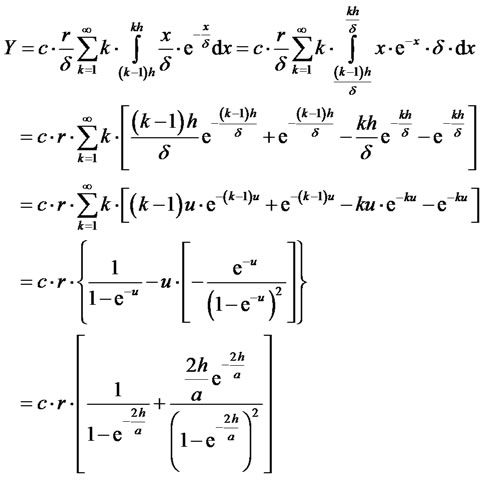 (12)
(12)
here d was replaced by (8).
Yet, this kind of charging is not fair for customers because they also pay for a part of service which they do not make use (e.g. when a subscriber makes a call shorter than the call unit). The fair charging would be, if calls were charged continuously. In that case the charging density
 (13)
(13)
shall be introduced.
Then the charging function will not be stepped like (2), but it will be continuous:
 (14)
(14)
On this assumption, the revenues will be:
 (15)
(15)
The revenues will always be the same in this case regardless of the type of the probability distribution.
1.2. Partly Charged Telephone Service
When a telecommunication operator intends to attract more clients, it may make a decision that telephone conversations will be charged only partly. It may only charge an initial part of the call up to a time T or a rest of the call after a time T. Let T include n call units h:
T = n · h (16)
1.2.1. Exponential Probability Distribution
In case, when initial n call units are charged, the revenue from the charged part of the call can be calculated according to (4):
 (17)
(17)
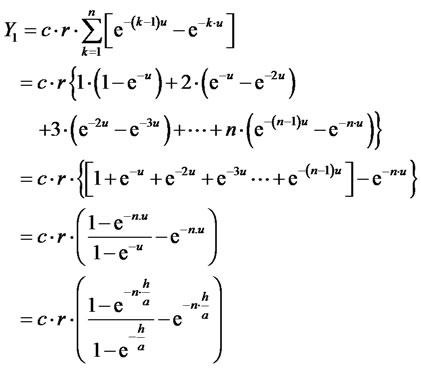
Conversely, when initial n call units are free of charge, the revenue from the rest of call units will be:
 (18)
(18)
In case of flat charging according to (15), the revenue from the charging of calls within interval 0 < x £ T will be:
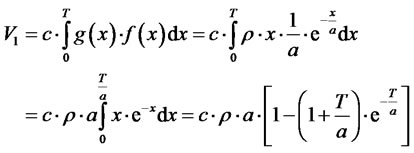 (19)
(19)
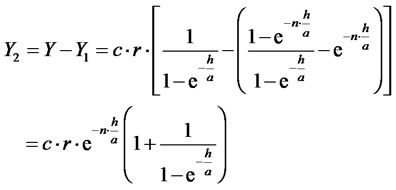
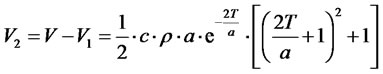
Conversely, when the rest of the call in time interval T < x < ¥ will be charged, the revenue will be:
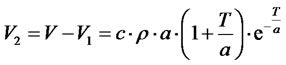 (20)
(20)
1.2.2. Gamma Probability Distribution
Issuing from Equations (12) and (15), it can be derived:
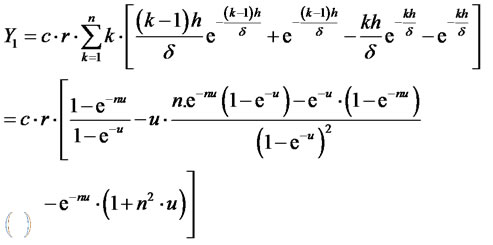 (21)
(21)
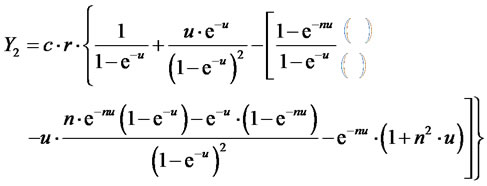 (22)
(22)
here  according to (5) and (8).
 (23)
(23)
 (24)
(24)
here  according to (8).
1.3. Charging Effectivity
Let us introduce the term charging effectivity in order to compare various kinds of charging.
To compare the stepped and flat charging, the ratio  can be an appropriate measure:
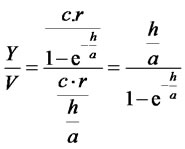 (25)
(25)
in case of the exponential distribution and
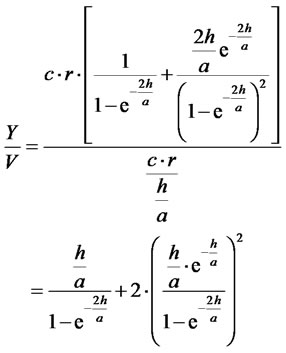 (26)
(26)
in case of the gamma distribution (see Figure 3).
The effectivity curves for the exponential and gamma distributions are almost the same. When the call unit h ® 0, the  in both cases. The gain rapidly grows at ratio
 . If the call unit would be equal to the mean busy time, the operator would gain 50% - 60% more revenues. Actually, the call unit h = 1 s and the mean busy time varies about 100 s. Then
  and
and . In deed, the operator only gains 0.5% more revenues.
Some operators, especially mobile ones, stop charging at specific calling programs when a call lasts longer than a certain number of call units or the call exceeds a certain time T. Of course, they risk losses on revenues. As the call units are very short (h = 1 s), the flat charging will do to take into consideration. The ratio  is interesting from this point of view. The task is to determine how long the time limit T may be in order that losses may not exceed a given value performed by the ratio
 :
:
 (27)
(27)

Figure 3. Comparison of relative revenues.
in case of the exponential distribution and
 (28)
(28)
in case of the gamma distribution.
Now it is necessary to calculate the ratio  as a function of the ratio
 . The equations (27) and (28) are the transcendent ones and they must be calculated by iterations. The results of this calculation are plotted in Figure 4. An example: if an operator does not want to loose more than 0.3% on revenues, it should not stop charging for call durations shorter than 5 - 8-times of the mean busy time depending on the probability distribution. The charging effectivity would be 99.7% in this case.
2. Road Tax
The road taxhas been introduced for all trucks on the highways and on the 1st class roads in Slovak Republic from the beginning of the year 2010. Toll gates have been built-up where the trucks are registered by means of the satellite global positioning system (GPS). The toll gates divide the highways and the 1st class roads in segments. Each road segment is charged for those types of cars. Going on a highway, a driver pays for truly driven distance, as the toll gates are placed on all highway gateways. But the problem emerged with the 1st class road tax. The road toll gates have not been installed on each crossroad where an uncharged road of lower category or subways issue on the charged1st class road. Thus a car can also enter or leave the charged road out of the crossroad with the toll gate. In this way, a driver would have had to pay for the whole road segment, even if he had used only a small part of it. This strategy was shown as unfair and it became a reason for mass protests of conveyors. Therefore the Slovak government had to retreat and to meet the conveyors’ requirements. The con-
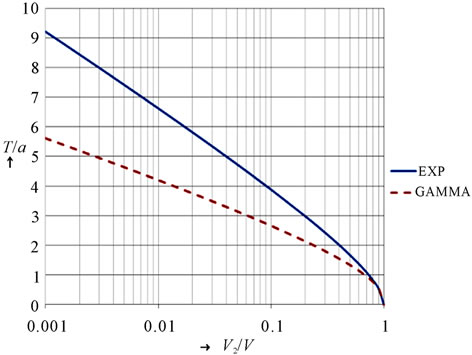
Figure 4. Relative losses.
sequence is that drivers need not pay for the road segment which was only used partly. But in this way, the state looses a part of incomes from the road tax. The shorter the road segments are the lower losses happen. The question is which portion of incomes will be lost depending on the segment length?
We can proceed similarly as in Chapter 1. Here the random variable x in the probability distributions (1) or (11) performs a travelled distance and the filled-in planes under curves f(x) in Figures 1 or 2 represent the ratio of trucks that travelled a distance from x to x + Dx to all trucks travelling on the 1st class roads where Dx = h is the length of a road segment and a is the mean travelled distance. To assess the losses resulting from the fact that the first road segments are free of charge, the ratios  should be taken into account for n = 1 uncharged road segment. Assuming that the entire number of road segments is high enough (actually they are about 800 and should be enhanced) and road segments are relatively short, we can use the ratios
 :
:
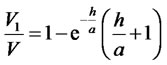 (29)
(29)
in case of the exponential distribution and
 (30)
(30)
in case of the gamma distribution.
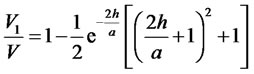
Figure 5 shows the computation results. An example: If losses shall not behigher than 0.5% on revenues (charging effectivity 99.5%), uncharged road segments should not be longer than 0.10 - 0.17 of the average distance travelled by all trucks on the 1st class roads.
3. Final Remarks
The fundamental condition is that the exponential, eventually the gamma probability distribution can be applied.
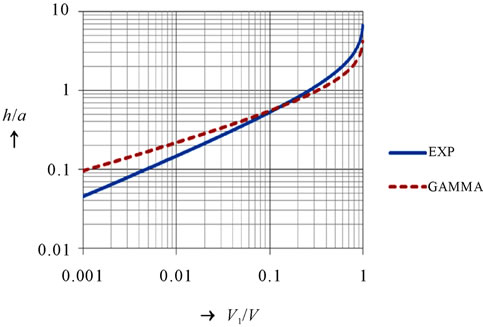
Figure 5. Relative losses.
This assumption is fulfilled in telecommunication traffic very well. The necessary data that confirm it can easily be acquired from the management information base of a telecommunication operator.
Comparison of relative revenues on condition of the exponential or the gamma probability distribution shows that there is not a substantial difference in relative revenues at stepped and flat charging as it can be seen from Figure 3.
In case of the road tax, the mean travelled distanceneed to be searched statistically which is out of scope of this paper.
Should a distribution company decide from some competition reasons not to cash money for initial drawn energy, it may use the above theory to calculate marketing effects from this measure.
The studied topic is to be understood as a mean for anticipation of future incomes which an enterprise is not able to gain from the actual information database and as a mean of estimation of business effectivity in the future.
REFERENCES
- J. S. Ventceľ, “Teóriapravdepodobnosti (Theory of Probability),” ALFA-SNTL, Bratislava-Prague, 1973, p. 522.
- J. Likeš and J. Machek, “Matematickástatistika (Mathematical Statistic),” SNTL, Prague, 1983, p. 178.
- J. Likeš and J. Machek, “Početpravděpodobnosti (Count of Probability),” SNTL, Prague, 1987, p. 159.
- G. Čepčiansky and L. Schwartz, “A Note on Tariffication Strategy Cases in Telecommunications,” Business and Economics, Vol. 9, No. 2, 2008, pp. 95-103. doi:10.1007/s11066-009-9035-4