Journal of Geographic Information System
Vol.07 No.06(2015), Article ID:62391,15 pages
10.4236/jgis.2015.76055
Lead and Copper Mineral Prospectivity Mapping in Kalatereshm Area, Based on Exploratory Data Sets Using AHP-Index Overlay Modeling in GIS (Semnan Province, North of Iran)
Seyed Milad Ahmadi*, Alireza Jafarirad, Nima Nezafati
Department of Geology, College of Geology, Tehran Science and Research Branch, Islamic Azad University, Tehran, Iran

Copyright © 2015 by authors and Scientific Research Publishing Inc.
This work is licensed under the Creative Commons Attribution International License (CC BY).
http://creativecommons.org/licenses/by/4.0/


Received 20 November 2015; accepted 26 December 2015; published 30 December 2015
ABSTRACT
The Kalatereshm is an area in north of Iran which covers some part of Torud magmatic belt. The area of this belt is about 2000 square kilometers and most of the mines in this particular area are of Copper, lead and Zinc. The Synthesis process is done by the Analysis Hierarchy Process (AHP) and Index Overlay (IO) methods. Of previous studies on the area, various companies providing Geological maps and in particular the company of Jiangxi providing its own geochemical maps can be mentioned. The reasons for doing this research and its innovation in Kalatereshm’s sheet can be justified as to be valuable and the fact that we would be able to save in time and cost by doing so. Previous case studies on this particular region lacked the necessary use of an advanced software and method. The informational layers included geochemical layers (the second and first ratings were given to Copper and Lead respectively by weighting based on AHP method), geology layer (the fourth and second ratings were given to Copper and Lead respectively by weighing based on AHP method), fault layer (the first and fourth ratings were given to Copper and Lead respectively by weighting based on AHP method), satellite imagery layer (the third rating was given to both Copper and Lead by weighting based on AHP method) and the more applicable areas for field exploration and detailed procedures of exploration had been determined (the mentioned ratings were delineated by each element’s respective weight in each layer and their importance in the Synthesis of informational layers).
Keywords:
Kalatereshm, Mineral Prospectivity Mapping, AHP, Index Overlay

1. Introduction
Mineral prospectivity analysis and quantitative resource estimation have been recognized as important when integrating multi-source geology spatial data in recent years. The statistical and mathematical approaches developed recently for multi-resource geological spatial data integration include Weights-of-Evidence (WoE) and logistic regression [1] .
Mineral prospectivity modeling seeks to delineate areas that are likely to hosts mineralized zones. This is accomplished through the process recognition criteria, creating maps of this recognition criterion (predictor maps) and weighting and combining these maps to produce the final prospectivity map [2] .
Integration with other specialized program for Geophysical data and image processing is easily done with GIS. Raster images, such as Satellite imagery or Geophysical images can then be displayed in GIS and overlaid with vector data such as Geology, Faults and Geochemical samples. Mineral targeting can be done based on multi evidence maps analysis, either using qualitative or quantitative methods [3] .
GIS has the potential for storing, updating, retrieving, displaying, processing, analyzing and integrating various geospatial data [4] .
GIS can produce mineral potential maps easily and integrates the results of different investigations such as Geological, Geophysical and Geochemical studies [5] [6] . Using a powerful method for weighting of the information, GIS can provide a better prediction on the potential of mineralization under the ground [7] .
Mineral deposits are extraordinary anomalies in the earth that provide us with perhaps the clearest evidence for the past flow of solutions through faults, fractures and porous rocks that, in the process, dissolved, transported and concentrated elements of economic interest [8] . A diagnostic feature of Porphyry copper deposits is the large volume of altered rocks included in their composite system. Those alterations, including Copper mineralization, are the result of circulation of hydrothermal fluids of diverse origins. This contribution will discuss the nature of alteration in Porphyry copper system and the characteristic of inclusions which preserve the fluid that produced it [9] .
The past quarter century has been major advances in the understanding of the genesis Mississippi-Valley- Type (MVT) Lead-Zinc deposits. Until the early 1980s many workers believed that plate tectonics played no direct role and that MVT mineralization required little more than the presence of platform carbonates. Recent studies have shown instead that most (though not all) MVT deposits were produced by enormous fluid systems that migrate thorough foreland basins, driven by gravity from an adjacent orogenic belt (e.g. Graven, 1985; Ge and Graven, 1992; Appold and Graven, 1999; Leach et al., 2001a) [10] .
The purpose of this research is to provide potential maps from Lead and Copper applicable areas which are done by the synthesis of informational layers that illustrates areas which have potential for advanced exploration.
2. Geological Setting
The Kalatereshm’s 1:100,000 geological sheet is located on the 54˚ to 54˚30' eastern longitude and on the 35˚ to 35˚30' northern latitude. The area is about 2500 square kilometers. This region is located in south of Damghan and east of Semnan, and covers the southwest part of Torud 1:250,000 sheet (Figure 1 and Figure 2). Most of the previous studies are about providing Geological and Geochemical maps and we are going to cite some of them here.
A Geological map has been published by the national oil company of Iran which is in scale of 1:100,000. The 1:250,000 map has been provided by the Geology organization of Iran by M. Alavinaeini et al., in the year of 1978. From the two mentioned maps, one can find the overall Geology information, the process of outcrop, the structural elements and the position of the area being analyzed in the structural zones. The map of Torud in 1:250,000 scale has been provided by the M. Alavinaeini et al., and its associated report has been done by A. Hooshmandzade and et al. and has been published by the Geology organization of Iran. Reyre and Mohafez

Figure 1. Kalatereshm 1:100,000 sheet on Semnam province in north of Iran.
have done some researches on the Sedimentary basin of this area in 1972 which also includes the Chah-shirin. Urdea and Melak poor have done researches on the Lead and Copper distribution in the area of Kalatereshm. Some researches have also been done in the department of mines and metals of Semnan which have been produced by the prospector engineers in the year of 2001 in the entire of Semnan Province and the private sectors have also done some researches on the diverse minerals on the area. Providing 33 geological maps from the stream samples by the Chinese company of Geochemical and Geophysical (Jiangxi) in the year of 1995 in the 1:100,000 sheet of the Kalatereshm (Geological Survey of Iran).
Eocene-oligocene Pyroclastic Igneous and Sedimentary rock units have a great diversity in the Kalatereshm sheet’s range, as they cover most of the northern half. This Tertiary Volcanic-sedimentary series covers the older units in the process of unconformity. The thickness of this complex can be estimated to be around 3 kilometers.
Based on the Geochemical and Petrography studies on Igneous rocks of this region, they are considered to be intermediate Igneous rocks which mostly include Andesite, Basalt andesite, Trachy-andesite, Dacite and Ryolite.
Based on the Petrographic studies done on these rocks it is clear that they have undergone a very weak alteration (Green schist facies). In this alteration, the fluid pressure and temperature have played an important role. These alterations have caused the high mobility elements to be displaced which from these processes include Argillitic transformation and Carbonatization and etc which have caused to rocks to be positioned at the range between Alkaline and Sub-alkaline.
3. Methodology
In this article, each of informational layers (Geological layer, geochemical layer, Fault layer and Satellite imagery layer) has been integrated based on their priority. The integration of these informational layers has been done using the Arc GIS software by Index Overlay Modeling and the evaluation of these informational layers has been done in the Expert Choice software. Weight of Evidence in contrast uses the statical analysis of the map layers being used with a training data to make less subjective decisions on how the map layers in any model are combined. Bonham-Carter (1997) gives a good summary of the maths and algorithms used in Weights of Evidence and Partington (2000), Partington and Smillie (2002) and Rattenbury and Partington (2003) give examples of how this technique can be applied to geological datasets [11] (Table 1).

Figure 2. Geology map of Kalatereshm 1:1,000,000 sheet.

Table 1. Flowchart of used steps to introduce the appropriate areas for lead and copper.
4. Informational Layers
In the different levels of this article, the data related to various informational layers participating in the Synthesis have been processed so that they would be ready for the final Synthesis and evaluation. At first according to the Geological layers which have the highest relation to Lead and Copper as host rocks. Secondly the findings of the Geological organization from the stream samples of the region which are 806 in number and in 1.4 kilometers intervals and an analysis for 30 elements which is done by the Geological survey of Iran using the ICP-EOS method by, although these same operations have not been undergone in the Alluviums and Sedimentary layers which are located in the south and southwest part of the sheet (Figure 3). In addition the correlation rate of Copper and Lead with other elements in the templates of the Spearman (with raw data) and Pearson correlations (with normalized data) will be studied so that one could determine from which elements should we produce Geochemical maps and which maps should be scored based on their Synthesis. In other hand we have aster alterations that can help us to find out which part of the Kalatereshm’s sheet has the proper alterations for prospecting Lead and Copper. After the previous steps, we should assign weights to every informational layer and this assignment is done by the Expert Choice software after which the Synthesis for applicable areas is indicated by the Index Overlay modeling in the Arc GIS software.
The use of GIS in mineral exploration is now beginning to spread, allowing the integration of disparate digital data set into a single, unified database. The recommended approach is to compile all of the available Geoscientific data within the GIS in a context of an exploration model in order to produce a mineral potential map [3] .
4.1. Geochemical Layer
Mineral exploration Geologists commonly analyze Stream sediment and Soil samples collected from watersheds as a Geochemical indicator of potential mineral deposit. Stream sediment represent an integrated sample of materials that have been weathered and transported from Soils and Bedrocks that are exposed upslope. Historically,

Figure 3. Sampling network of Kalatereshm sheet.
Stream sediments have been used as part of a mineral exploration strategy since the first explores began researching for precious metals [12] .
Geochemical ground samplings are done through lithogeochemical method for witch 806 samples with the intervals of 1.4 kilometers exist. The method used for analyzing these samples is ICP-EOS with the detection limit of 5 ppm for both Pb and Cu which is implemented by the GSI. To ensure the accuracy of quality control and the precision of the laboratory which analyzed the samples, the method of exact duplicate samples was implemented. In order to draw the raw and normalized data (SPSS software) the skewness and kurtosis parameters have been used for which the normalized parameters for skewness and kurtosis have been set respectively from −0.2 to 0.2 and from 0 to 3. Also the amount of missing data for normalized data is considered to be from 5% to 7%. The normalization of data is done in order to determine the outlier proportion so that the mean of data could be used to draw symmetrical histograms and to achieve normalized distribution. After normalizing the data, at first the data are organized by the SPSS software in which the frequency of each data whether raw or normalized is shown in Diagram 1.
After this process the data are organized using the methods of Spearman and Pearson so that correlation of the elements Pb and Cu with other elements could be determined. If in any case while using one of these methods, each of these two mentioned elements showed strong correlation with other elements in the tables, this correlation would take part in the production of geochemical maps, maps form the aster scenes (alterations), geological layers and finally in the production of the final maps of anomalies by using methods of AHP and index overlay. In order for the anomaly maps to enter the Synthesis, anomalies from the two selected elements (which are mentioned above) should be produced by the Fractal’s concentration-area method so that they would show an acceptable breakdown of the threshold range of the raw data, But keep in mind that geochemical data are compositional data and the data gathered by analyzing them would prove to be non-practical and spurious (closure
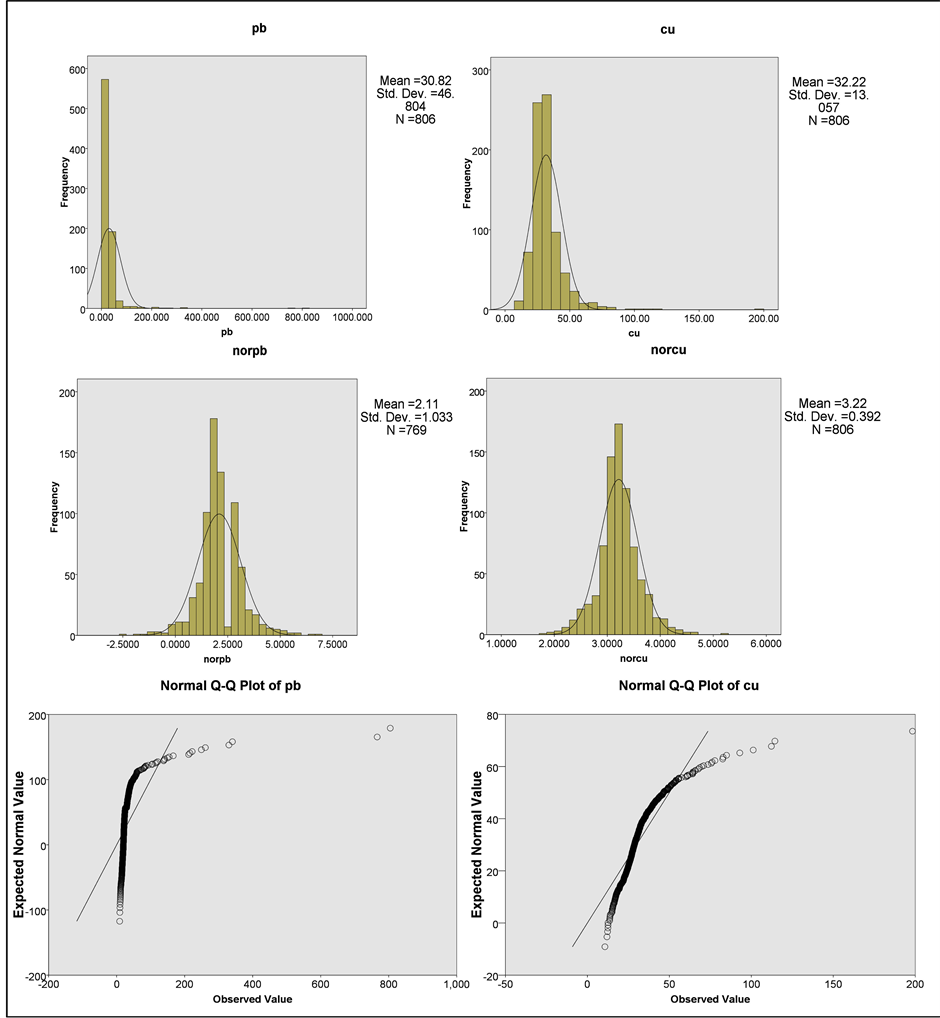
Diagram 1. Graphs of raw and normal data and QQ-plot diagrams.
problem), and as far as the correlations go, none of the elements had any substantial correlation with these two elements (Pb and Cu) to be used in the next stages of our study. Next the plotted graphs of raw data will be shown by using the Fractal concentration-area method which in these graphs the threshold range for the two elements of Lead and Copper has been obtained and a Geochemical map has been produced. The fractal area-concentration method has been used for obtaining the threshold estimation (Normalized data). This method was introduced by Cheng in 1994, a model in which as the grade of an element increases, the area it occupies decreases. In this method used for drawing the cumulative diagram of the elements, the X axis represents the grade and the area assigned to each grade is represented by the Y axis in which the lines vertical to X axis show the threshold estimation of each element. (Diagram 2) Based on this figure it is clearly obvious that as the grade increases, the area occupied by that element decreases (Table 2 and Table 3).
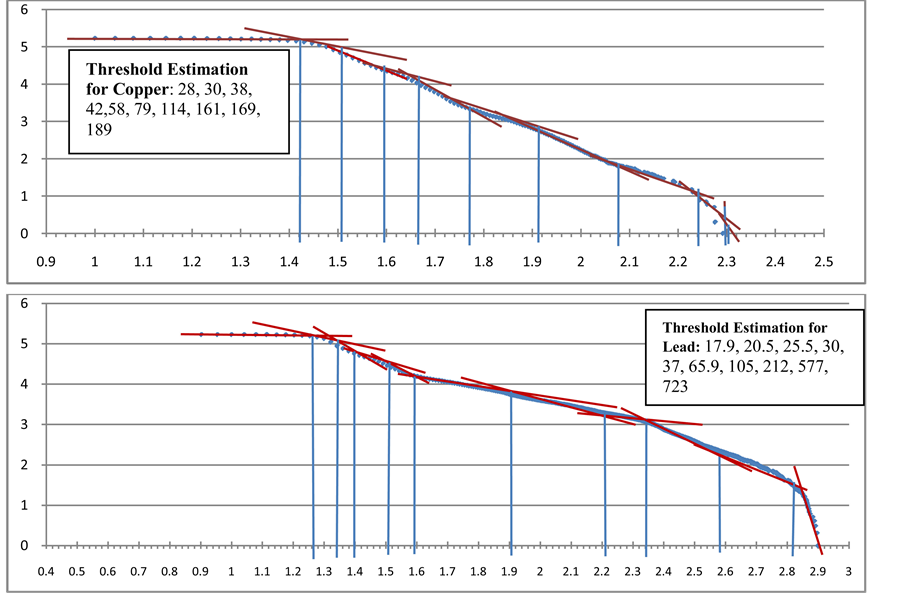
Diagram 2. Threshold estimation for copper and lead in fractal method.

Table 2.Correlation of normal data with Pearson method.

Table 3.Correlation of raw data with spearman method.
4.2 Satellite Imagery Layer
In this part, the translocation of the Aster scenes on the Kalatereshm’s sheet and Semnan province has been illustrated and some of the existent anomalies in the region which have been given scores for Synthesis will be illustrated in Figure 4 and Figure 5.
5. Synthesis of Informational Layers
In this section, all the informational layers have their respective scores from 1 to 10 which are given based on the type of the host rock and the existent of more Faults in the layers. We can also say that the basis of selection in geochemical layer is the existent correlations observed between elements in the Spearman and Pearson methods which due to the lack of strong correlations in these two tables, only the two elements of Lead and Copper have been chosen for the Synthesis process, And for the Aster images one can obtain the most efficient alterations for Copper and Lead for the final Synthesis on the basis of the A. Kalinowski, 1990 and S. Oliver, 2004 studies. As for the Fault density map, one can say that because of the undeniable role of Faults in conducting the solutions which contain Copper and Lead, the rated Fault density layer will be in the final Synthesis. In the next figures, the scores related to the Geological layers which are segregated from the main map and also the description for each of the layers has been presented, Table 4 and Table 5 (Figures 6-9). The produced Geochemical maps of Lead and Copper using the Fractal concentration-area method have been scored from 1 to 10 based on the scoring basis in which 1 is the least score and 10 is considered the maximum. As for anomalies, for the element Lead we can name the Carbonate (rating 3) and Silicate (rating 2) anomalies and for Copper the advanced Argillic (rating 4), Phyllic (rating 3) and Carbonate-Chlorite-Epidote (rating 2) anomalies. Making comparison between each possible pair in each cluster, this gives a weighting for each element within a cluster and also a consistency ratio [13] .
AHP is a theory of measurement through pairwise comparisons and relies on the judgment of expert to derive priority scales [14] .

Figure 4. Coverage of ASTER scenes on Kalatereshm sheet and natural colors on aster image.

Figure 5. Alteration map using ASTER images.

Table 4. The scores given to geological layers of copper.
Table 5. The scores given to geological layers of lead.

Figure 6. The scores of geological layers for lead and copper.
The synthesis procedure is first explained to the participants, the judgment are elicited and then synthesized. This approach maybe compared with what one would obtain if each of the participants were to be included as a decision maker in the hierarchy and all participate to compare the relative merit of each in providing judgments to make the decision according to a given set of criteria. Then, one proceeds to obtain judgments from each of them separately on the issues, synthesizing the final results [15] .
Logistic Regression (RL) is a model that can be established when some samples of the response are known [16] .

Figure 7. Density map of faults.

Figure 8. Anomaly maps and respective scores for lead and copper.

Figure 9. The maps of carbonate and silicate alteration and advanced argillic, phyllic and carbonate-chlorite-epidote alteration that will be used in synthesis.
So it is a data-deriven approach and does not depend on the opinions of experts [17] .
After giving scores to the informational layers, these layers will be weighted in the Expert Choice software so that these weights could be used in producing the final maps of applicable areas for more advanced ground exploration of Lead and Copper using the Index Overlay model. In the following tables in which the informational layers are determined based on weighting, the Fault layers are of more importance because of their conductivity of solutions containing minerals for forming deposits, the Geochemical layer is at the second row due to sampling and the Geological layers and the Aster images are next based on their relative importance and under the influence of expert opinions. The Overall Inconsistency for Lead in Expert Choice software is 0.4 and for Copper is 0.07 (Table 6 and Table 7).The procedure chose to rate each layer is based on mineral deposit model in which copper formation is disseminated and lead formation is as MVT. The reason for allocating the highest weight to the fault layers of copper and lead deposits is due to ore fluids being steered to the host rocks. The reason for choosing the second rating for the geochemical layers obtained from ground sampling is due to this layer being more accurate and reliable than RS and geology layers. The alteration layer for copper deposit gains more significance in the third rating because of the disseminated ores of copper having unique alteration for remote sensing purposes. The geological layer for lead deposit is at the third rating and the reason for this choice is due to the existence of MVT deposits in the carbonate layers.
In the case of types of mineralization in the rocks of the area, disseminated types for copper deposits and hydrothermal types for lead deposits can be mentioned which are tectonic structures for controlling mineralization. The host rock for lead deposits in the area mainly consists of meta-dolomite and also has meta-limestone in smaller amounts. For the copper deposits of the area, intrusive andesite masses can be mentioned. On the matter of the age of the host rocks of these deposits, Miocene and Eocene can be named for the copper deposit and Ordovician and Silurian for lead deposit.
After integrating the informational layers, the applicable areas are illustrated as in the below figure in which the Red areas have the priority for more advanced stages of ground exploration, sampling and trenching (Figure 10).
6. Conclusion
Copper anomalies are existent in the northern part of the sheet in the Andesite, Dacite, Andesite-basalt units. Lead anomalies can be found in the Calcareous, Sandstone and the Metamorphosed dolomitic units. There is the possibility of discovering more areas for prospecting purposes because of the scope of applicable areas. Because
Table 6. Weights of informational layers for copper in AHP method.
Table 7. Weights of informational layers for lead in AHP method.

Figure 10. The final maps for illustrating suitable areas with IO model and AHP method.
Table 8. The table of space priorities of lead.
of the proximity of paragenesis and the accompaniment of the element Lead with Zinc, the final determined areas for Lead can also be used for mining Zinc. Mathematical techniques and weighting patterns implemented on the participating factors of the study will lead to the possibility of finding one or more minerals and also the possibility of saving in time and cost and obtaining broader areas for ground exploration after integrating the expert opinions and using the mathematical algorithms (Table 8).
Cite this paper
Seyed MiladAhmadi,AlirezaJafarirad,NimaNezafati, (2015) Lead and Copper Mineral Prospectivity Mapping in Kalatereshm Area, Based on Exploratory Data Sets Using AHP-Index Overlay Modeling in GIS (Semnan Province, North of Iran). Journal of Geographic Information System,07,677-691. doi: 10.4236/jgis.2015.76055
References
- 1. Porwal, A.K. andKreuzer, O.P. (2010) Mineral Prospectivity Analysis and Quantitative Resource Estimation. Ore Geology Reviews, 38, 121-127. http://dx.doi.org/10.1016/j.oregeorev.2010.06.002
- 2. Eschmitt, E. (2010) Weights of Mineral Evidence Prospectivity Modeling with ArcGIS.
http://www.mdru.ubc.ca/home/courses/SC62_GIS/ESchmitt_EOSC448_DirStudies.pdf - 3. Torres, C.A. (2007) Mineral Exploration Using GIS and Processed Aster Images, Advanced GIS EES 6513, University of Texas at San Anthonio, San Antonio.
http://www.utsa.edu/lrsg/Teaching/EES6513/Projects/Mineral%20Exploration%20using%20GIS%20Final.pdf - 4. Karimi, M. (2003) Design and Implementation for Geographic Information System for Copper Mine Exploration in Detailed Stage. Msc Thesis, K. N. Toosi University of Technology, Iran, 120 p.
- 5. Harris, J., Wilkinson, L. and Grunsky, E. (2000) Effective Use and Interpretation of Lithogeochemical Data in Regional Mineral Exploration Programs. https://www.researchgate.net/publication/223606604_ Effective_use_and_interpretation_of_lithogeochemical_data_in_regional_mineral_exploration_programs_ Application_of_Geographic_Information_Systems_GIS_technology
- 6. Rowe, G. and Wright, G. (2001) Expert Opinions in Forecasting: The Role of the Delphi Technique.
http://link.springer.com/chapter/10.1007%2F978-0-306-47630-3_7 - 7. Zhou, W., Chen, G., Li, H., Luo, H. and Huang, S. (2007) GIS Application in Mineral Resource Analysis—A Case Study of Offshore Marine Placer Gold at Nome, Alaska. Computers and Geosciences, 33, 773-788.
http://dx.doi.org/10.1016/j.cageo.2006.11.001 - 8. Wilkinson, J.J. (2000) Fluid Inclusions in Hydrothermal Ore Deposits.
http://www3.imperial.ac.uk/pls/portallive/docs/1/31629696.PDF - 9. Beane, R.E. and Bodnar, R.J. (1995) Hydrothermal Fluids and Hydrothermal Alteration in Porphyry Copper Deposits.
https://www.researchgate.net/file.PostFileLoader.html?id=552e131cd3df3e152e8b45b4&assetKey=AS%3A273757380251648%401442280253901 - 10. Bradly, D.C. and Leach, D.L. (2002) Tectonic Controls of Mississippi Valley-Type Lead-Zinc Mineralization in Orogenic Forelands. http://alaska.usgs.gov/staff/geology/bradley/bradley_leach_12202.pdf
- 11. Partington, G.A. and Sale, M.J. (2004) Prospictivity Mapping Using GIS with Publicly Available Earth Science Data—A New Targeting Tool Being Successfully Used for Exploration in New Zealand.
http://kenex.com.au/documents/papers/PacRimPartington_Sale.pdf - 12. Yager, D.B., Hofstra, A.H. and Granitto, M. (2012) Analyzing Legacy US Geological Survey Geochemical Databases Using GIS—Applications for a National Mineral Resource Assessment.
http://pubs.usgs.gov/tm/11c05/contents/TM11-C5.pdf - 13. Saaty, T.L. (1980) The Analytical Hierarchy Process, Planning, Priority, Resource Allocation. McGraw-Hill, New York.
- 14. Saaty, T.L. (1980) Decision Making with the Analytic Hierarchy Process.
http://www.colorado.edu/geography/leyk/geog_5113/readings/saaty_2008.pdf - 15. Aczel, J. and Saati, T. (1983) Procedure for Synthesizing Ratio Judgments. Journal of Mathematical, 27, 93-102. http://www.sciencedirect.com/science/article/pii/0022249683900287
- 16. Yang, X., Skidmore, A.K., Melick, A.R., Zhou, Z. and Xu, J. (2006) Mapping Non-Wood Forest Product Using Logistic Regression and a GIS Expert System. Ecological Modelling, 198, 208-218.
http://dx.doi.org/10.1016/j.ecolmodel.2006.04.011 - 17. Bohman-Carter, G.F. (1994) Geographic Information Systems for Weights-of-Evidence Modeling. Natural Resources Research. Pergamon Press, Oxford, 398.
NOTES

*Corresponding author.