Journal of Geographic Information System
Vol.08 No.01(2016), Article ID:63961,13 pages
10.4236/jgis.2016.81011
Spatial Distribution Pattern and Terrain Analysis of Urban Flash Floods and Inundated Areas in Maiduguri Metropolis, Borno State, Northeast, Nigeria
Mohammed Abba Jimme1, Abbas Bashir2, Abel Aderemi Adebayo2
1Department of Geography, University of Maiduguri, Maiduguri, Nigeria
2Department of Geography, Modibbo Adama University of Technology, Yola, Nigeria
![]()
Copyright © 2016 by authors and Scientific Research Publishing Inc.
This work is licensed under the Creative Commons Attribution International License (CC BY).
http://creativecommons.org/licenses/by/4.0/


Received 2 December 2015; accepted 26 February 2016; published 29 February 2016
ABSTRACT
Maiduguri metropolis Nigeria, lies on a relatively flat terrain of about 350 meters above sea level and is part of the undulating Borno Plain that slopes towards the Lake Chad. The rapid physical expansion of the metropolis and the annual recurrent flash flooding and inundation problems within the city continues to impact devastating socioeconomic effects on the livelihood of residents sometimes leading to loss of lives and property. It is important therefore to understand the spatial pattern of floods and terrain characteristics in Maiduguri for planning purposes. The paper examined the spatial pattern of urban flash floods and inundations, and the terrain characteristics in Maiduguri metropolis. Digital Terrain Model (DTM) generated from the Shuttle Raddar Topography Mission was used to provide the basis for the terrain analysis to generate hydrological parameters such as elevation, flow accumulation and direction, drainage network and slope angle as well as classified elevation images and terrain wetness index to map out potential flood risk areas. The DTM identified potential areas liable to flash flood and inundation. The 3D Digital Terrain Model (DTM) of the area showed where potential floods or traps were located in the metropolis. The findings further revealed that Maiduguri was generally characterized by low lying locations with slope angles of less than 5 degrees covering an area of 144.4 km2 out of 148 km2 making it extremely difficult to drain. The processed flow accumulation of the study area showed a high flow accumulation pixel value of 19,972 that drained into outlet, suggesting that a large proportion of the study area was getting flooded during a rainstorm. Even though the calculated drainage density of 0.73 for the study area indicated a very good drainage system, this was also undermined by the flat terrain and urbanization. The study recommends for improved land use planning; raising awareness of the residents, provision of more drainages and continued vulnerability mapping improved the functionality of bodies responsible for flood management among others for sustainable flood management in the study area.
Keywords:
Flashfloods, Urbanization, Vulnerability, Terrain Analysis, Maiduguri DTM

1. Introduction
Flash floods are rapid rise of water along a stream or low lying sections of the urban area usually caused by heavy rainfall. Inundation on the other hand, occurs when floodwater and debris flow through an area for several days. As floods occur naturally, it has the potential for fatal causes such as displacement of people and damage to the environment [1] [2] . Flash floods are common natural disasters in both developed and developing countries. Each year, more deaths are caused by flooding than any other storm related hazard. Assessment of floods will require knowledge of flood prone areas in order to develop prevention as well as mitigation measures. Flood risk maps are therefore very essential tools in the identification of flood vulnerable areas [3] . Production of flood risk maps in developed countries has become an important criterion for carrying out some major development interventions [4] . Some flood risk assessments have been done in some major cities in the country but the flooding menace is on the rise, as more than half of the states in the country have been hit by floods [1] . Hence, it is necessary that flood risk maps are produced for all major urban cities of the country as crucial tool for monitoring flood risk.
The ability to delineate potential flash flood and inundation areas and to map the actual extent of inundation in a floodplain has always been a very difficult task more especially in the developing countries. In many regions, the lack of hydrologic and spatial data constrains the accurate delimitation of flood inundation zones [5] . Unfortunately, [6] [7] reported that this detailed knowledge was always lacking in most urban centres of the developing world especially Nigeria. One way to mitigate the effects of flooding is to ensure that all areas that are vulnerable are identified and adequate precautionary measures taken. In general, flood hazard mapping is a vital component for appropriate land use planning in flood-prone areas. It creates easy-to-read, rapidly-accessible charts and maps that can facilitate administrators and planners to identify areas at risk and prioritize their mitigation/response efforts [8] .
Over the years, Maiduguri has been experiencing serious drainage problems during the rainy season. Besides, none of the earlier studies applies Geographic Information System (GIS) and Remote Sensing Techniques in the analysis of the terrain of the area and mapping of urban flash floods and inundations. This paper therefore examins the spatial pattern of urban flash floods and inundations and the terrain characteristics in Maiduguri metropolis using remote sensing and geographic information system techniques. The focus of this study therefore is to develop a Digital Terrain Model (DTM) of the area to guide future planning and to mitigate the menace of flashfloods and inundations in the rapidly growing urban areas of Nigeria.
2. The Study Area
Maiduguri Metropolis, a major city in the Northeastern corner of Nigerian, is located between latitudes 11˚04'N and 11˚44'N; and between longitudes 13˚04'E and 13˚44'E. It covers a total land area of 543 km2, which makes it the largest city in the Northeastern region of Nigeria [9] .
Maiduguri Urban now extends to four Local Government Areas: Maiduguri Metropolitan, Jere, Konduga and to a smaller extent part of Mafa local government areas. The area is within the vast open plain which is flat or gently undulating, developed on young sedimentary rocks of the Chad formation. This relatively flat terrain is sloping towards the Lake Chad and has an average relief ranging between 300 m and 600 m above sea level [10] and [11] . Maiduguri lies on, and at the bottom of the Bama Ridge which runs in a Northwest/Southeast direction from the Nigeria-Niger boundary to the Cameroun Mountains in the Southeast. The topographic landscape to its Northeast and Southwest is virtually undifferentiated and flat. The area is drained by River Ngadda and its tributary the NgaddaBul [12] .
Maiduguri is located in the Sudan Savannah vegetation region of Nigeria. It is characterized by low annual precipitation (650 mm), high evaporation and perennial water shortage [13] . The highest rainfall is received in August. Generally however the rains are concentrated in the months of July, August and September. There are four identified seasons in the area which include the Rainy Season, (June to September) Harvest Season (September to November), Harmattan or Cool Season (December to February) and Hot Season (March to May) [14] . Analyzed rainfall data for the past thirty years (1981-2010), shows that the mean deviation curve for rain reveals distinct dry (below averages) and wet (above averages) phases. The dry and wet phases seem to be alternating. However, the dry phases in the eighties had been consistent up to the mid-nineties; though there were few positives in 1988, 1989 and 1992. In 1982, the rain was between 234 mm and 787 mm respectively with an annual mean of 577 mm. By this concept, normal precipitation (1980 to 2009) of Maiduguri was 558.9 mm compared to year 2010, when an increase of + 108.4 mm or 667.3 mm was recorded. Rainfall data obtained shows that there is a slight decrease in the rainfall within the study area and same period of up to 3.733. There was also an irregular pattern in the rainfall recorded over the period between 1980 and 2010 and within the period most rainstorms were rather small in size as they yielded less than 557 mm of rainfall even though the number of rain days per annum has reduced but yet even the smallest rainfall of 22.0 mm generates runoff in some wards. This is however attributed to other intervening factors.
Generally the mean monthly temperature is always above 20˚C but the daily extremes vary in a wide range reaching up to 47˚C in April. Daily temperature may occasionally exceed 40˚C, while the night temperatures are high but lowered in the early morning hours. The climate of the area is affected by the North East trade winds and the South West monsoons originating from the Sahara and the Altantic Ocean. The soil of Maiduguri and environs may be classified into sands of Aeolian origin and the beach ridge sediment, vertisol or lagoonal clay and fluvisol and clay soil of alluvial deposit. There are also the brown and reddish brown, regosols, hydromorphic and alluvial soils which are favorable for agricultural activities of many types. It has a population estimated at 1.275 million people according to the 2006 census [15] with an annual growth rate of about 3.5% and a density of 1145 persons per square km which makes it the most densely populated city in North Eastern Nigeria. The projected population of Maiduguri Metropolis for the year 2011 stood at 2,722,986.
3. Materials and Methods
3.1. Data Types and Sources
The data used in this study include a Google map of the study area for 2012, Maiduguri Topographic Sheet 90 NW and Shuttle Radar Topography Mission (SRTM) 90 m Digital Elevation Model (DEM). The SRTM DEM, was processed to generate (flow accumulation and direction, drainage network and ordering as well as catchments maps, which were used for the analyses. All the spatial data were projected to common coordinate system: Universal Transverse Mercator (UTM) projection system, with Clark 1880 Ellipsoid, Minna Datum, and Zone 33. The digital elevation model (SRTM-DEM image) was acquired from the United State Geological Survey (USGS) portal. The topographic sheet 90 NW was collected from the State Ministry of Land and Survey office for validating the DEM using contour values on the map. The GIS software package used for the research was ILWIS 3.72 for processing of all the remotely sensed data. Materials used for field work and data capture include Garmin GPS map 76 CSx with ± 3m accuracy and Google Earth explorer (Quickbird image).
3.2. Hydrological Parameters Extraction
Hydro processing operations in ILWIS environment was used to determine the natural flow pattern of surface water after rainfall. Hydro processing is an ILWIS term describing the collection of operations used in either analyzing or modeling ground water phenomena. The procedure described in this section is meant to determine the natural flow pattern of surface water after a rainfall. This requires series of operations working in sequence with the output of one operation becoming the input of the next operation [16] . In preparation for hydrological parameters extraction from remotely sensed data, two sets of remote sensing data were used.
1) Digital Elevation Model SRTM DEM (90 m)
2) Landsat MSS, TM and ETM+
To prepare for hydrological parameter extraction using image processing software, the study used a Digital Elevation Model (DEM) which is a digital representation of relief over space. The DEM was prepared and pro- cessed by fill operation, so as to have smooth flow of water. By relating any map with the corresponding terrain surface in a 3-dimentional model, one can discover and understand relations between spatial data sets. For example, by draping on Maiduguri urban area map over the height values of a 3D model, it is possible to see where potential floods or traps are located: on slopes, on flat areas and in the lower areas of Maiduguri. The DEM was used to extract flow accumulation and direction, drainage network extraction and ordering, and catchment/basin extraction. The Drainage pattern map was determined from the flow accumulation. The output raster map shows the basic drainage as pixels with value True, while other pixels have value False (Boolean). Boolean map performs a Boolean exclusive or operation on the cell values of two input images. If one input value is true (non-zero) and the other false (zero), the output is 1. But if both input values are true and both are false, the output is 0. The Boolean math tools interpret the input cell values as Boolean values, where non-zero values are considered true and the value 0 is considered false. The two input raster were tested on a cell-by-cell basis (ArcGIS 10, 2010). The interpolated DEM was processed using the DEM Hydro-processing module in ILWIS. The sequential steps in the processing were followed to delineate the sub watershed. The filled DEM operation was first performed before calculating flow direction and flow accumulation to define new streams using a drainage area (Figure 1). The mean DEM was calculated using standard GIS neighborhood operations. The areas selected as potential flooding areas were those that fall within a lower elevation range corresponding to the lower plain which is generally affected when severe flooding occurs.
3.2.1. Determination of Flow Direction and Flow Accumulation
The first operation is the “fill sink” process meant to remove local depressions from the DTM. The depressionless DEM (after fill operation) was used to generate a flow direction raster map. The flow direction shows the possible direction of water run-off on the elevation model. This analysis was performed using the flow direction tool in DEM hydro-processing module in ILWIS. Determination of flow accumulation is the next step after flow direction and it shows the cells within the study area where water accumulates as it flows downwards. Thus, wards around these cells will receive much water during an event of rainfall or any sudden release of water. The stream network was created from the flow accumulation raster map to show the path of streams on the elevation. A reclassification of the flow accumulation results was performed using the reclassification slicing tool. Slicing classifies the values of raster map into appropriate class range using the upper bound limit. The Flow accumulation operation performs a cumulative count of the number of pixels that naturally drain water into outlets. The operation can be used to find the drainage pattern of a terrain (Figure 2, Figure 3).
・ As input the operation uses the output map of the flow direction operation to compute flow accumulation.
・ The output map contains cumulative hydrologic flow values that represent the number of input pixels which contribute any water to the outlets (or sinks if these have not been removed).
・ The higher the Flow accumulation value, the higher the chance of any area near the outlet to be flooded.
3.2.2. Water Sinks Extraction
The water sink operation is calculated from the Digital Elevation Model (DEM) of the study area:
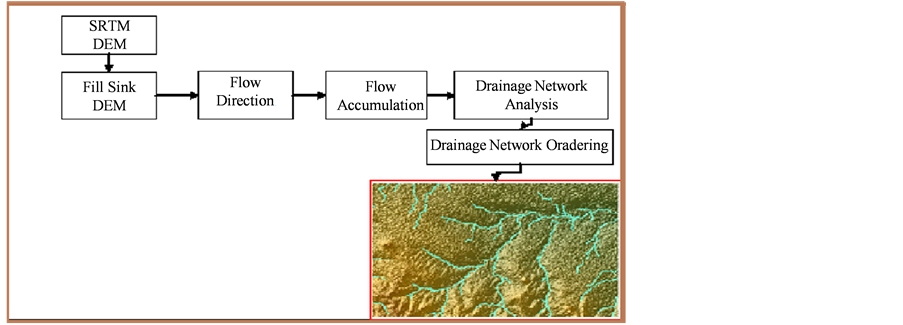
Figure 1. Methodology for delineation of drainage network and analysis. Source: Adopted procedures from ILWIS DEM hydro-processing, 2012.

Figure 2. Water sinks calculation from the neighbouring pixels Source: Adopted from Popkin, (2011).

Figure 3. Graphical representations of water sink. Source: Adopted from Popkin. (2011) [19].
・ Depressions that consist of a single pixel, i.e., any pixel with a smaller height value than all of its 8 neig- hbouring pixels;
・ Depressions that consist of multiple pixels, i.e., any group of adjacent pixels where the pixels that have smaller height values than all pixels that surround such a depression.
3.2.3. Terrain Wetness Index
Inundated areas were extracted using the wetness index. The purpose is to isolate dips and hollows that maintain water for longer periods, exclusive of permanent water bodies like lakes and swamps. The aim is to find low lying areas of poor drainage. Through this index, an idea of the spatial distribution and zones of saturation or variable sources for runoff generation is obtained. The TWI was calculated by running an elevation variance algorithm on the DEM. This is a neighbor function that looks at the average elevation of all surrounding cells. Then calculates variance based on itself and the average. Once the potential areas were determined, the resulting maps in raster format were statistically evaluated in relation to geomorphologic units characterized as susceptible areas to flood inundation. The selected flood areas were those with poor and very poor drainage conditions. Flood inundation areas were assigned a value of 1 and others to 0. Although, the ability of a DEM-based surface to correctly identify flooded areas depends on the quality of the elevation data used for generating the DEM. The wetness index can also be derived from Landsat ETM + image to identify differences between wet and non-wet areas [5] .
4. Results and Discussion
4.1. Terrain Analysis of Maiduguri Metropolis
The processed hydrologic parameters include flow accumulation and direction, drainage network extraction and ordering, and catchment. These images were extracted from SRTM Digital Elevation Model (SRTM DEM), 90m spatial resolution and clearly displayed the potential inundation areas with poor drainage conditions. These areas last for the whole rainy season and are considered to have very poor drainage condition. These images have revealed a very clear characteristic of the Maiduguri terrain. The results indicated that the elevation of each ward differs from one another. This was found attributable to the different inundated areas within same wards and equally responsible for the spatial distribution of flash floods and inundated areas within the metropolis. The images presented as Figures 4-6 show the terrain and watershed of the Maiduguri metropolis over the height

Figure 4. Digital elevation model of Maiduguri metropolis. Source: Laboratory work (2013).
![]()
Figure 5. Superimposed digital elevation model of Maiduguri metropolis. Source: Laboratory work (2013).
![]()
Figure 6. 3D Surface view of Maiduguri metropolis. Source: Laboratory work (2013).
values of a 3D model. The images depicted the elevation of the area showing different height levels of the terrain of the metropolis in meters above sea level (asl). These images indicate clearly where the potential floods or traps are located both on slopes, flat areas and in the lower areas of the metropolis. The white area indicates the higher elevations which are at low risk to flash floods while the black portion signifies the lower elevations which are highly vulnerable or prone to flash floods and inundations. The finding shows that Maiduguri is generally flat in nature and extremely difficult to drain (Figures 4-6). The flatness of the terrain partly explains why these stagnant pools persist in an arid zone with sandy soils that should absorb the water almost immediately. Also, drifts of sand lie on the surface which is underlaid by clay, silt and sandy clay that may retard the underground seepage of the water.
4.2. Flow Accumulation
The processed flow accumulation of the study area indicated a high flow accumulation pixel value of 19,972 that drains into outlets (Figure 7). The high flow accumulation is indicating the flatness of the area, which means the possibility of a large proportion of the study getting flooded during a rain storm. High flow accumulation results in fewer river systems and more surface water entrap and or water sinks expected, with surface area of 104.20 km2 (water sink). This may be partly responsible for flash floods and inundation in parts of the metropolis including Maisandari II, Limanti, Bolori, Jabbamari, Mashamari, Goni Kachallari, Mairi, Shehuri North and Old Maiduguri among others (Figure 5). However, this situation is expected to be likely modified by some human actions such as obstruction by buildings along natural drainages and other intervening factors.
4.3. Natural Drainage Pattern and Slope Analysis
The natural stream network of the study area is illustrated in (Figure 8 and Figure 9). The drainage pattern of the area exhibited both a dendritic and trellised pattern. The calculated drainage density of the study area was found to be 0.73 which is an indication of a very good natural drainage system. The density of stream networks in the area largely influences the potential runoff. However, unplanned development interventions in the metropolis were found to curtail the effectiveness of these natural drainages. This increases the risk of flooding as the rates of infiltration is lower than it should naturally be. This has been confirmed by earlier studies conducted by [17] cited in [18] . The slope of the terrain affects both the speed of runoff and the rate of infiltration of water. Lower slopes indicate that the rate of infiltration would be higher and surface runoff decrease, thus, increasing the risk of flooding. The processed slope map of the area shows that less than 0.07 km2 area within a high slope of less than ten degrees, and slightly above 3 km2 were within a moderate slope angle of 5 - 10 degrees while a greater part Maiduguri metropolis (144.35 km2) is characterized by low lying locations with slope angles of less than five degrees (Figure 10). This is an indication that land use planners in the past did not develop infrastructures with this information at the back of their minds, to ensure effective urban physical planning and drainage system development. The flow direction in Maiduguri is mainly towards the northeast and on single occasion, one river system runs North West (Figure 11). The obvious reason is the presence of the Bama Beach Ridge
![]()
Figure 7. Flow accumulation of Maiduguri metropolis. Source: Laboratory work (2013).
![]()
Figure 8. Drainage pattern of Maiduguri metropolis. Source: Laboratory work (2013).
![]()
Figure 9. Cold shadow relief of overlaid Maiduguri drainage pattern. Source: Laboratory work (2013).
![]()
Figure 10. Slope angle of Maiduguri metropolis. Source: Laboratory work (2013).
(BBR), the old shoreline of Mega Chad. Yet, this river system still finds an outlet across the Ridge to change to
![]()
Figure 11. Flow direction of Maiduguri metropolis. Source: Laboratory work (2013).
North East direction.
4.4. Water Sinks of Maiduguri Metropolis
The images (Figures 8-10) were extracted from SRTM Digital Elevation Model (SRTM DEM), 90 m spatial resolution and clearly displayed the potential inundation areas with poor drainage conditions. These areas last for the whole rainy season and are considered to have very poor drainage condition. Water sink gives further explanation on the nature of terrain (Figures 8-10). They show depressions in elevation below the surrounding or neighboring terrain, which results in water trap. The high risk zones are areas that are most likely to be inundated in a flooding event while the low risk areas are the least likely to be flooded. The analysis also shows that the high risk areas are more than other risk zones. Obviously, this could be explained by the flatness of the terrain of the study area. Much of the study area is made up of small depressions. As shown from computation of the entire Maiduguri area, there are more water traps/depressions than higher elevations. This means that even though Maiduguri is flat, there are many depressions. The total water sink is 104.20 km2 and free water sink is 48.5 km2. The city therefore needs to be well planned to have flood risk reduction. It is a known fact that water flows from an area of higher elevation to that of a lower elevation. The stream network of the area revealed that some parts of the urban area are built on the natural stream channels or drainages. The effect on the terrain is that buildings and diversions lead to an obstruction of the natural course of water during rainfall and especially as there are no effective drainages in the area and may make flooding and inundation inevitable.
4.5. Terrain Wetness Index (TWI) of the Area
The Water Sinks and Wetness index (Figure 12 and Figure 13), confirmed that a greater part of the study area gets inundated during the rainy season. The findings revealed that large scale development has taken place on the natural drainages and the flat nature of the terrain was found responsible for the occurrence of flash floods and inundation. Each of the wards has a peculiar factor or characteristic that causes flash floods and inundations. Some areas lack drainages and others have inadequate drainage networks as well as the terrain. In most of the newly formed wards (Mashamari, Goni Kachallari, Jabbamari, Bale Galtimari, Sulemanti and Kululuri), there are no well-designed surface water drainage facilities that will evacuate flood waters. After the rains, large volume of water finds its way into peoples’ homes and destroys most of their properties. These areas remain inundated for several days or weeks depending on the intensity of the rain. The measured depth of these areas ranges
![]()
Figure 12. Water sinks of Maiduguri metropolis. Source: Laboratory work (2013).
![]()
Figure 13. Wetness index of Maiduguri metropolis. Source: Laboratory work (2013).
from 0.4 meters to 1.2 meters. Majority of the constructed drainages are not interlinked with one another. Rainwater therefore does not have access to move; rather it stagnates and generates more floods.
5. Conclusion
The paper has demonstrated the application and usefulness of Remote Sensing (RS) and Geographic Information System (GIS) tools in flood risk management. The Digital Terrain Model (DTM) has identified the flood risk areas within the metropolis and has provided adequate knowledge of the flood situation for government intervention towards curtailing the disaster. The area is very flat in nature as indicated by the 3D Digital Terrain Model (DTM) and is characterized by a very good and well fashioned natural drainage system but is taken over by poorly planned urban development rendering them less effective. The occurrence of flash flood and inundation is on the increase with devastating socioeconomic effects and the effects are more devastating where natural drainages networks exist, but are replaced by residential buildings due to urban sprawl. Therefore, poor residential planning and inadequate management strategies can be responsible for escalating flash floods and inundation in the city. It will therefore continue to pose a threat to residents and the risk of exposure is expected to be on the rise as the metropolis witnesses’ rapid urbanization, coupled with poor urban planning and management activities. This calls for serious urban re-engineering to overcome existing challenges and to put future of the urban area to proper planning and plan implementation for sustainable city.
Cite this paper
Mohammed Abba Jimme,Abbas Bashir,Abel Aderemi Adebayo, (2016) Spatial Distribution Pattern and Terrain Analysis of Urban Flash Floods and Inundated Areas in Maiduguri Metropolis, Borno State, Northeast, Nigeria. Journal of Geographic Information System,08,108-120. doi: 10.4236/jgis.2016.81011
References
- 1. Adeoye, N.O, Ayanlade, A. and Babatimehin, O. (2009) Climate Change and Menace of Floods in Nigerian Cities: Socio-Economic Implications. Advances in Natural and Applied Sciences, 3, 369-377.
- 2. Nmeribeh, M. (2011) Kano’s Flood Disaster. The NEWS.
http://thenewsafrica.com/2011/06/27/kano%E2%80%99s-flood-disaster/ - 3. Jeb, D.N. and Aggarwal, S.P. (2008) Flood Inundation Hazard Modeling of the River Kaduna Using Remote Sensing and Geographic Information Systems. Journal of Applied Sciences Research, 4, 1822-1833.
- 4. European Commission (EC) (2007) Directive 2007/60/EC of the European Parliament and of the Council of 23 October, 2007 on the Assessment and Management of Flood Risks. Official Journal of the European Union, L288, 27-34.
http://eurlex.europa.eu/LexUriServ/LexUriServ.do?uri=OJ:L:2007:288:0027:0034:EN:PDF - 5. Townsend, P.A. and Walsh, S.J. (1998) Modeling Floodplain Inundation Using an Integrated GIS with Radar and Optical Remote Sensing. Geomorphology, 21, 295-312.
http://dx.doi.org/10.1016/S0169-555X(97)00069-X - 6. Ifatimehin, O.O., Musa, S.D. and Adeyemi, J.O. (2009) An Analysis of the Changing Land Use and Its Impact on the Environment of Anyigba Town, Nigeria. Journal of Sustainable Development in Africa, 10, 357-364.
- 7. Ishaya, S., Ifatimehin, O.O. and Okafor, C. (2008) Remote Sensing and GIS Applications in Urban Expansion and Loss of Vegetation Cover in Kaduna Town, Northern Nigeria. American-Eurasian Journal of Sustainable Agriculture, 2, 117-124.
- 8. Venkata, G. and Sinha, B. (2004) GIS in Flood Hazard Mapping: A Case Study of Kosi River Basin, India. http://www.gisdevelopment.net/application/naturalhazards/floods/floods001pdf
- 9. Daura, M.M. (2002) “Maiduguri” Atlas of Nigeria in Africa Atlasses. Bietlot, Belgium, 148-149.
- 10. Daura, M.M., Gisilanbe, A.M. and Waziri, M. (2001) Flood Plain Encroachment and Hazard Awareness in Urbanized Catchments: A Study of Ngadda Flood Plain in Maiduguri. In: Daura, M.M., Ogunnika, O., Irefin, D. and Balami, D., Eds., Environment and Development Issues in Sub-Saharan African, Seminar Series, Vol. 1. Faculty of Social and Management Sciences, University of Maiduguri, Maiduguri, 50-60.
- 11. OnlineNigeria (2003) Borno State: Physical Setting. http://www.onlinenigeria.com/links/bornoadv.asp
- 12. Malah, W.B. (2007) The Viability and Sustainability of Rainwater Harvesting for Domestic Uses in Maiduguri Metropolis. An Unpublished M.Sc. Dissertation, Department of Geography, University of Maiduguri, Maiduguri.
- 13. Daura, M.M. (2001) The Physical Environment and Development: A Study of Borno Region. In: Daura, M.M., Ogunnika, O., Irefin, D. and Balami, D., Eds., Environment and Development Issues in Sub-Saharan African, Seminar Series, Vol. 1, Faculty of Social and Management Sciences University of Maiduguri, Maiduguri, 35-47.
- 14. Waziri, M. (2009) Spatial Pattern of Maiduguri City: Researchers’ Guide. Adamu Joji Publishers, Kano City.
- 15. NPC (2008) National Population Commission, 2008. Maiduguri Projected Population.
- 16. Musa, A.A. (2011) Finding a Lasting Solution to the Loko Flood Disasters—A GIS Approach. Lagos Journal of Geographic Information System, 1, 41-48.
- 17. Ajibade, L.T., Ifabiyi, I.P., Iroye, K.A. and Ogunteru, S. (2010) Morphometric Analysis of Ogunpa and Ogbere Drainage Basins, Ibadan, Nigeria. Ethiopian Journal of Environmental Studies and Management, 3, 13-19. http://dx.doi.org/10.4314/ejesm.v3i1.54392
- 18. Orok, H.I. (2011) A GIS-Based Flood Risk Mapping of Kano City, Nigeria. Unpublished M.Sc., School of Environmental Sciences, University of East Anglia University Plain, Norwich.
- 19. Popkin, J. (2011) Creating a Terrain Wetness Index from a Digital Elevation Model, Mostly a GIS Guy. 28 April 2011.