Journal of Geographic Information System
Vol.07 No.04(2015), Article ID:59059,9 pages
10.4236/jgis.2015.74035
Use of Geospatial Technology for Assessment of Waterlogging & Salinity Conditions in the Nara Canal Command Area in Sindh, Pakistan
Kashif Aslam1,2*, Sajid Rashid1, Rashid Saleem1, Rana Muhammad Sohail Aslam1
1Institute of Geology, University of the Punjab, Lahore, Pakistan
2Pakistan Water and Power Development Authority, Lahore, Pakistan
Email: *mkashifalam@yahoo.com, sajidpu@yahoo.com, rashid.saleem.lhr@gmail.com, sohailaslam303@hotmail.com
Copyright © 2015 by authors and Scientific Research Publishing Inc.
This work is licensed under the Creative Commons Attribution International License (CC BY).
http://creativecommons.org/licenses/by/4.0/


Received 9 June 2015; accepted 22 August 2015; published 25 August 2015
ABSTRACT
Agriculture is being main stay of Pakistan economy and it’s very significant to monitor the existing agricultural areas and its changes, due to different aspects like salinity and waterlogging, which reduce the fertility of agricultural lands adversely. Managing salinity so as to minimize its environmental impact is a prerequisite for the long-term sustainability of irrigated agriculture. It is ironic that the irrigated areas are those that are afflicted most by the twin menaces of waterlogging and salinity. Geospatial technology was used to assess the waterlogging and salinity condition in Nara canal command area, during the last two surveys conducted in years 1977-1981 and 2001- 2003 respectively. After analyzing the results in detail, we obtain a clear relationship among salt affected soils, and waterlogged areas reveal that 0.2% to 1.25% of salt affected areas fall under the shallow zone with high water table. The spatial distribution of water table shows various trends among the water tables, and the surface salinity of surface saline areas has been increased due to waterlogging caused by unmanaged spatial drainage system.
Keywords:
Geospatial, Salinity, Waterlogging, Nara Canal and Sindh in Pakistan

1. Introduction
Pakistan is bestowed with abundant water resources in the form of gigantic rivers fed from worldwide renowned lofty snow & ice clad mountain peaks and rainy water, their tributaries, rivulets, and hill torrents besides vast underground water reservoirs. Indus irrigation system belongs to massive river and rainy water, which potentially facilitates irrigated land to immense resources of potentially productive agriculture land (S and R Publication, 2007). That is why the economy of the Pakistan is predominantly agrarian. However, the yields of major crops are far lower than those attained by the other developing countries of the world. This could be attributed to various soil, water and management practices, insufficient waterlogging and salinity/sodicity, poor irrigation management practices, insufficient irrigation supplies of good quality water and inadequate drainage system (S and R Publication, 2007).
Soil salinity is one of the major problems of soil degradation; it is an environmental hazard that causes reducing the agricultural productivity. Salinization is a worldwide problem in irrigated lands, which use large amounts of irrigation water and are poorly drained. FAO [1] reported that about 20 to 30 M∙Ha (million hectares) worldwide were severely affected by salinity and that additional 60 to 80 M∙Ha were affected to some extent. At global scale, soil salinization is spreading at a rate of up to 2 M∙Ha per year, which offsets a good portion of the crop production that is achievable by expanding irrigation and/or using best management practices at system level [2] .
Pakistan has a total area of 79.6 M∙Ha, with 22.0 M∙Ha cultivated [3] , and 6.28 M∙Ha affected by salinity and/or waterlogging within the irrigation regions [4] . A land area between 2 and 3 M∙Ha is categorised as wasteland due to high salinity and sodicity [5] . It is estimated that 25% of the irrigated land in the Punjab and 40% of the irrigated land in Sindh are salt affected. About 10 to 20 million people live on salt-affected land [6] with impoverished productivity and under increased threats of devastating ecosystem. Seepage from supply canals, extensive network of off-farm and near farm watercourse, and flooded irrigated paddocks are the primary causes of secondary soil salinity [7] .
Waterlogging and salinity have distressing social and economic effects on farming communities [8] . However, the increasing shortage of fresh water resources is likely to trigger increased environmental damage. The falls in river flows and irrigation supply channels, and persistent droughts (except the recent monsoon wet season of 2007 & 2011 haing caused inundations and river flooding) have disturbed the water ecosystem resulting into food insecurity and non-sustainable farming systems.
Study Area
The Nara Canal is an excavated waterway in Sindh Province, Pakistan (S & R Publication, 2007). It was built as an excavated channel off the left bank of the Indus River into the course of the old Nara River. The canal runs from above the Sukkur Barrage through the Khairpur, Sanghar and Tharparkar Districts to the Jamrao Canal. The command area lies between 24 - 30 to 26 - 28 north latitudes and 68 - 40 to 69 - 57 east longitudes. The area is bounded by Thar Desert in north and northeast, in west it is bounded by south Rohri Canal Command and in south it extends in shape of narrow strip and bounded by DhoroPuran and Thar Desert. The area extends over 2,431,394 acres lying mainly in Sanghar, Mirpurkhas and Umerkot districts. The main towns are Khadro, Sinjhoro, Khipro, Mirpurkhas, Sanghar, KotGhulam Muhammad, Digri, Samaro, Umerkot, Kunri, jhuddu and naukot
Nara is the longest canal in Pakistan, running for about 226 mi (364 km). It has a designed capacity of 13,602 cu ft/s (385.2 m3/s), but actually discharges 14,145 cu∙ft/s (400.5 m3/s).
About 2,000,000 acres (8100 km2) of land are irrigated by this canal. Within the Khairpur District, the canal and its associated wetlands were made into the Nara Game Reserve in 1972 (Figure 1).
2. Material and Methods
Two types of datasets have been used, surface salinity maps of year 1977-81 and 2001-03 to assess their temporal changes in the salinity, these maps have been taken from the WAPDA reports, the other depth to water table data have been used for the periods of post-monsoon year 2011 and pre-monsoon year 2012 to analyze the behavior of the waterlogging condition during these period. Our aim is to analyze spatially quantitative comparison between 1977-1981 and 2001-2003 in surface salinity data and assessment among the change in depth to

Figure 1. Study area location map.
water table during pre and post-monsoon periods, this paper is determine and delineation of surface salinity conditions, mapping, classification and temporal change detection of salt-affected soils and water logged area in the Nara canal command in Sindh (province) Pakistan. Reliable and up-dated information on the spatial and temporal variability of soil salinity is required to effectively manage the limited natural resources and maintain a viable agricultural industry that is highly dependent on conjunctive use of surface and ground waters with varying salinity levels. Both, improved water use efficiency and environmental stewardship are indeed complementary goals [2] . Therefore the reliable sources of data were used from WAPDA report and recently available ground surveyed data for depth to water table.
The ArcGIS software was used to digitize the linear and polygon features marked on the hardcopies of the images. For this purpose the hard maps from the maps were scanned and rectified on their mark reference grid, geo-referencing tool in ArcGIS desktop was used to rectify these maps, further the desire classes were identified such as S1, S2, S3 and S4 corresponds to their respective surface salinity as describes in Table 1. These surface salinity maps were based on the interaction of surface salinity, profile salinity, soil textural groups, groundwater, and landform and land use survey. In order to describe the surface salinity status, based on the USDA (Hand

Table 1. Criteria for classification of surface salinity categories.
Book 18) [9] and soil survey manual agriculture USDA (Hand book No. 60) [10] four salinity classes viz; Salt free (S1), slightly salt-affected (S2), moderately salt-affected (S3), and strongly salt-affected (S4) have been recognized [11] - [13] and are given in Table 1, and are described as under.
Salt Free/Normal Area (S1)
There are no visible salts on the soil surface and plant growth is not affected by salinity/sodicity. Electrical conductivity of the saturated soil extracts (0 - 15 cm) measures up to 4 dS/m at 25˚C.
Slightly Saline/Slightly Salt affected Area (S2)
The plant growth is uneven or patchy. Salts are generally present in patches which cover upto 25 percent area collectively. The electrical conductivity ranges between 4 - 8 dS/m at 25˚C.
Moderately Saline/Moderately Salt affected Area (S3)
Salts are fairly visible on the soil surface: 25% - 75% of the surface area is infested with salinity. Electrical conductivity ranges between 8 - 15 dS/m at 25˚C.
Strongly Saline/Strongly Salt affected Area (S4)
The area is abandoned may support highly salt tolerant species. Electrical conductivity of soil samples is more than 15 dS/m at 25˚C. For profile salinity the sampling criteria adopted in present survey was based upon landform classes coupled with land use features, which govern the surface salinity delineation and soil profile auguring sites. Accordingly, each whole average auguring intensity achieved was 2.0 sq. mile.
Depth to water table data have been collected from field survey for the period’s post-monsoon year 2011 and pre-monsoon year 2012, more than 500 reading of wells and piezometer were collected from the field. Spatial analyst tool was used to produce their raster surfaces, inverse distance weighted (IDW) algorithm was used. Inverse distance weighted (IDW) interpolation [14] explicitly implements the assumption that things that are close to one another are more alike than those that are farther apart. To predict a value for any unmeasured location, IDW uses the measured values surrounding the prediction location. The measured values closest to the prediction location have more influence on the predicted value than those farther away. IDW assumes that each measured point has a local influence that diminishes with distance therefore this algorithm was used (ESRI help) [15] .
Depth to water table classes were defined as illustrated in WAPDA reports, there are six classes define such as in Table 2, raster surfaces were need to classify into their respective class as in Table 2, manual classification method was used in spatial analyst tool, for systematic spatial change analysis both raster surfaces have been generated by keeping their spatial resolution synchronized, their pixel snap to each other and their extents must be same.
A sink is a cell with an undefined drainage direction; no cells surrounding it are lower. The pour point is the boundary cell with the lowest elevation for the contributing area of a sink. If the sink were filled with water, this is the point where water would pour out (ArcGIS Help). Shuttle radar topographic mission (SRTM) data was used to identify the sink area cause by the canals, road infrastructures, and rail roads; these features create hindrance to drain rain water and create artificial sink areas which caused to increase the waterlogging in those sink areas. So there is need to identify these sink where the rain water accumulate and become a cause of waterlogging. For this purpose SRTM DEM have been used, prepared depression less DEM, (the depression is cell or cells that are surrounded by unusual higher elevation) by calculating the sink depth and then apply the fill function [16] . In the fill DEM embed the infrastructure values by adding one meter elevation on infrastructure in DEM. Then determine flow direction by using D8 method that leads to determine all other functions like flow
Table 2. Classification of depth to water table.
accumulations, stream links, watershed, stream network and finally sink areas. Further these sink area were overlaid with waterlogged area to determine the waterlogging cause due to unmanaged drainage system at infrastructures such as roads and canals.
3. Discussion and Results
Based on the four surface salinity classes namely: salt free (S1), slightly salt-affected (S2), moderately salt-af- fected (S3), and strongly salt-affected (S4) described earlier, the summary of surface salinity status observed in Nara canal command area during 1981 (Bench Mark), and 2001-03 available surveys in digitally presented in Figure 2.
Based on 2001-03 survey, the aerial distribution of surface salinity status for different categories is summarized in table considering over all account of the Nara canal command area. The comparison of the recent survey 2001-03 with that of previous 1979-81 survey indicates that non saline area was 51% whereas salt affected areas were 22% S2, 7% S3 and 18% S4 respectively. In 2001-03 survey, the non-saline area has decreased to 33% indicate a net decrease of 18% and S2, S3 areas have increased to 23% and 10% respectively, shows net increase of 1% and 3% respectively. There was also increase of 32% in strongly saline area have net increase 14%.
In general way the Chart 1 illustrates that comparison between the surface salinity in year 1981 to 2003. But to determine which of the class transform to other during this era, GIS facilitate us in this respect. For this purpose overlay analysis was perform in ArcGIS. Table 3 shows the change in surface salinity from year 1977- 1981 to 2001-2003. The below table indicate that non-saline (S1) area of surface salinity 1977-1981 was turned to 22.81% in S2, 10.57% in S3, and 30.87% in S4 while 35.74% area remains in S1 class. In the similar way slightly saline (S2) area change into 29.61% in S1, 9.92% in S3, and 33.58% in S4 while 26.89% kept in S2, same as moderately saline (S3) area transform into 29.18% of S1, 21.2% of S2, and 35.85% of S4, although 13.34% area remain unchanged, it is also noted that this is a particular class which in turn to other saline classes with highest (35.85) percentage change into strongly saline area. According to Table 3, it shows that mostly strongly saline (S4) area of 33.78% turned into non saline (S1) area, 21.20% to S2 and very least change to S3 of 9.96%, where as 35.06% area kept in same S4 class.
Depth to water table surfaces have been generated for the periods post monsoon 2011 and pre-monsoon 2012 by using IDW interpolation method, these layer have been generated keeping the symmetrical resolution, further manual classification technique was used to convert continuous data to thematic layer as illustrated in WAPDA reports. Figure 3, Table 4 and Chart 2 show the comparison between depth to water table of period post monsoon 2011 and pre-monsoon 2012.
According to WAPDA report class W1 below 90 cm water table termed as waterlogged area, in Table 4 it shows that ~25% of cover area is waterlogged in post-monsoon 2011 while ~8% of covered area is waterlogged in pre-monsoon 2012. Further by using spatial analysis in terms of overlay analysis in ArcGIS it shows that 2.2% cover area remains in waterlogged during the both periods. One of the causes of waterlogging is due to unmanaged drainage system. For this purpose hydrological analysis was performed to identify the artificial sink areas due infrastructure such roads and irrigation network. It was found that ~28% area considered to be as sink due infrastructure. While ~1.6% (~0.5% of study area) sink area remains waterlogged during the period while ~29% (~8% of study area) of sink area found waterlogged on alternate periods, it was also found that most of the waterlogged area found in post monsoon period which is ~7% study area falls in sink area while pre-monsoon it was reduced to ~2.5% of study area falls in sink area as shown in Figure 4. According to analysis it shows that
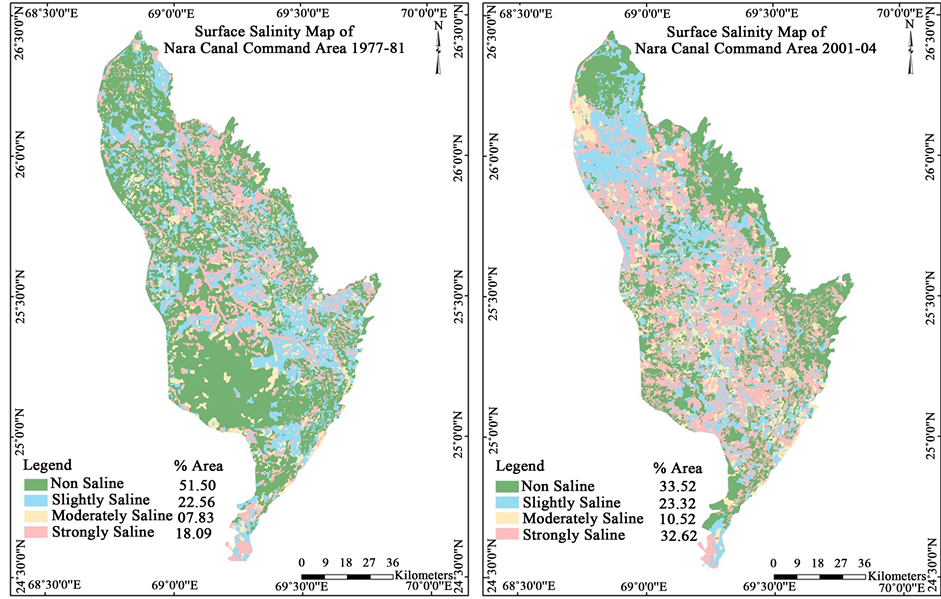
Figure 2. Surface Salinity 1977-1981 & 2001-2003.
Table 3. Percentage change in surface salinity from year 1981 to 2003.
Table 4. Depth to water table pre-monsoon 2012 & post-monsoon 2011.
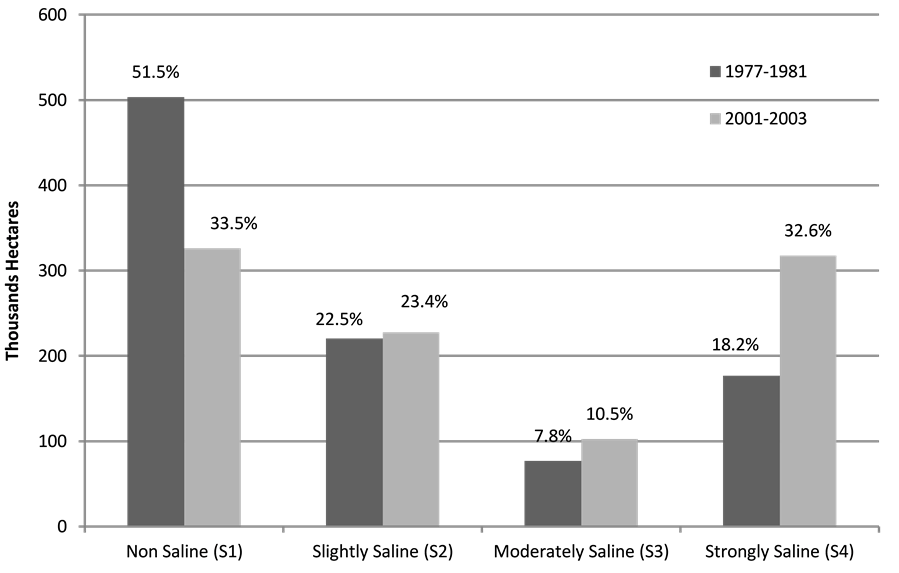
Chart 1. Surface salinity comparison.

Figure 3. Depth to water table map.
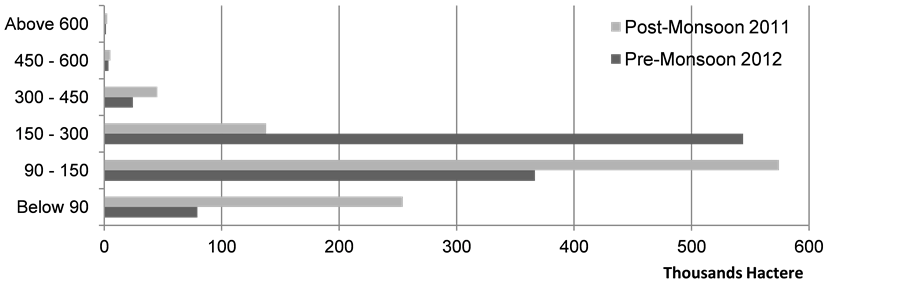
Chart 2. Depth to water table post-monsoon and pre-monsoon comparison.
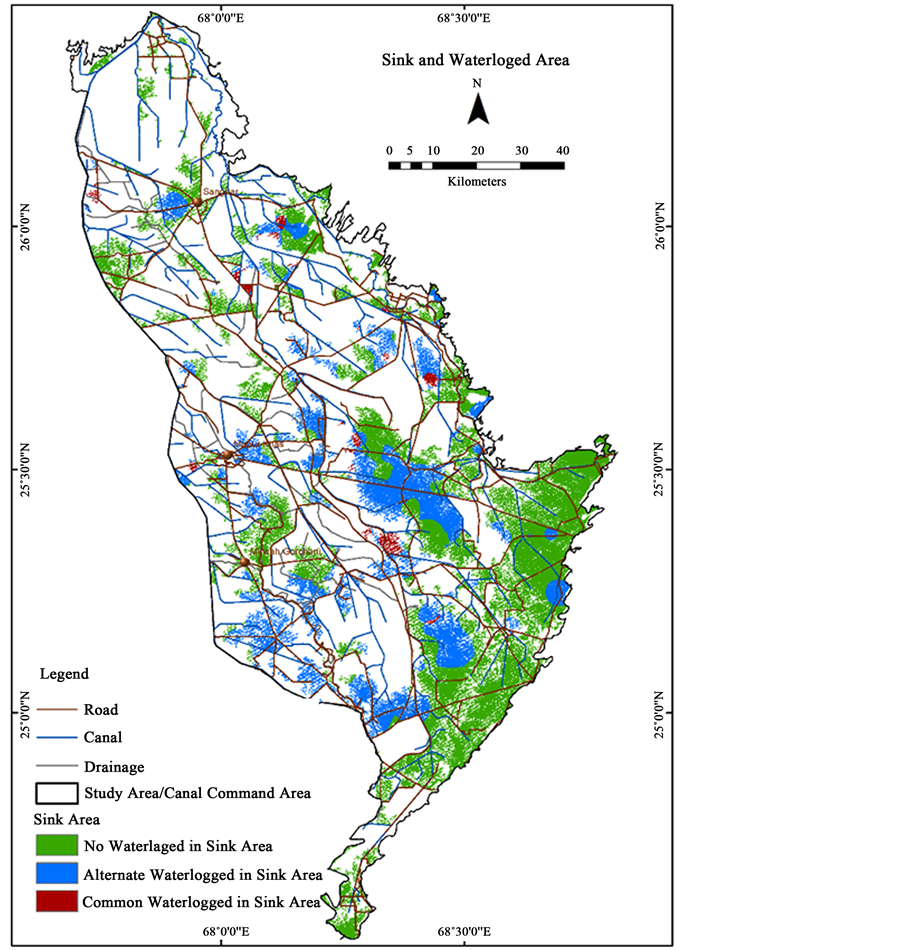
Figure 4. Sink and waterlogged area.
in post-monsoon period waterlogged area increased in sink area, it refer as that there is unmanaged drainage system in study area which caused the waterlogging in that region, it can be minimize by improving the rainfall drainage system.
Another overlay analysis was performed on commonly S4 (strongly saline area) surface salinity for 1977- 1981 and 2001-2003 and commonly W1 (waterlogged area) water table for post monsoon 2011 and pre-mon- soon 2012, it was found that 1340.55 hectare (S4) saline area on commonly waterlogged area in post monsoon and pre-monsoon, while 16,052.58 hectare (S4) saline area found on alternatively waterlogged in post-monsoon and pre-monsoon and 47,351.79 hectare (S4) saline area found on other than waterlogged areas during the post and pre-monsoon 2011 and 2012 respectively. It was found that ~0.2% of study area which 1340 hectare remains waterlogged and strongly saline. The results gathered after analyzing the relationship among salt affected soils, and commonly waterlogged revealed that 0.2% to 1.25% of salt affected area falls under the shallow zone. It showed that the salt affected area have been increased during this era.
4. Conclusions and Suggestions
Most of commonly waterlogged areas (pre and post monsoon) were found near built-up infrastructure such as roads. Spatial analysis suggested that artificial sink areas were created due to newly built infrastructure, which caused the artificial waterlogging. The geospatial analysis showed that the trends among the saline areas had been increased in commonly waterlogged areas near the infrastructure. This clearly depicted that there would be unmanaged drainage systems which existed in those particular areas. By using geospatial analysis and its results, we can identify the unmanaged waterlogging caused by the artificial sink. The aggravated soil salinity situation during year 2004 was perhaps due to the poor operation of drainage system in Nara Canal Command area. Waterlogging and salinization can be minimized by managing and improving the drainage system. Geospatial technology can play a vital role in identifying the sink areas which can be created on newly planned infrastructure such as road and canal.
Reliable and up-dated information on the spatial and temporal variability of soil salinity is required to effectively manage the limited natural resources and maintain a viable agricultural industry that is highly dependent on conjunctive use of surface and groundwater with varying salinity levels. Overall surface salinity and waterlogging condition in study area are adversely high.
A series of controlling measures had been taken to eradicate the problem of waterlogging and salinity problem, but a few of them were seceded as given below.
4.1. Plantation of Water Absorbing Plants/Trees
If water absorbing plants and trees are planted on water logged land, the problem of waterlogging can be controlled to a greater extent. These plants and trees include Popular, Safeda and Soomal. The Government of Pakistan, to this effect, provides plants during Plantation Campaign at nominal price. There are many problems in using this method as well. For instance, the lands have been so marshy that these trees can also not be planted.
4.2. Surface Drainage
Surface drainage system was introduced in India first time when waterlogging began to spread along the Western bank of River Jamuna and River Sarhun. Sem drains were built for this purpose. This method of controlling waterlogging problem has also been proved to be very effective in Nara canal command area. According to this method, metalled drains are built from the waterlogged area to a far place. The excess water is drained out through these drains.
4.3. Alternate Use of Saline Land
Under this method, the land which goes out of cultivation due to waterlogging is shifted to other alternate productive use. For instance, the waterlogged area can be converted into a big fish pond and fish may be kept there at commercial level.
4.4. Pumping of Ground Water
The experience for draining out the surplus groundwater was made limited up till 1920 but in 1945, a project of installing tube wells along the Rechna Doab canals was implemented. These tubes were supplied with electricity from power project constructed at Rasul on River Jehlum. Approximately 17,000 tube wells have been installed under the management of Wpada and 515,309 tube wells have been installed in the private sector. In the same way, the tube wells can be installed in waterlogging and saline areas of Nara canal command area.
4.5. Use of Waste
To make the saline soil better, industrial and agricultural wastes can be used. For instance, the sugar cane waste from the sugar mills can increase the organic composition in the soil and can reduce the intensity of salinity.
Cite this paper
KashifAslam,SajidRashid,RashidSaleem,Rana Muhammad SohailAslam,11, (2015) Use of Geospatial Technology for Assessment of Waterlogging & Salinity Conditions in the Nara Canal Command Area in Sindh, Pakistan. Journal of Geographic Information System,07,438-447. doi: 10.4236/jgis.2015.74035
References
- 1. FAO (1990) An International Action Program on Water and Sustainable Agriculture Development. A Strategy for the Implementation of the Mar del Plata Action Plan of the 1990s, Rome, Italy.
- 2. Abbas, A. and Khan, S. (2007) Using Remote Sensing Techniques for Appraisal of Irrigated Soil Salinity. In: Oxley, L. and Kulasiri, D., Eds., MODSIM 2007 International Congress on Modelling and Simulation, Modelling and Simulation Society of Australia and New Zealand, December 2007, 2632-2638.
- 3. Government of Pakistan [GOP] (1999) Soil Survey of Pakistan. Government of Pakistan, Islamabad.
- 4. Rafiq, M. (1990) Soil Resources and Soil Related Problems in Pakistan. In: Ahmad, M., Ed., Soil Physics—Application under Stress Environments. BARD, PARC, Islamabad.
- 5. Qureshi, R.H., Aslam, M. and Rafiq, M. (1993) Expansion in the Use of Forage Halophytes in Pakistan. In: Davidson, N. and Galloway, R., Eds., Proceedings Workshop “Productive Use of Saline Land”, Perth, 10-14 May 1991, 12-16.
- 6. Barrett-Lennard, E.G. and Hollington, P.A. (2006) Development of a National Program on Saline Agriculture for Pakistan.
- 7. Abbas, A., Uchida, S. and Yamamoto, Y. (2005) GIS Applications for Hydrologic Risks of Groundwater Levels in Irrigated Lands.
http://search.informit.com.au/documentSummary;dn=322736990587168;res=IELENG - 8. Azhar, H. (2010) Impact of Subsurface Drainage on Soil Salinity in Pakistan. The Journal of Animal & Plant Sciences, 20, 94-98.
- 9. US Department of Agriculture (1993/1957) Soil Survey Manual Agriculture. United State Department of Agriculture, Hand Book No. 18, 4-6.
- 10. US Department of Agriculture (1969) Diagnosis and Improvement of Saline and Alkali Soils. US Department of Agricultural, Handbook No. 60.
- 11. WAPDA (1981) Soil Salinity Survey of Irrigated Areas in the Indus Basin, 41 Million Acres. Planning Division, WAPDA, Lahore, Vol. II, Publication No. 274, 1-12.
- 12. WAPDA (2001) Monitoring & Evaluation FDP. Publication No. SM-285, Final Report. M&E Directorate, SMO, Lahore, 201.
- 13. WAPDA (2007) Soil Salinity Survey of Nara Canal Command Area, S&R Publication No. 57, National Drainage Programme. Soils and Reclamation (S&R) Directorate, SCARP Monitoring Organization, Lahore, 14.
- 14. Watson, D.F. and Philip, G.M. (1985) A Refinement of Inverse Distance Weighted Interpolation. Geoprocessing, 2, 315-327.
- 15. ESRI (Environmental Systems Resource Institute) (2011) ArcMap 10.0. ESRI, Redlands.
- 16. Qamer, F.M., Ashraf, M.S., Hussain, N., Saleem, R., Ali, H., Mirza, H., Akram, U. and Raza, S.M. (2009) Pakistan Wetlands GIS—A Multi-Scale National Wetlands Inventory. 33rd International Symposium on Remote Sensing of Environment, Stresa, 4-8 May 2008.
NOTES

*Corresponding author.