Natural Science
Vol.5 No.1A(2013), Article ID:27627,5 pages DOI:10.4236/ns.2013.51A026
Report on a breeding objective that may reduce the carbon footprint of extensive cow-calf production systems
![]()
1ARC-Animal Production Institute, Irene, South Africa; *Corresponding Author: MokolobateM@arc.agric.za
2Department of Animal Science, North West University, Mmabatho, South Africa
3Department of Animal Wildlife and Grassland Sciences, University of Free State, Bloemfontein, South Africa
Received 21 November 2012; revised 23 December 2012; accepted 8 January 2013
Keywords: Beef Production; Breeding; Cattle; Large Stock Unit; Sanga; Weaner Calf Component
ABSTRACT
Most measurements for beef improvement in South Africa are per individual (weaning weight, calving interval, growth rate, etc.). A measurement that expresses performance per constant unit, e.g. kilogram calf weaned per Large Stock Unit (LSU) can eventually be translated to kilogram calf produced per kg CO2 equivalent. A LSU is defined as a bovine requiring 75 MJ Metabolisable Energy (ME) per day. If more kilogram weaner calf can be produced per LSU (KgC/LSU), the carbon footprint of beef can be reduced. This study used breed average values to investigate the KgC/LSU for the 30 beef and dual purpose breeds in South Africa. The breeds were categorized in the following breed types: Sanga (indigenous to South Africa) Sanga derived, Zebu, Zebu derived, British and European. No relationship was found between cow weights and KgC/LSU, indicating that it is independent of cow weight between breeds. However, when the data is summarized into breed types, the Sanga and European breed types produce the least KgC/LSU and Sanga derived breed types the most. This high value of the Sanga derived breeds is probably due to retained heterosis. Composite breeds are mostly intermediate to parental breeds for individual traits but superior for composite traits and KgC/LSU is a composite trait. These calculations were only done on breed averages. A genetic analysis on a breed level to estimate genetic parameters for this trait, and its genetic correlations with other traits now needs to be done before a decision can be taken whether selection for KgC/LSU will be feasible. The ultimate aim with a trait like this is to reduce the carbon footprint of weaner calf production since more kilogram calf will be produced per LSU (constant feed unit).
1. INTRODUCTION
The general perception that livestock is a major contributor to global warming mainly resulted from the FAO publication “Livestock’s Long Shadow” which indicated that livestock is responsible for 18% of the world’s greenhouse gas emissions (GHG). This initial calculation of the contribution of livestock to global warming has since been drastically scaled down from the figure initially quoted in this FAO publication [1]. The initial figure has been proven to be an overestimation [2] and the most recent figure for the contribution of livestock to GHG is in the order of 5% - 10% (also for South Africa). Livestock contributes about 65% of total agricultural GHG (CO2 equivalent) of which enteric fermentation (animal digestive tract) accounts for 90% [3], and mitigation strategies are essential if climate change is to be contained within certain limits.
The atmospheric lifetime of methane (CH4) is 12 years, compared to 100 to 200 years of carbon dioxide [4]. Furthermore the heating potential of methane is 23 times that of carbon dioxide [5]. Reduction in CH4 levels will thus have a significant effect on the targets set by governments in terms of the Kyoto protocol, since its impact will be quicker due to the shorter lifetime and bigger due to the higher heating potential, compared to CO2. More emphasis on the reduction of CH4 emissions can thus be expected in the immediate future if reduction targets are to be met.
The emission of GHG from livestock is calculated either in terms of kg CO2 (carbon dioxide) equivalent per kg of meat or milk available for consumption, or per area of land used. In the case of ruminants, extensive systems are usually found to have a lower per-area footprint than intensive grain-fed systems but a higher footprint if expressed in terms of kg product produced [6,7]. Livestock on extensive rangelands/pastures produce more methane than livestock on intensive production systems, since the lower quality feed (mainly pastures that they are consuming) produce more GHG per kilogram feed intake than the higher quality feed used in intensive systems.
Livestock agriculture is the largest user of land resources in southern Africa. In South Africa 71% of the surface area is only suitable for extensive livestock farming [8]. Consequently, primary beef cattle farming (cowcalf production cycle) is largely extensive. The cow-calf portion of the production cycle (the extensive part in Southern Africa) accounts for 72% of the nutrient requirements from conception to harvest [9]. Until now most measurements for beef improvement in southern Africa, and many other parts of the world, is per individual (weaning weight, calving interval, growth rate, etc.). A measurement is thus needed that expresses performance per constant (standardized) unit. Selection for productivity and efficiency will for instance have a permanent mitigating effect on the production of GHG’s, as higher productivity will lead to higher gross efficiency as a result of diluting the maintenance cost of animals [10,11].
A possible breeding objective/goal that may reduce the carbon footprint of extensive cow-calf production systems is discussed in this article. A trait that expresses performance (calf weaning weight) per constant unit, viz. kilogram calf weaned per Large Stock Unit (KgC/LSU) may be useful as such a breeding objective. Since a LSU (Large Stock Unit) unit is linked to specific metabolisable energy requirements it should be possible to eventually “link” this breeding objective with the carbon footprint of weaner calf production.
In a breeding objective/goal the trait under consideration is the end result—what should be achieved. Decisions about such a trait are based purely on the end result, not on whether it is difficult or easy to measure or whether there may be problems in selecting for it. The next phase will then be to identify selection criteria, which are the traits that should be actually used in the selection of animals. Traits in the selection criteria should be correlated with the trait in the breeding objective, easily measurable and heritable.
2. MATERIALS AND METHODS
For the purposes of this study the information from performance recording of beef and dual purpose breeds in South Africa over a 10 year period was used [12]. The data that was extracted were cow weight at birth of the calf and the 205 day corrected weaning weight of the calf and was used to calculate the calf/cow weight ratio (205 day weaning weight/cow weight) and KgC/LSU. The breeds, breed types and number of cow weights per breed, are presented in Table 1.
In southern Africa a LSU is defined as the equivalent of an ox with a weight of 450 kg and a weight gain of 500 g per day on grass pasture with a mean Digestible Energy (DE) concentration of 55%. To maintain this, 75 MJ Metabolisable Energy (ME) is required [13]. This is similar to the Animal Unit used in North America [14].
Meissner [13] developed tables in which the LSU units have been linked to the weights of lactating beef cows. For example a 500 kg lactating cow is equal to 1.43 LSU units. These cow weights and their respective LSU’s were used to develop an equation to calculate the LSU for different weights of lactating beef cows [15].
The equation is:
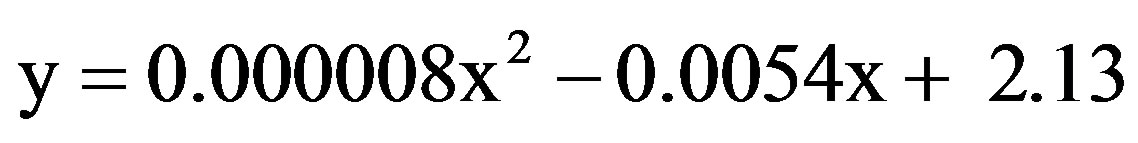 (1)
(1)
where y = LSU units and x = cow weight.
The Spearman correlations of cow weight, cow LSU
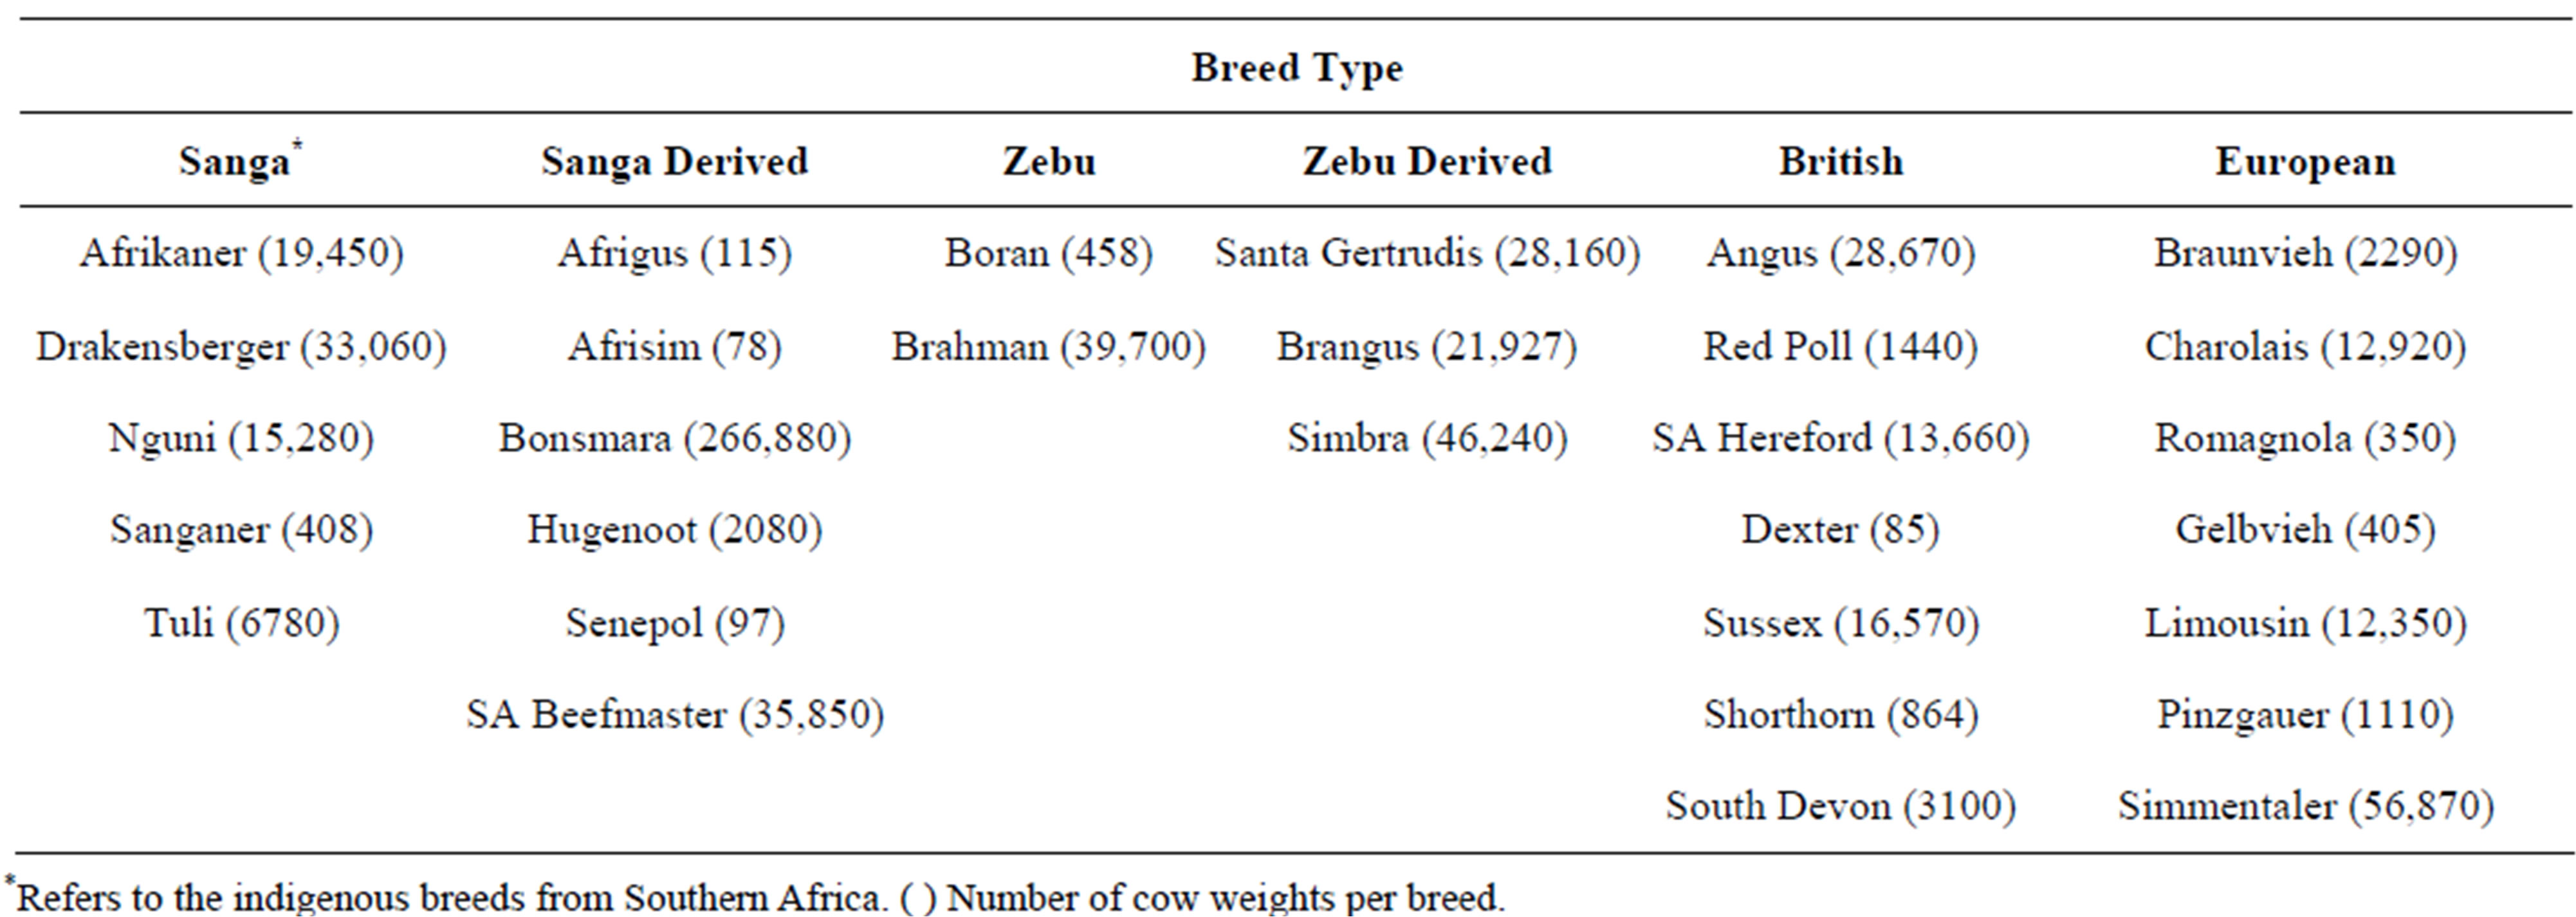
Table 1. Breeds, breed types and number of cow weights per breed.
unit and calf weaning weight with the calf/cow weight ratio and KgC/LSU were also estimated.
3. RESULTS
In Table 2 the breed type weighted averages for cow weight at birth of calf, LSU units, corrected 205 day weaning weight (205 WW), KgC/LSU and the total number of weaning records is summarized. As expected the Sanga breed types had the lowest cow weights and the European breed types the heaviest cow weights. In Table 3 the Spearman correlations of cow weight, cow LSU unit and calf weaning weight with the calf/cow weight ratio and KgC/LSU are indicated. The relationship between cow weight and KgC/LSU is also presented in Figure 1. Both Table 2 and Figure 1 indicate that KgC/ LSU is independent of cow weight between breeds. The relationship between cow weight and the calf/cow weight ratio is presented in Figure 2. Both Table 2 and Figure 2 demonstrate that there is a negative relationship between cow weight and the calf/cow weight ratio, indicating that the calf/cow weight ratio that is currently being used in South Africa (and other countries) may favour smaller cows. In Figure 3 the KgC/LSU per breed type from Table 1 is illustrated.
From Table 2 and Figure 3, it can be noted that the Sanga and European breed types produce the least KgC/ LSU (possibly a higher carbon footprint) and the Sanga derived breed types the most (possibly a lower carbon footprint).
4. DISCUSSION
It was found that KgC/LSU is independent of cow weight, which is contrary to the calf/cow weight ratio which favours smaller cows. For a trait to be considered as a selection criterion to improve the trait in the breeding objective, it should be correlated to the trait in the breeding objective. No correlation between cow weight and KgC/LSU was found in this study.
These calculations were only done on breed averages.
The next step should be to do a genetic analysis on a breed level to estimate genetic parameters for the trait KgC/LSU, and its genetic correlations with other traits of relevance (e.g. weaning weight, cow weight, cow LSU) before a decision can be taken whether selection for it will be feasible. The use of ratios to adjust one correlated trait for another is fairly commonplace, albeit that there are statistical arguments that restrict the appropriate use of ratios to certain circumstances [16]. For example, the use of the ratio of calf weaning weight to cow weight as
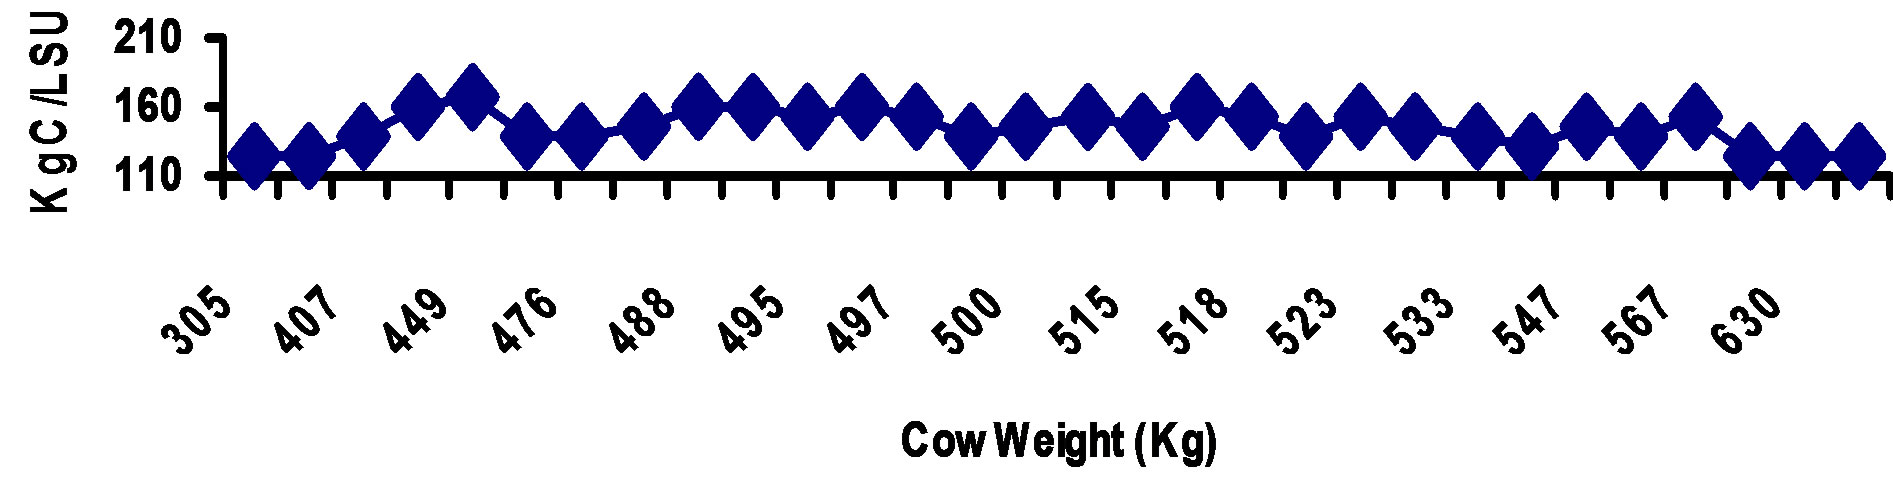
Figure 1. The relationship between kilogram calf weaned/LSU (KgC/LSU) and cow weight.
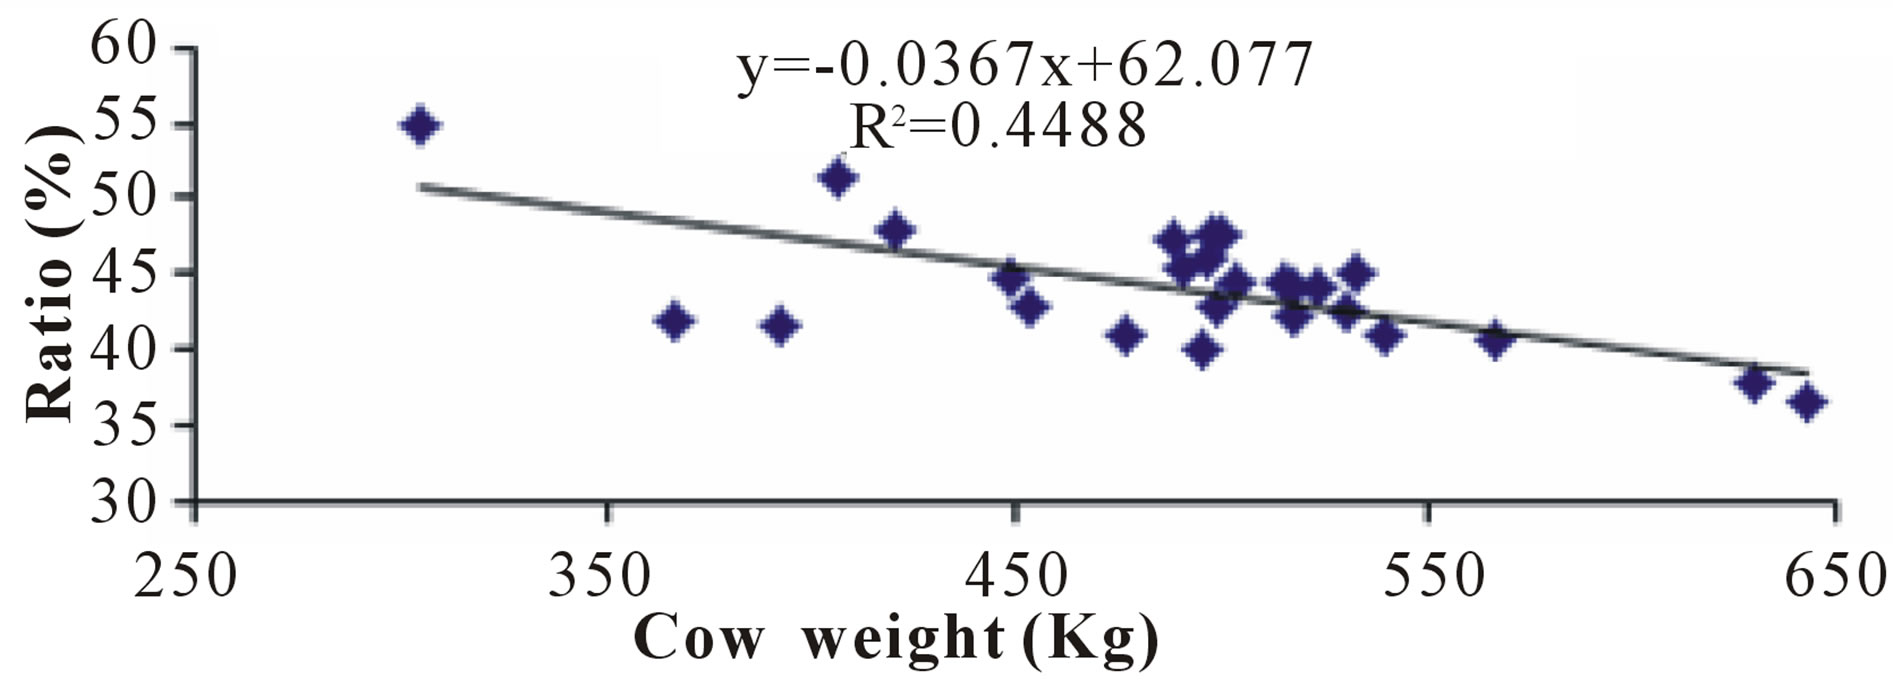
Figure 2. The relationship between the calf to cow weight ratio and cow weight.
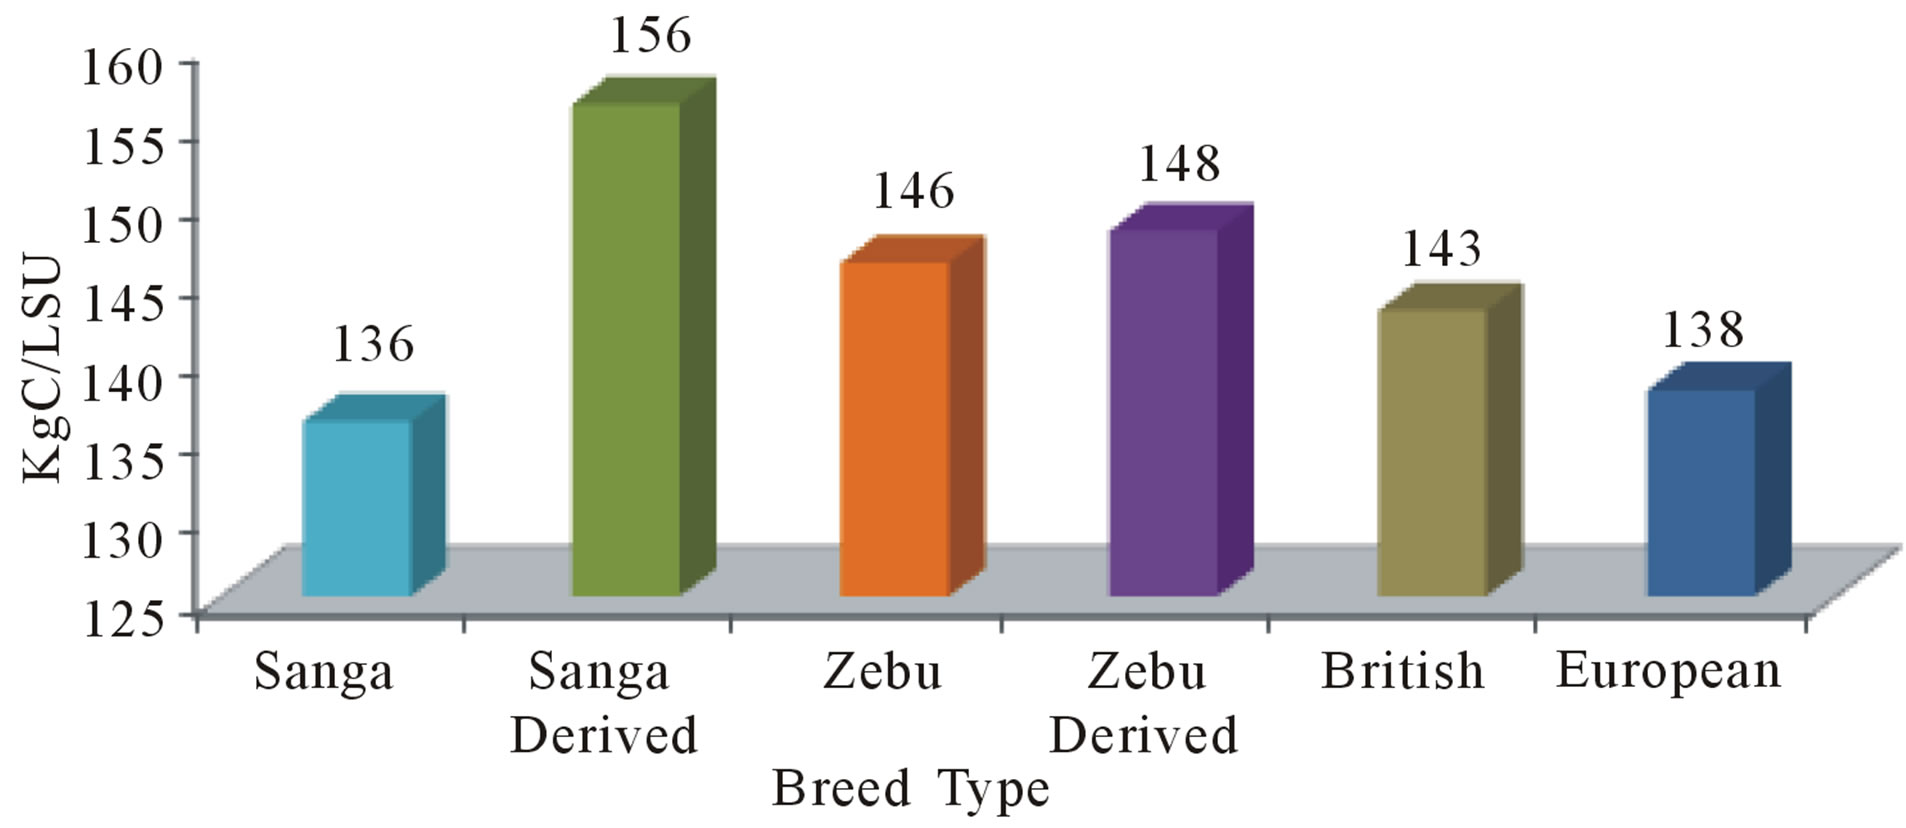
Figure 3. KgC/LSU summarized per breed type.
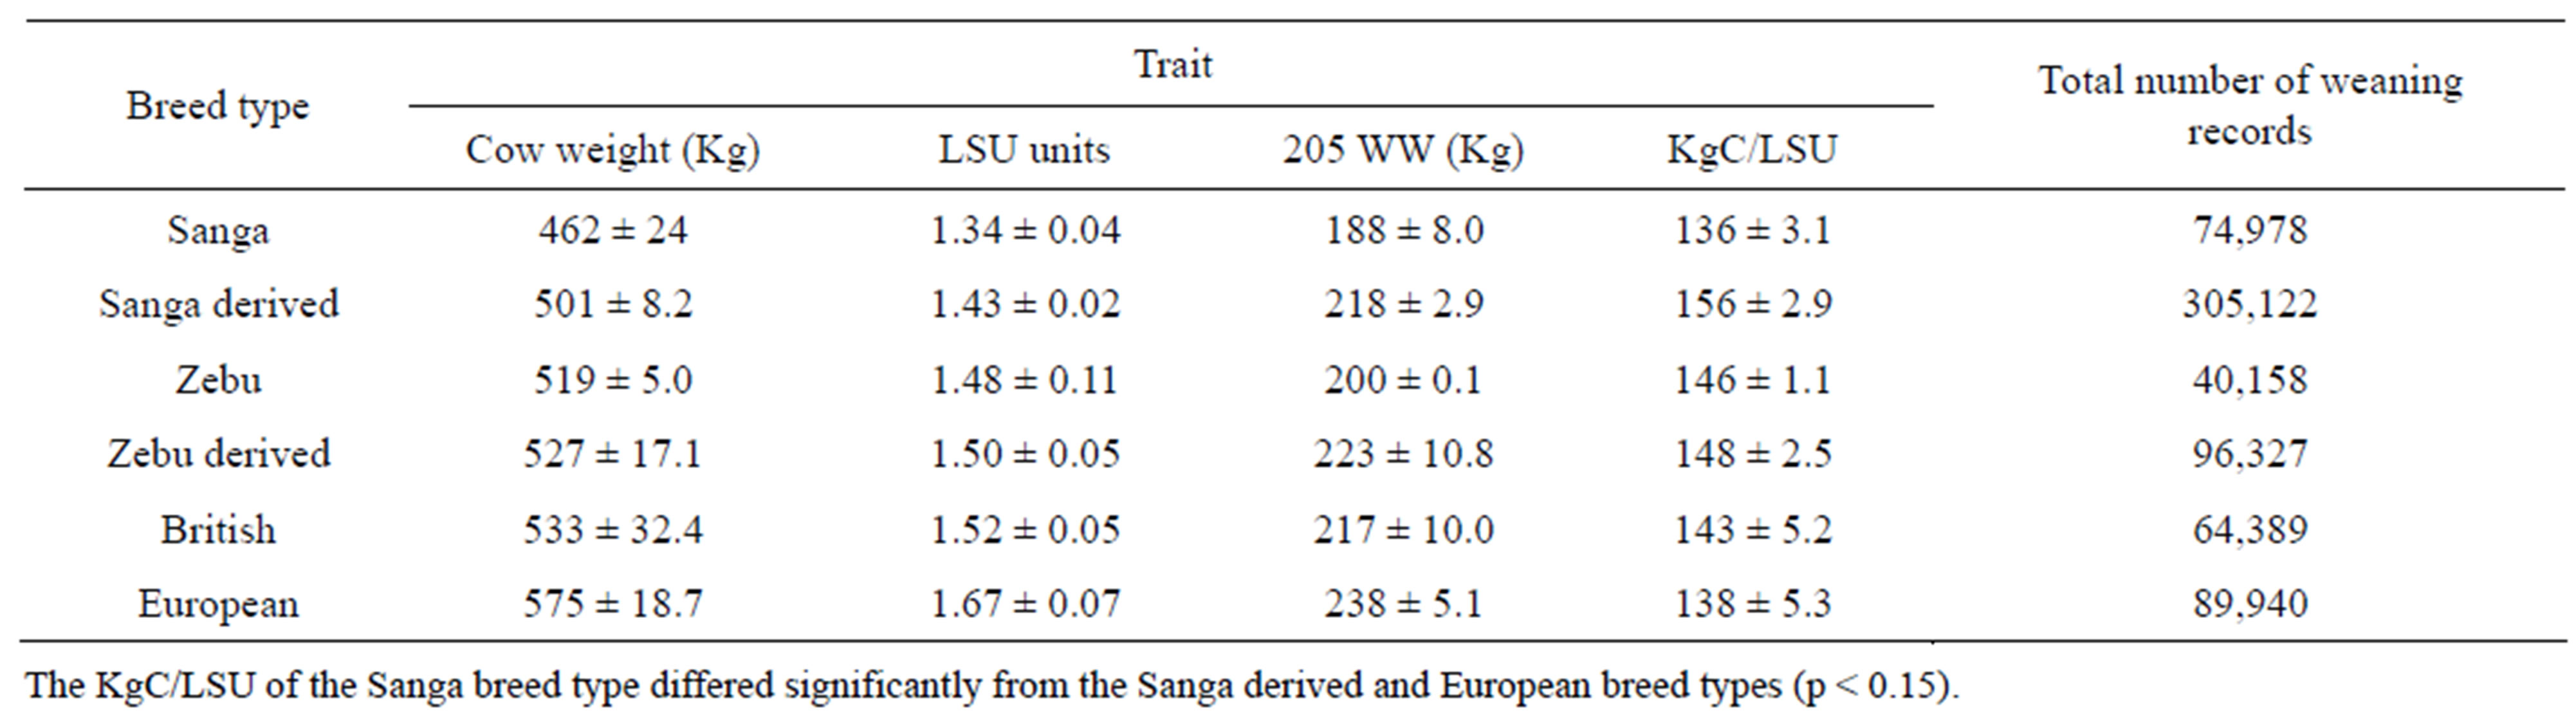
Table 2. Weighted average cow weights, LSU units, 205 day weight, KgC/LSU, standard error of means and the total number of weaning records by breed type.
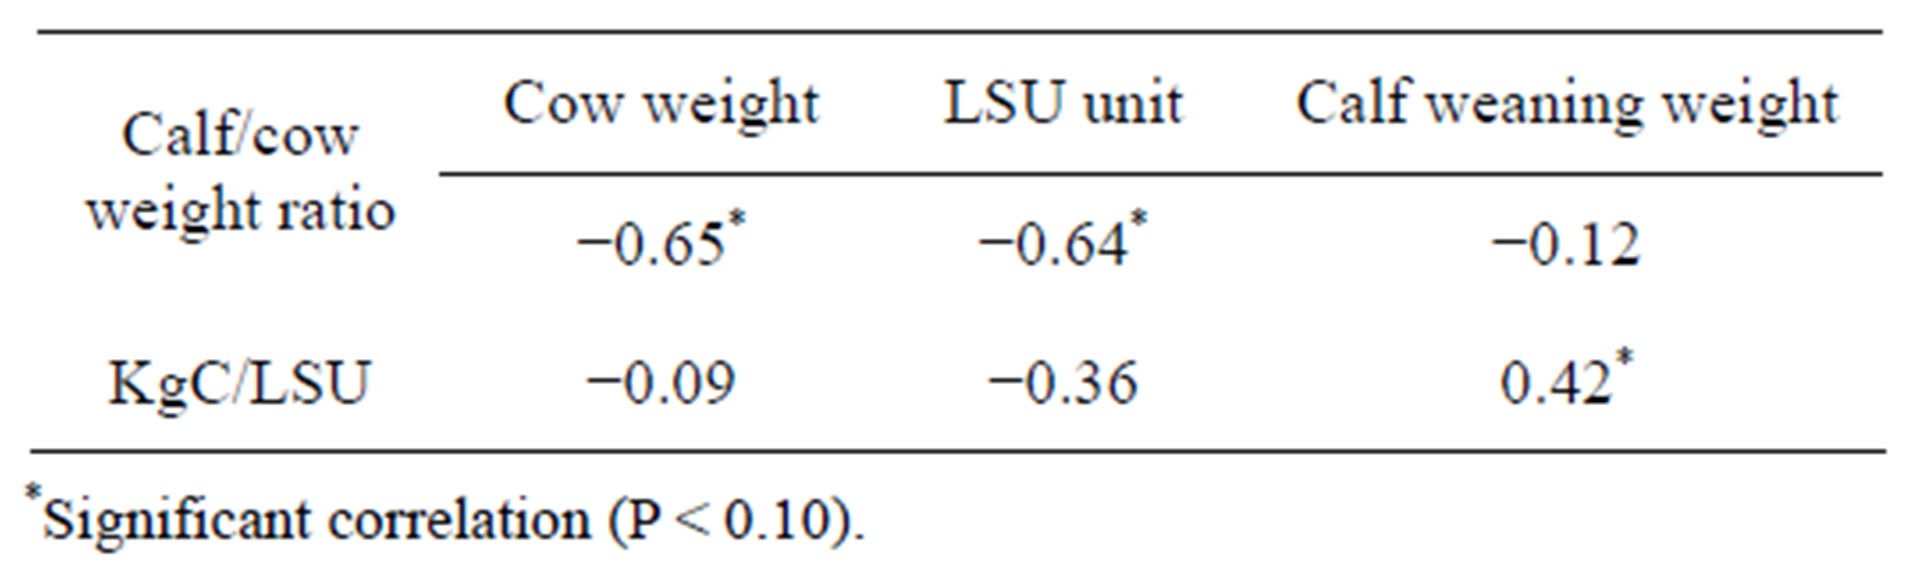
Table 3. Spearman correlations between cow weight, cow LSU unit and calf weaning weight with the calf/cow weight ratio and KgC/LSU.
a selection criterion has theoretical defects and places inconsistent emphasis on the component traits resulting in variable responses to selection [17]. However, the fact that KgC/LSU is independent of cow weight when calculated on breed averages, warrants further investigations before a decision is taken in this regard.
5. CONCLUSION
The fact that there are differences in the KgC/LSU between certain breed types, points to genetic differences, providing the potential for improvement through selection. Genetic improvement produces permanent and cumulative changes in animal performance.
The next step will be to identify possible selection criteria that can be used to achieve the breeding objective, namely to increase the weaning weight of calves in relation to a cow LSU unit (75 MJ Metabolisable Energy need per day) in extensive beef production systems. The combination of calf weight and cow LSU unit in a selection index will probably be the most feasible option and such a selection index should be investigated. Normally, the traits in a selection index are weighed with their economic value. However, in this case the traits will have to be assigned weights that can be linked to carbon footprints or credits (sequestration,) and not economic weights. Unfortunately, such carbon footprint or credit weights are currently not available, but it should be available in the near future.
6. ACKNOWLEDGEMENTS
This research is financially supported by RMRD SA (Red Meat Research and Development South Africa) and THRIP (Technology and Human Resources for Industry Programme) of South Africa
REFERENCES
- Steinfeld, H., Gerber, P., Wassenaar, T., Castel, V., Rosales, M. and de Haan, C. (2006) Livestock’s long shadow: Environmental issues and options. FAO, Rome, 390.
- Pitesky, M.E., Stackhouse, K.R. and Mitloehner, F.M. (2009) Clearing the air: Livestock’s contribution to climate change. Advances in Agronomy, 103, 1-40. doi:10.1016/S0065-2113(09)03001-6
- Meissner, H.H., Scholtz, M.M. and Schönfeldt, H.C. (2012) The status, socio-economic and environmental impact, and challenges of livestock agriculture in South Africa. www.rmrdsa.co.za
- IPCC (2007) Climate change 2007: Synthesis report. Contribution of working groups I, II and III to the fourth assessment report of the Intergovernmental Panel on Climate Change. IPCC, Geneva.
- Clark, H., Klein, C. and Newton, P. (2001) Potential management practices and technologies to reduce nitrous oxide, methane and carbon dioxide emissions from New Zealand agriculture. Ministry of Agriculture and Forestry, Ngaherehere. http://www.maf.govt.nz/mafnet/rural-nz/sustainable-resource-use/climate/green-house-gas-migration/ghg-mitigation.htm
- Garnett, T. (2010) Intensive versus extensive livestock systems and greenhouse gas emissions. Food Climate Research Network Briefing Paper. http://www.fcrn.org.uk/sites/default/files/FCRN_int_vs_ext_livestock.pdf
- Capper, J.L. (2011) Replacing rose-tinted spectacles with a high-powered microscope: The historical versus modern carbon footprint of animal agriculture. Animal Frontiers 1, 26-32. doi:10.2527/af.2011-0009
- Rmrd, S.A. (2012) Research and development plan for the large and small stock meat industries in South Africa, 2012-2013. www.rmrdsa.co.za
- Ferrell, C.L. and Jenkins, T.G. (1982) Efficiency of cows of different size and milk production potential. Rlhusmarc Germ Plasm Evaluation Report 10:12.
- Scholtz, M.M., Steyn, Y., van Marle-Köster, E. and Theron, H.E. (2012) Improved production efficiency in cattle to reduce the carbon footprint of beef. South African Journal of Animal Science, 42, 450-453. doi:10.4314/sajas.v42i5.1
- Wall, E., Simm, G. and Moran, D. (2010) Developing breeding schemes to assist mitigation of greenhouse gas emissions. Animal, l4, 1-11. http://journals.cambridge.org/download.php?file=%2F23244_2DAE6017E006E2DC33F2C51B28655EAB_journals__ANM_ANM4_03_S175173110999070Xa.pdf&cover=Y&code=5613ceca0ea6daec8a9e7b504bdd5319
- Schoeman, S.J. (2010) Crossbreeding in beef cattle. In: Scholtz, M., Ed., Beef Breeding in South Africa. 2nd Edition, ARC, Pretoria, 21-32.
- Meissner, H.H., Hofmeyr, H.S., Van Rensburg, W.J.J.l. and Pienaar, J.P. (1983) Classification of livestock for realistic prediction of substitution values in terms of a biologically defined large stock unit. Department of Agriculture, Pretoria.
- Thorne, M.S. and Stevenson, M.H. (2007) Stocking rate: The most important tool in the toolbox. College of Tropical Agriculture and Human Resources. University of Hawaii, Manoa. http://www.ctahr.hawaii.edu/oc/freepubs/pdf/PRM-4.pdf
- Neser, F.W.C. (2012) Unpublished. http://www.rpo.co.za/documents/pptrpo/proffrikkieneser.pdf
- Weil Jr., W.B. (1962) Adjustment for size—A possible misuse of ratios. American Journal of Clinical Nutrition, 11, 49. http://ajcn.nutrition.org/content/11/3/249.short
- MacNeil, M.D. (2007) Retrospective analysis of selection applied to a ratio. American Society of Animal Science, 58. www.ars.usda.gov/research/publications/publications.html