Natural Science
Vol.4 No.8A(2012), Article ID:21655,9 pages DOI:10.4236/ns.2012.428089
Optimal design and earthquake-resistant design evaluation of low-rise framed RC structure
![]()
1Structural Engineering Department, School of Civil Engineering, Lisandro Alvarado University, Barquisimeto, Venezuela; *Corresponding Author: hreyes@ucla.edu.ve, reyes.indira.herrera@upc.edu
2Technical University of Catalonia, Barcelona, Spain
Received 30 May 2012; revised 30 June 2012; accepted 14 July 2012
Keywords: Resized Building; Linear Analysis; Nonlinear Analysis; Seismic Response; Torsional Effects
ABSTRACT
This study evaluates the seismic response of an existing two stories RC building using non-linear analysis. The original model was resized and two buildings were designed using two different methodologies to fulfill the Venezuelan codes requirements for a high seismic hazard. An elastic analysis was applied to the original building in order to verify interstory drifts; the resizing building was designed under requirements of strong column-wake beam condition. A third building was modeled according to the seismic displacement-based design procedure. A nonlinear static analysis and 2D and 3D dynamic analyses were performed, obtaining capacity curves, structural ductility, structural performance point, global and interstory drifts for each building. Torsional effects for the resizing building were also computed from 3D analysis. In the original building a weak seismic behavior was obtained, while resized buildings presented a good seismic performance under the Limits States evaluated in this study.
1. INTRODUCTION
Along its history, Venezuela has been severely affected by destructive earthquakes [1]. Approximately 80% of the population lives in seismically active areas, where have occurred destructive earthquakes even in recent times [2]; The seismic hazard, inadequate design and construction of buildings as well as the damage occurred from previous earthquakes, demonstrate a high vulnerability in existing buildings. It is thus essential to continuously make progress and research in the field of earthquake engineering and earthquake resistant design code changes. Upgrades require the evaluation of predictions of the expected damage to structures at the time of an earthquake of a certain severity to occur. From this prediction it can be defined solutions for the reduction of structural vulnerability [3].
The damage occurred in buildings after an earthquake indicates the need for reliable methodologies for the evaluation of seismic behavior of the existing buildings. Ac-cording to current technical and scientific advances, seismic evaluation of reinforced concrete (RC) structures can be done by two different approaches: empirical methods and mechanical methods [4]. The current tendency of earthquake engineering in the evaluation of structural behavior is the application of simplified mechanical methods based on performance, involving the capacity spectrum [5], because there are developed refined models and detailed analysis.
This study used a mechanical method that involves non-linear analysis with deterministic and probabilistic approaches, as well as procedures of analysis based on Limits States defined by displacement [6], in order to evaluate the behavior of a low rise RC building with asymmetry in plant, designed according to Venezuelan codes [7-9] and subjected to seismic action effect. Through the use of mathematical models and computational tools, seismic behavior of the building is obtained in a suitable way.
2. METHODOLOGY
2.1. Case of Study
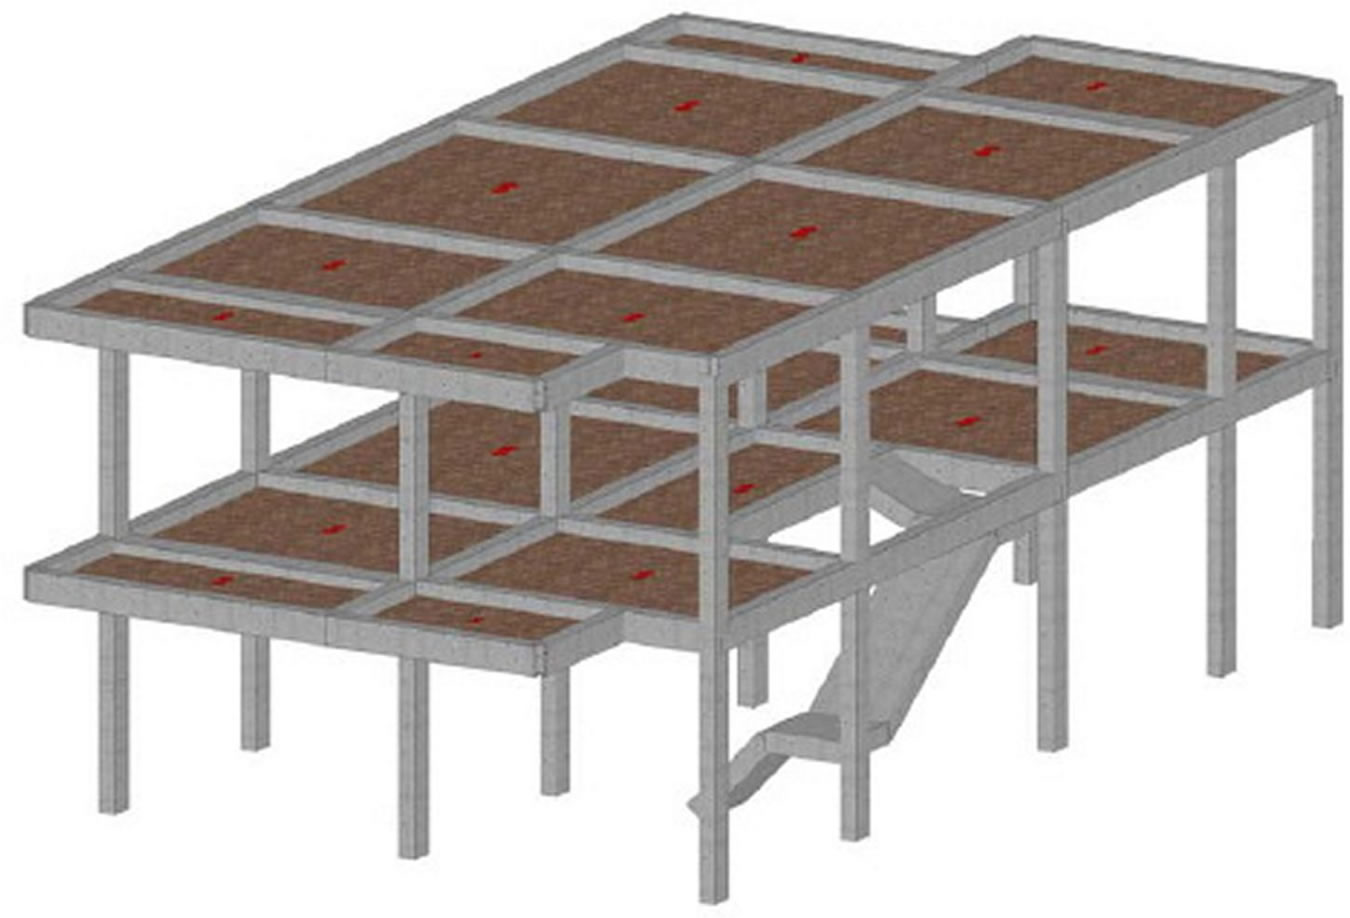
A two story RC framed building with residential use is analyzed, (Figure 1(a)), which contains internal staircase and 220 m2 total plant area. It was designed a mathematical model, called original building (OB), with plan asymmetry (Figure 1(b)) and slab armed in direction X with a 25 cm depth one-way ribbed slab. It was designed a second model adjusted to seismic resistance requirements, called resizing building (RB), which presents equal geometrical and mechanical characteristics of OB model but considering the “strong column-weak beam” condition. It was also used the method based on displacement, Priestley et al. [10] for the design of a third model called displacement based design building (DBDB). These three models differ only in the dimensions of its structural elements (Table 1).
2.2. Nonlinear Analysis
The structures are modeled by incorporating the structural response when it incurs in the material inelastic range, produced by high deformations caused by accidental excitations (earthquakes) [11]. The analyses were performed using ZEUS-NL soft-ware [12], which allows to model complex structures with “n” number of finite elements, thus to know the elements in the building which are most vulnerable to dam-age. Each building is modeled in two dimensions, spitting each frame to get a
 (a)
(a) (b)
(b)
Figure 1. Low rise RC framed building. (a) 3D representation; (b) Asymmetric plant.
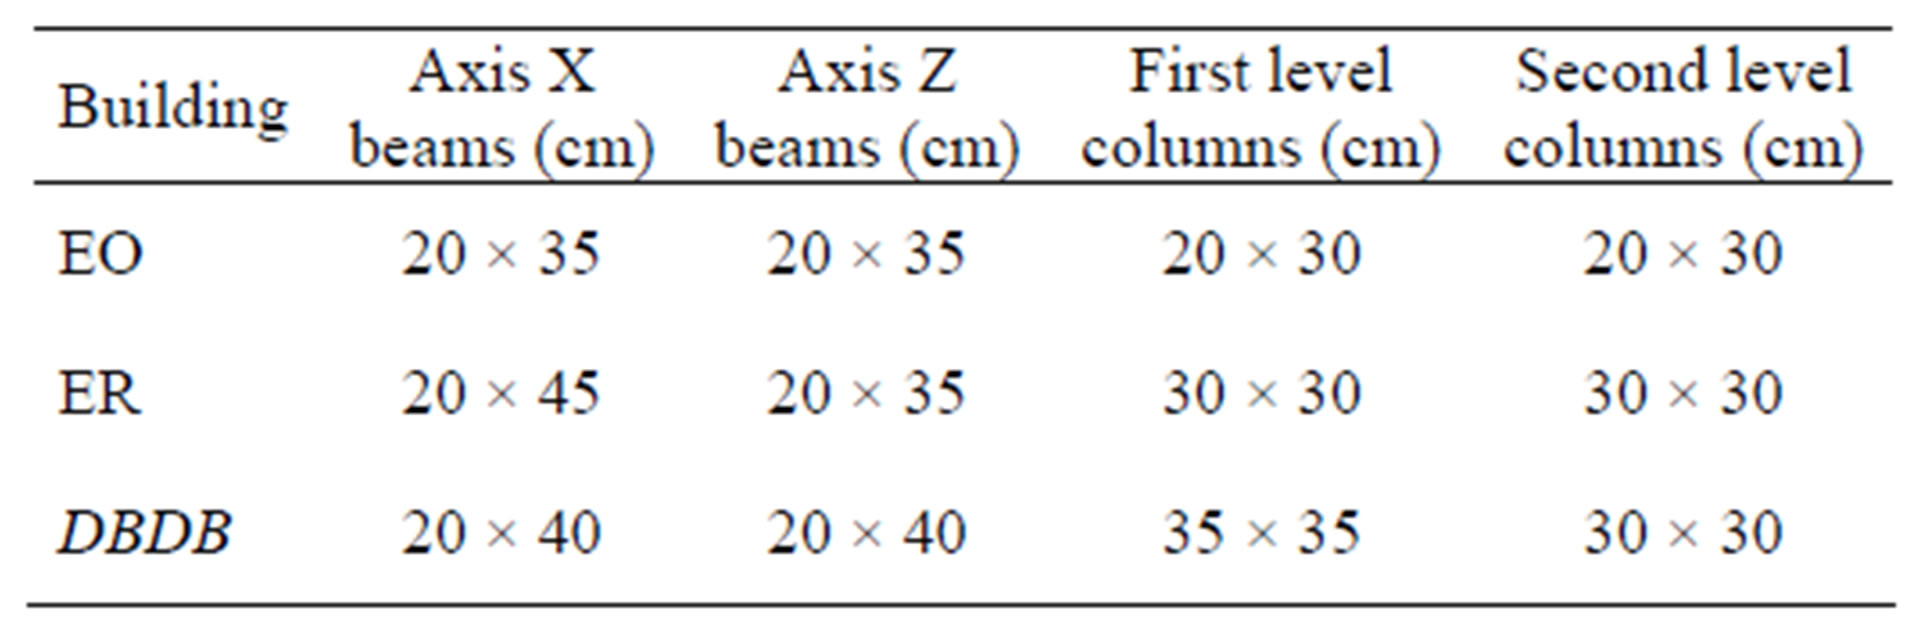
Table 1. Geometric characteristics of elements from each modeled building.
more detailed response for the seismic behavior of each frame; a 3D dynamic analysis was applied to the ER model.
The static Pushover analysis is performed once the frames have been subjected to action of gravity loads, based on the pseudo-static application of lateral forces equivalent to displacements of seismic action [5]. The pattern of representatives lateral seismic loads is increasing loads with height (triangular distribution) applied in the monotonic form until the structure reaches its maximum capacity [13].
This procedure applies a solution of equilibrium equations in an incremental iterative form. In small increments of linear loads, equilibrium is expressed as:
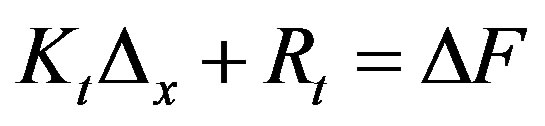 (1)
(1)
where Kt = Tangent stiffness matrix, Rt = Restorative forces at the beginning of the increased load. Restorative forces are calculated from:
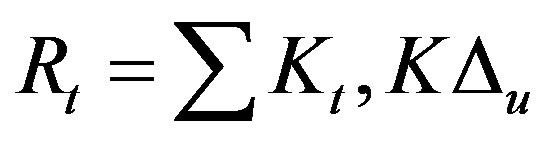 (2)
(2)
while this procedure is applied, the resistance of the structure is evaluated from it is balance internal conditions, updating at each step the tangent stiffness matrix. Unbalanced loads are applied again until it can satisfy a criterion of convergence. Then, a new load increase is applied. The increases are applied until a predetermined displacement is reached or until the solution diverges.
From the capacity curve provided in this analysis, it is determined the structural ductility (μ) by the quotient between the ultimate displacement and cadence point displacement, as shown in the following expression:
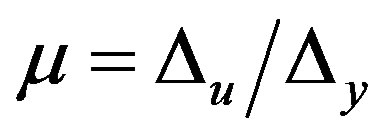 (3)
(3)
where ∆u = Ultimate displacement, ∆y = Cedence point displacement.
Incremental dynamic analysis (IDA) is an analysis method that can be used to estimate structural capacity under seismic loads. It provides continuous response of the structural system from elastic range until it reaches collapse. In this method the structure is subjected to one or more seismic records scaled to intensity levels that increase progressively. The maximum values of response are plotted against the intensity of seismic signal [14,15]. The procedure to perform IDA from the seismic signal is:
• To define a seismic signal compatible with the project scenario;
• To define the scaled earthquake intensity in monotonic form;
• To define the extent of damage or damage Limit States;
• To study a seismic record (IDA) for the dynamic analysis of a structural model parameterized to measure earthquake intensity;
The IDA curve is a graphical representation of the extent of damage in a structure under one or more seismic intensities.
For the dynamic analysis the structures were subjected to seismic action (see Table 2) defined by accelerograms built on the basis of a likely value of maximum acceleration of the soil and the hazard level associated with the location of the structure and other seismic characteristic parameters of the design, [16]. These accelerograms called “synthetic accelerograms” are generated through the implementation of a set of earthquakes with wide frequency content, using the PACED program [17], based on the code’s elastic design spectrum [7]. For the dynamic analysis of the three buildings (OB, RB, DBDB), it were used 3 synthetic accelerograms with duration of 60, 80 and 100 seconds.
These three earthquakes were applied to all frames from the three buildings evaluated, in order to obtain maximum displacement that can be reached by each one. In the software used [12], it was required the implementation of dynamic loads in direction X and the assignation of a control node located in the gravity center of the covert plan.
The 3D non-linear dynamic analysis is based on the procedure raised in [16]. The RB building is analyzed, defining its geometry, materials and sections, serviceability loads in Y direction in all beams-columns joints, and dynamic loads on built-in nodes with directions and combinations shown in Table 3. Ribbed slabs armed in one direction were modeled as rigid diaphragms in its plane (Figure 2).
Once built the model, it was applied the earthquake R1_3 with the combinations shown in Table 3, for the interstory drifts and maximum torsional moments on
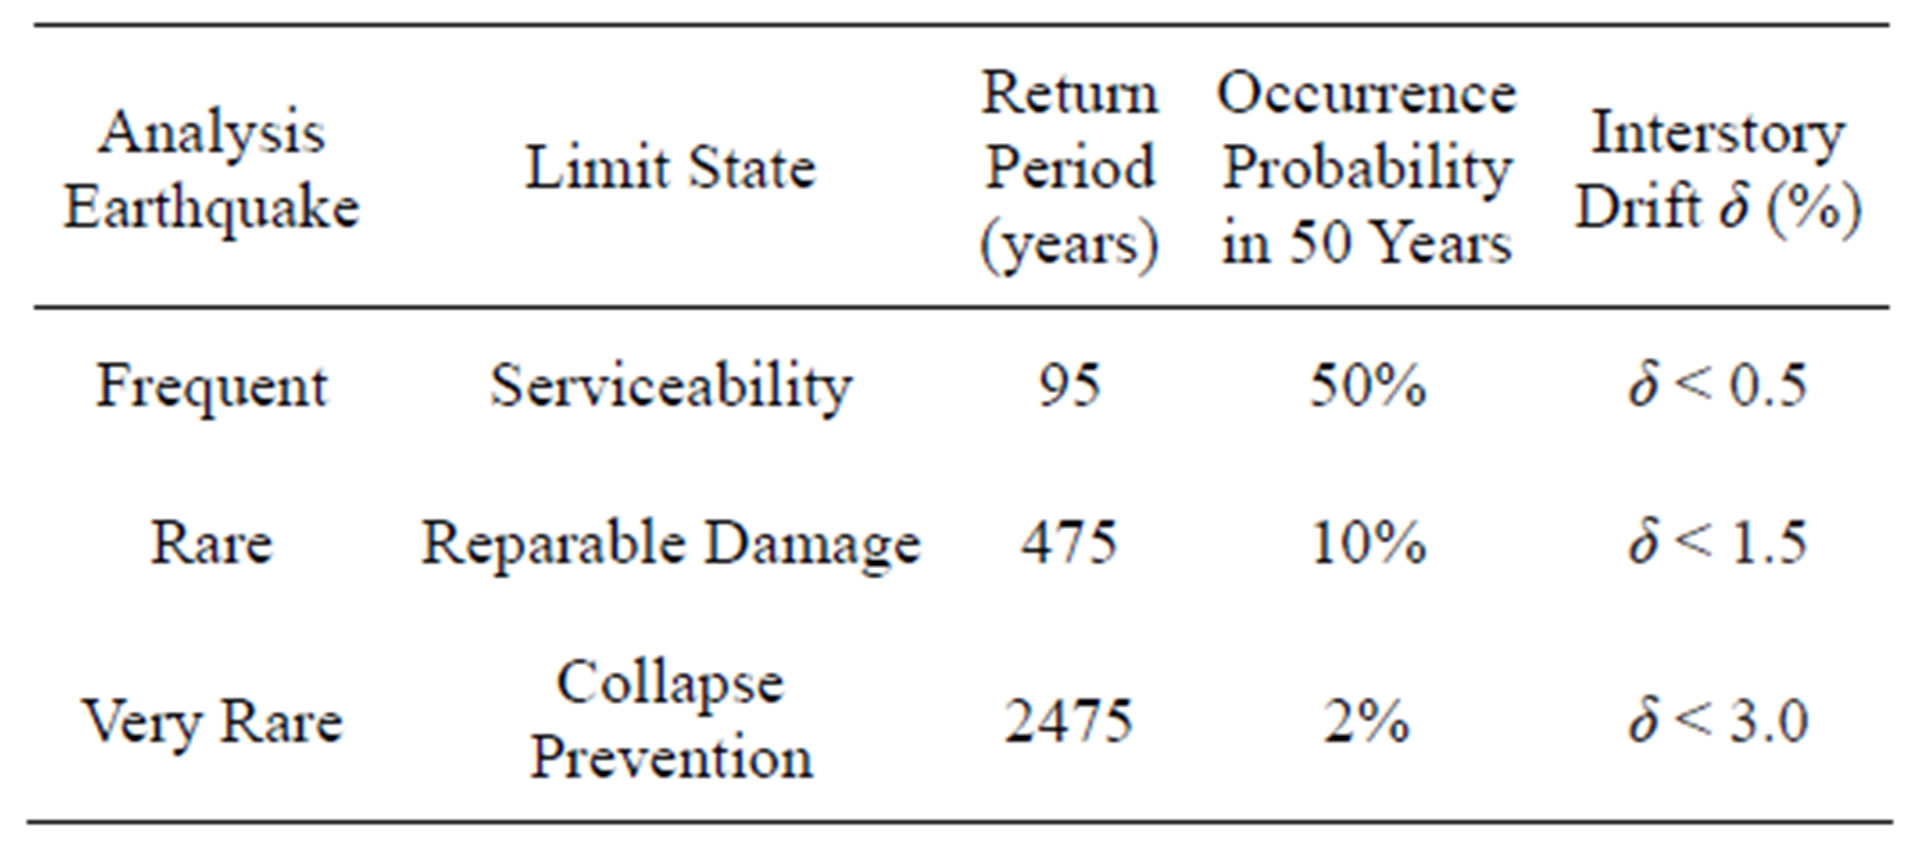
Table 2. Limit States and seismic hazard level.
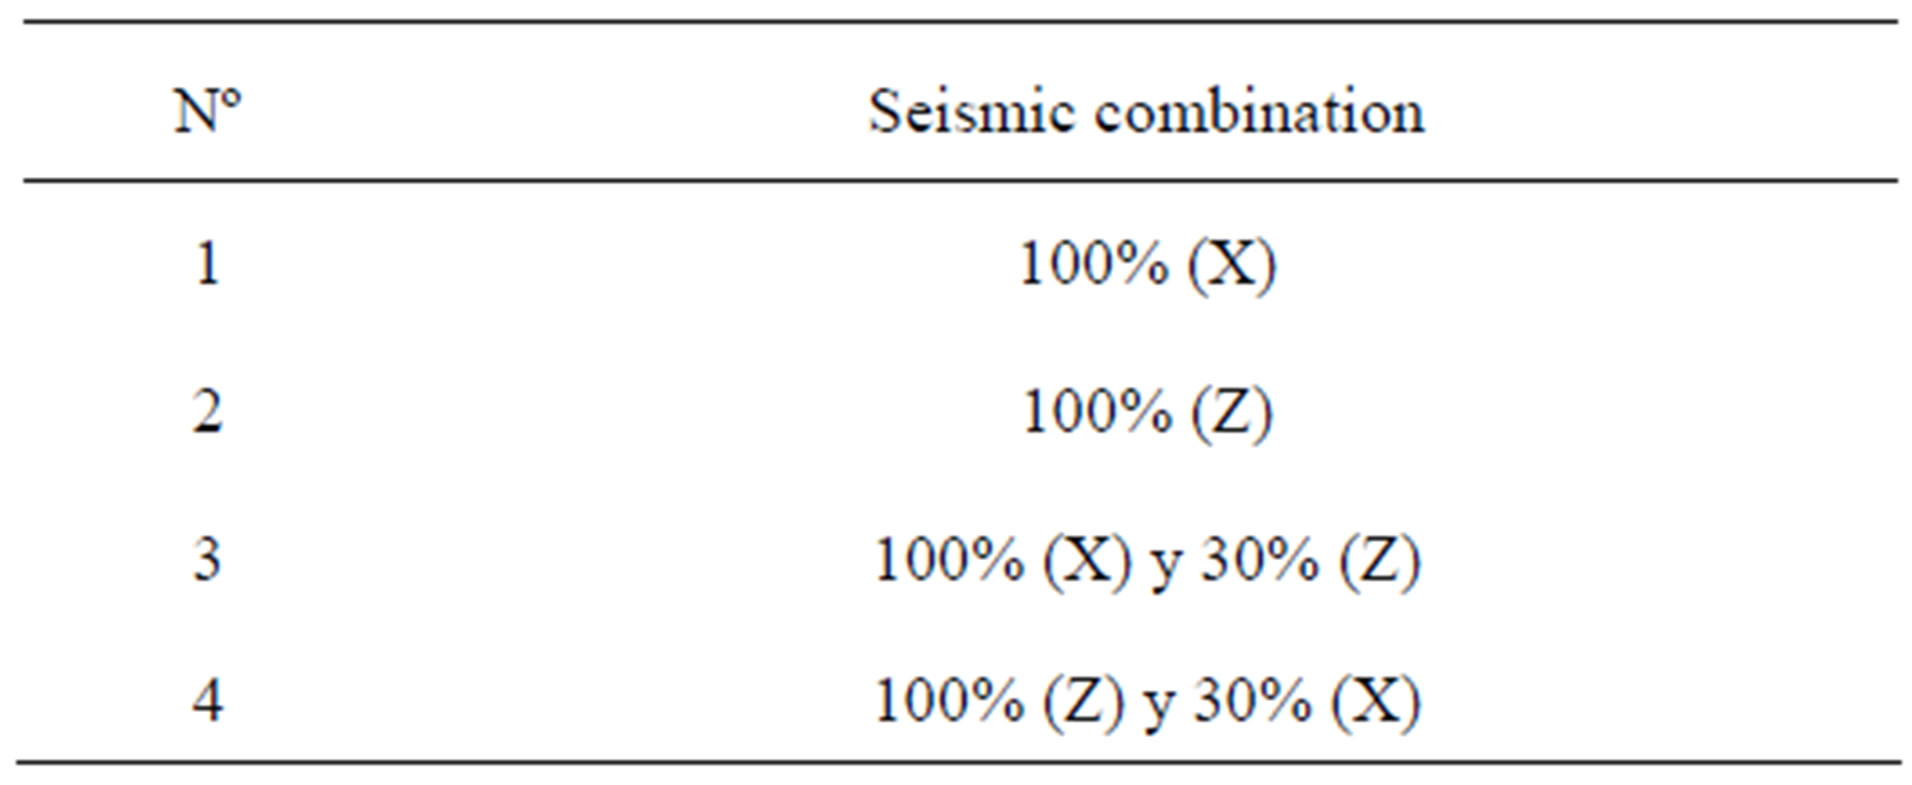
Table 3. Applied seismic combinations.
supports. These combinations are based on the Venezuelan seismic code [7] and following established by [18] about the seismic response of asymmetric structural systems in the inelastic range.
3. RESULTS
Verification of interstory drifts of the OB building, shows that they exceed the limit established in [7], while in the RB model it was obtained that it meets the code’s parameters, which limits the inter storey drift to 0,018. On the other hand, in the DBDB building were not performed drifts verifications, since it was designed based on the method performed in [10], where the generated seismic forces are originally limited to not exceed the limit value of drift specified in the applied code.
3.1. Nonlinear Static Analysis
To determine the values of structural ductility it was necessary to plot the idealized curve in function of the capacity curve, in order to know the point at which the structure begins to yield. Figure 3 shows an example of the normalized capacity curve with the idealized curve of Frame C of OB. Structural ductility for each evaluated building values are presented in Table 4.
From the obtained capacity curves there were identified the Performance point (Pp) of every frame of each evaluated building. Table 5 presents the values of Pp for frames of evaluated buildings. Figure 4 shows the Pp of Frame C from OB building.
3.2. Nonlinear Dynamic Analysis
There were determined global and interstory drifts of each frame from all three models studied. Both types of drifts were calculated on the basis of the application of synthetic accelerograms with different intensities, representing the lateral forces applied to frames in order to to generate their respective maximum displacements. Figures 5-7 show the graphics with the evolution of the
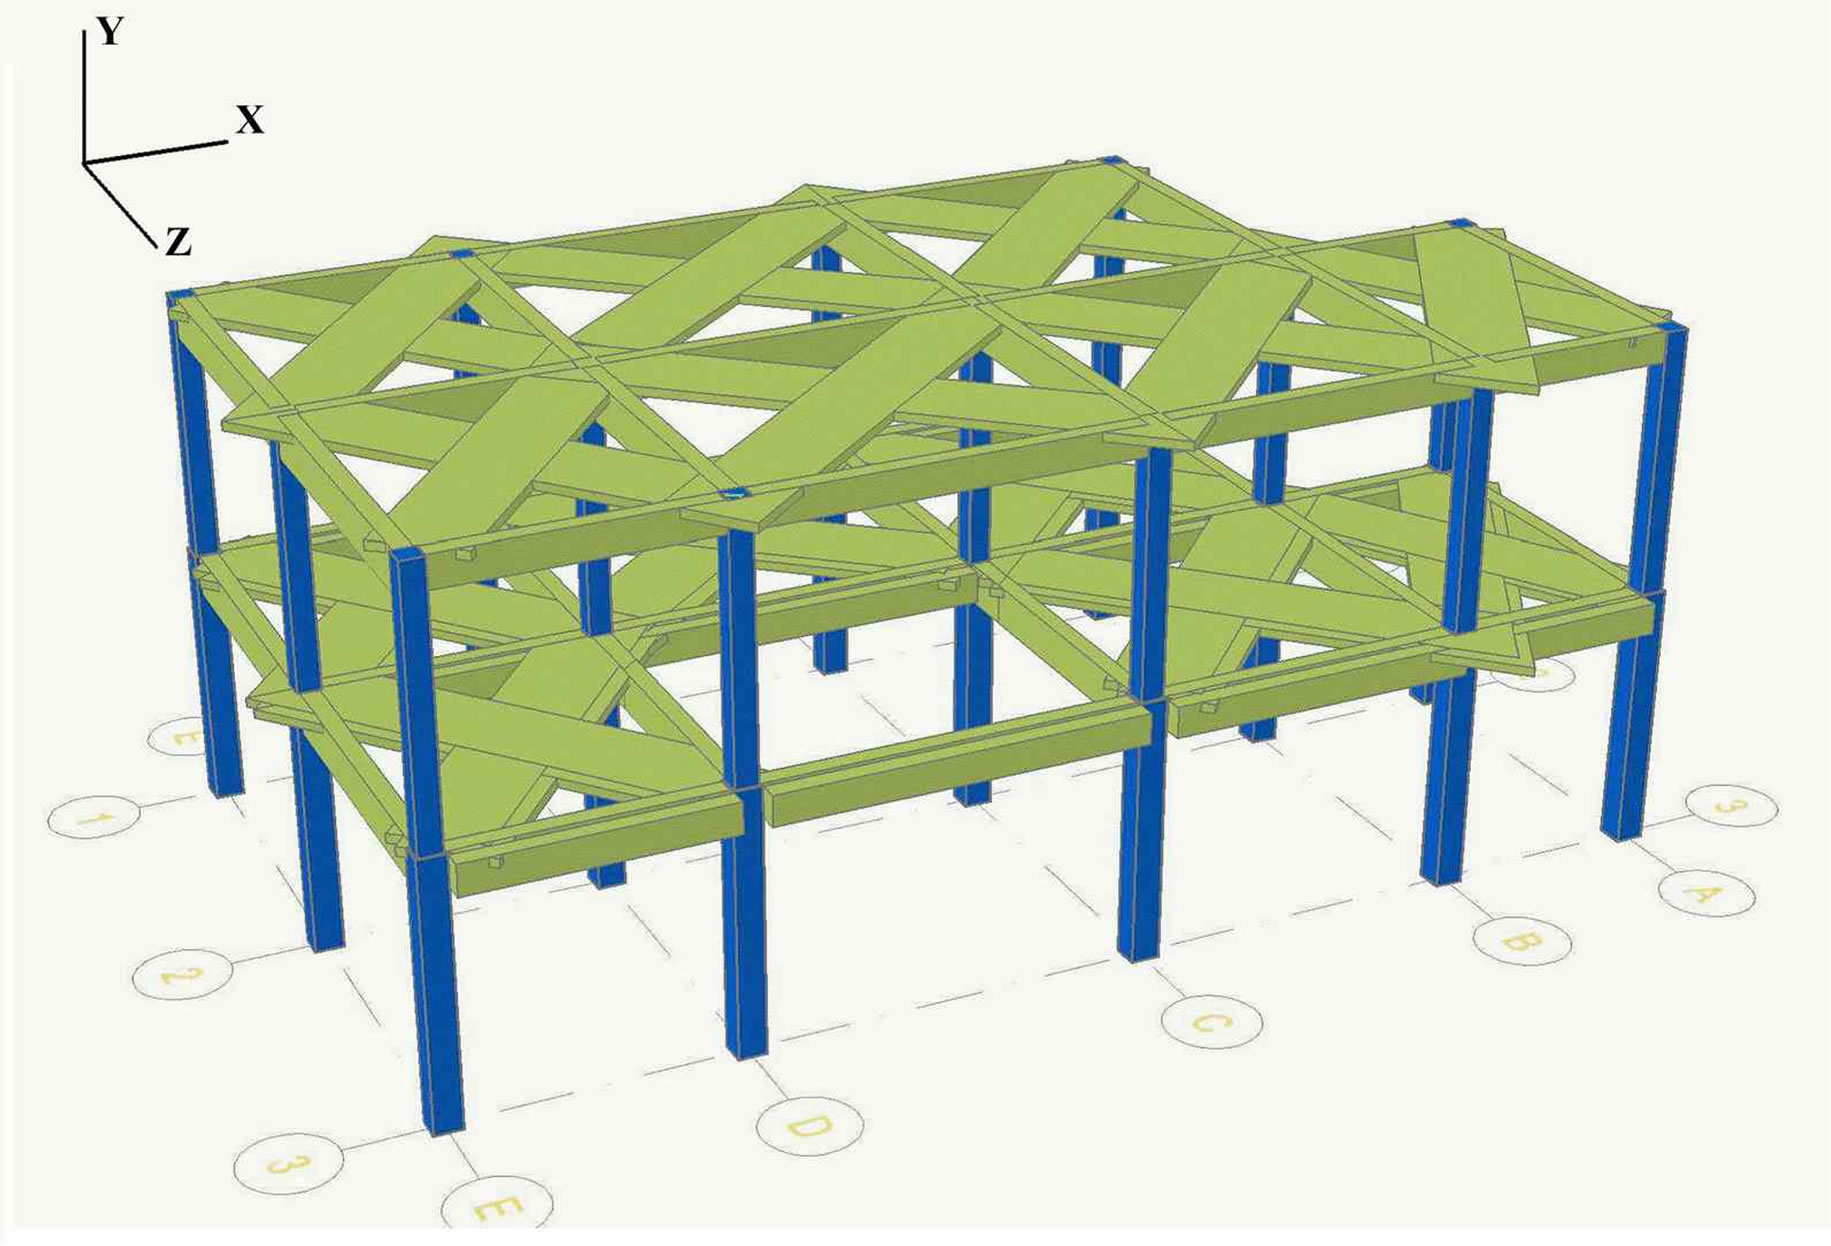
Figure 2. Rigid diaphragms in 3D RB framed building.
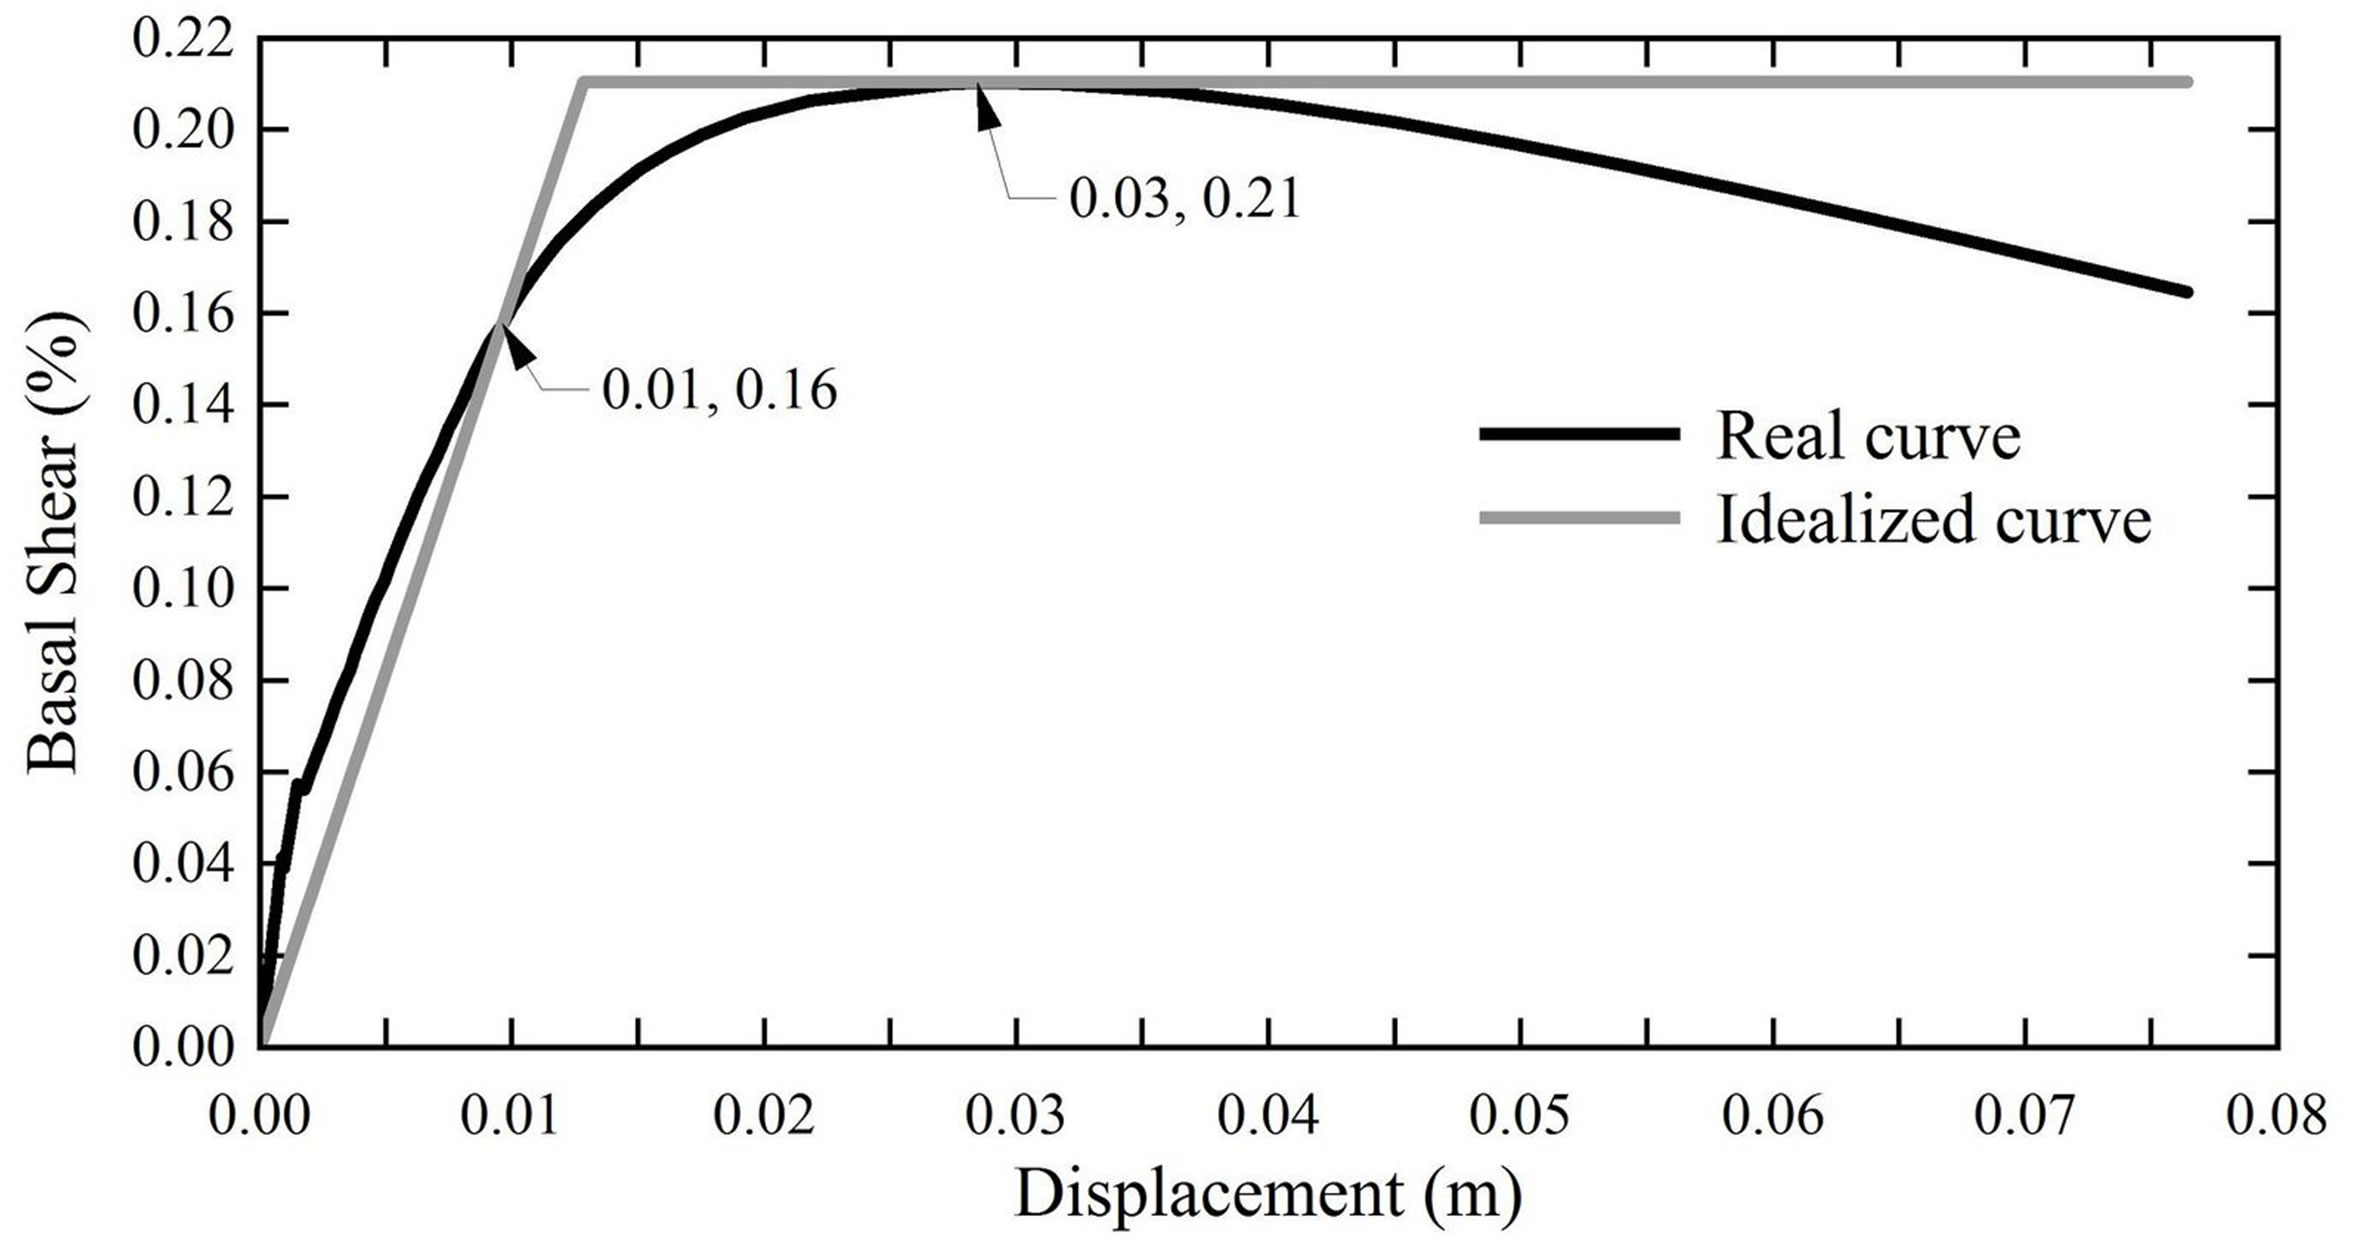
Figure 3. Normalized and idealized capacity curves. Frame C. OB building.
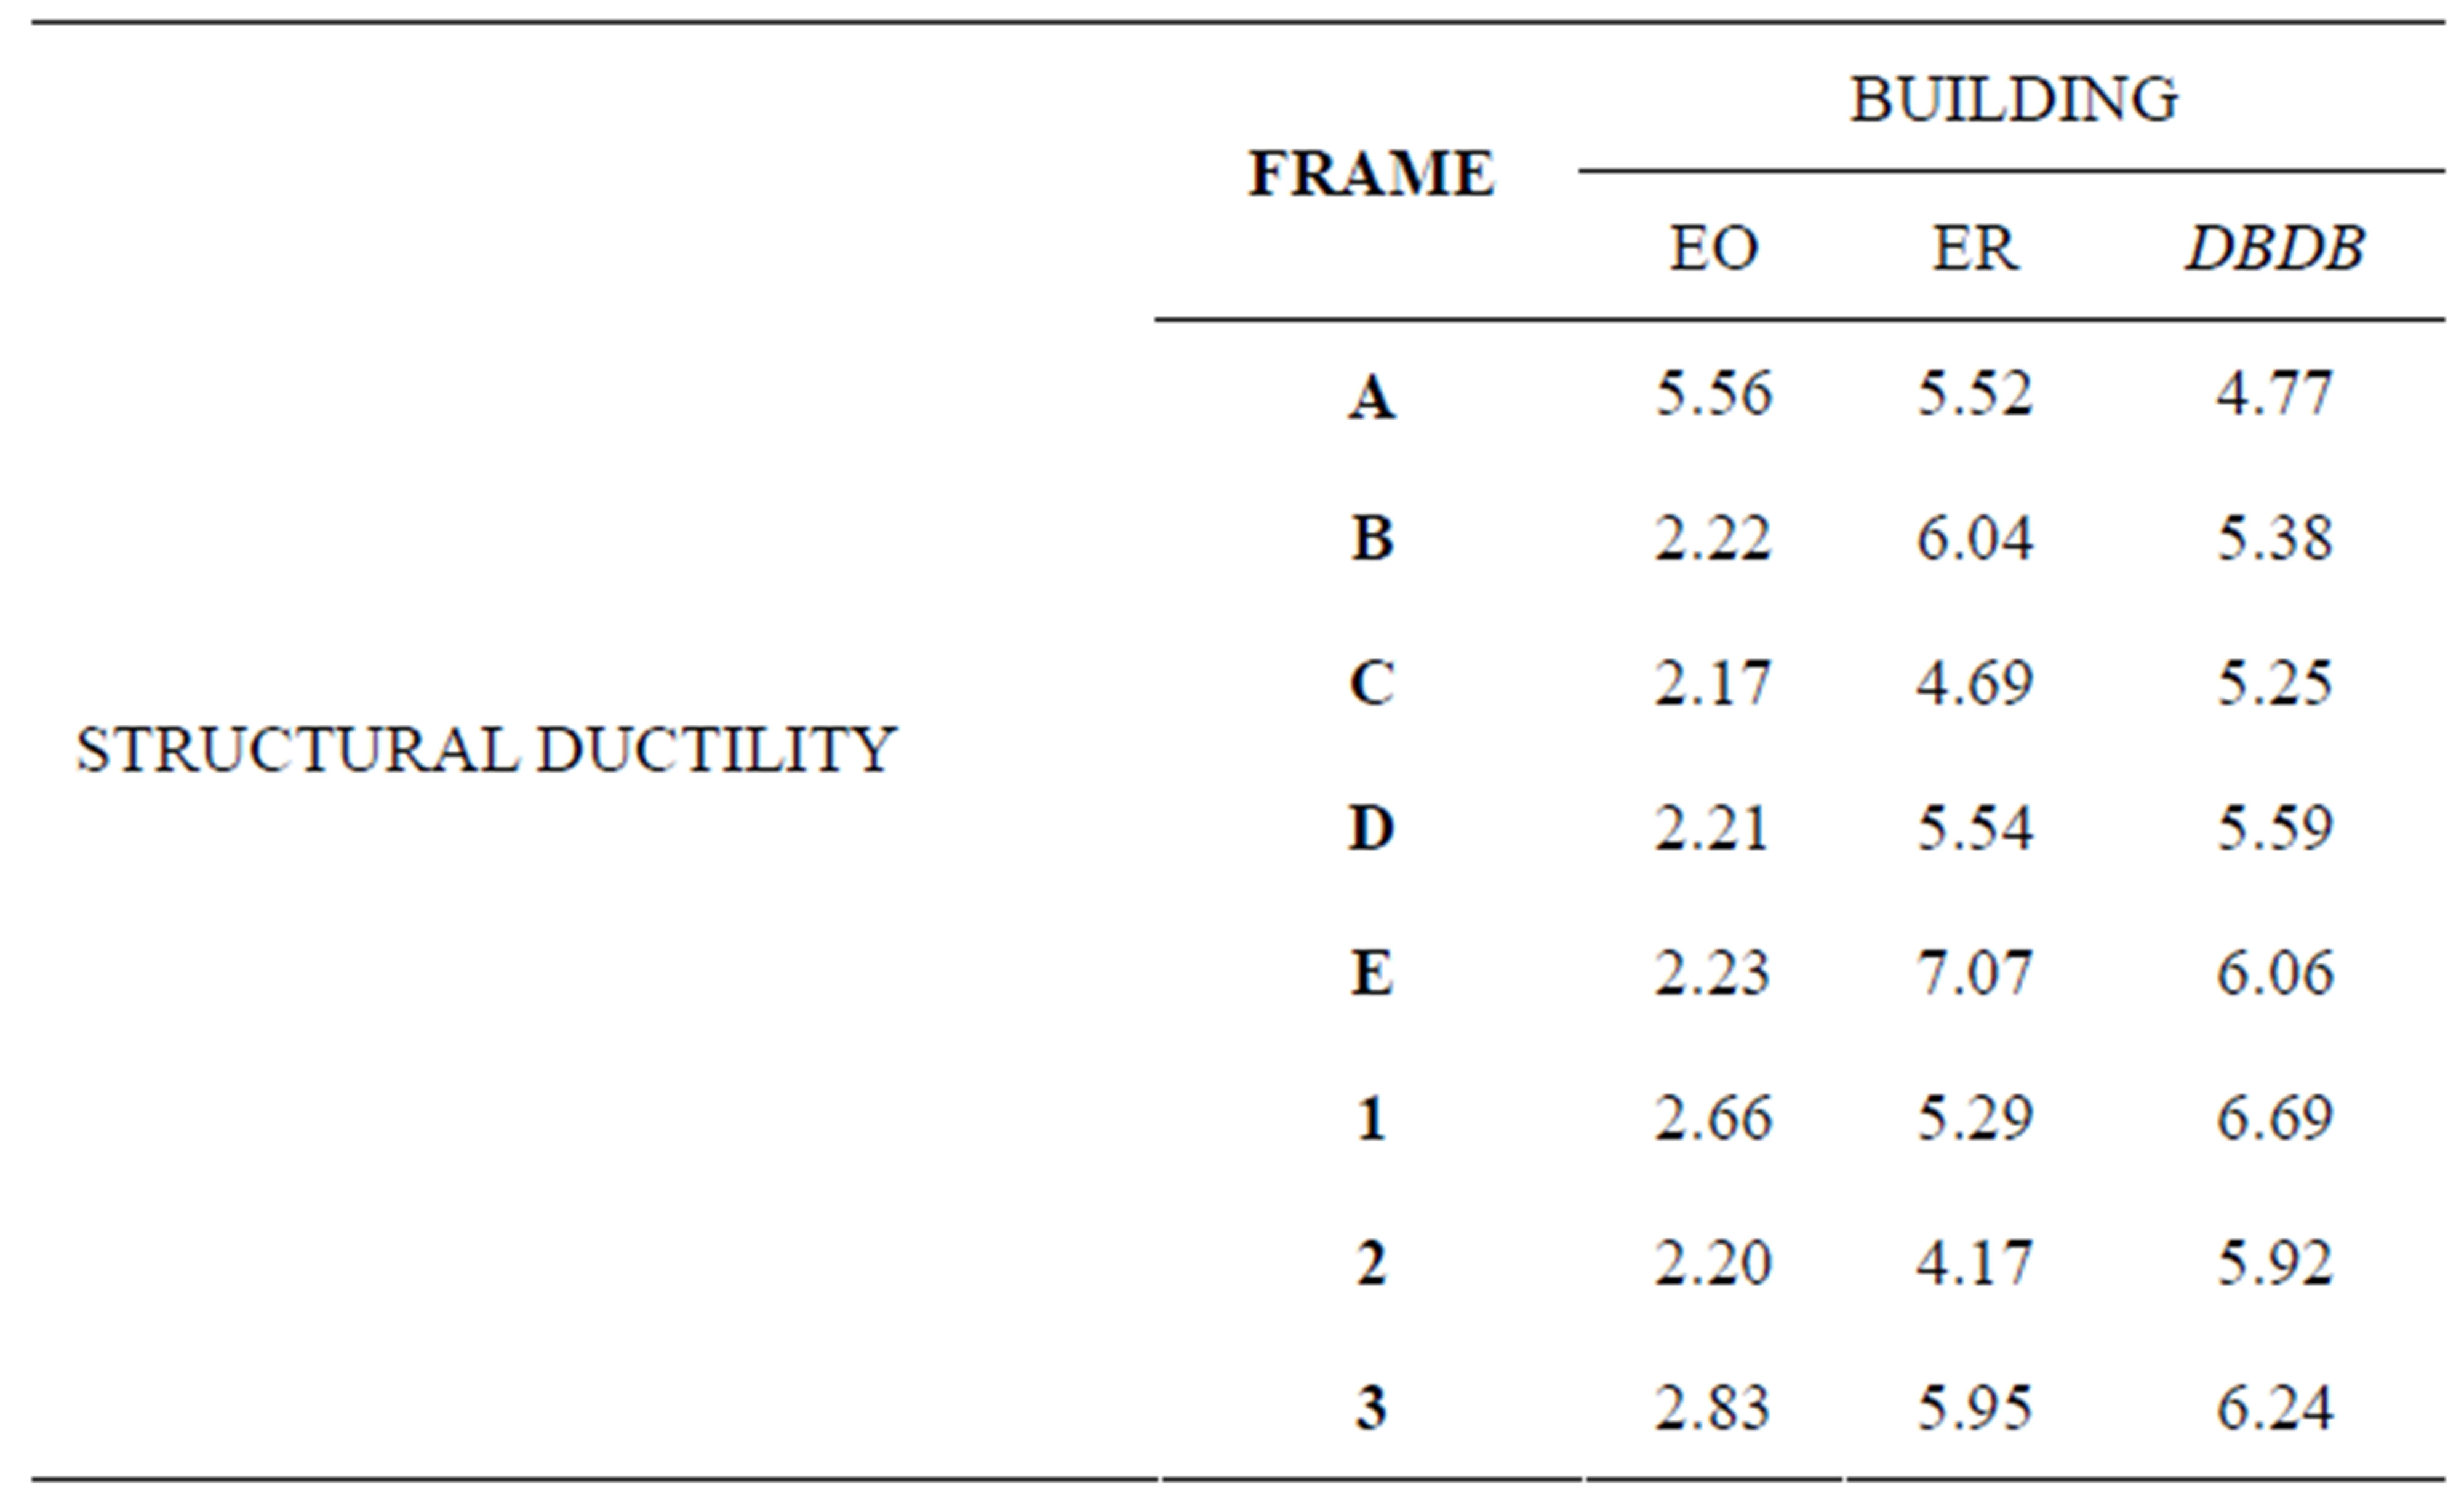
Table 4. Structural ductility results.
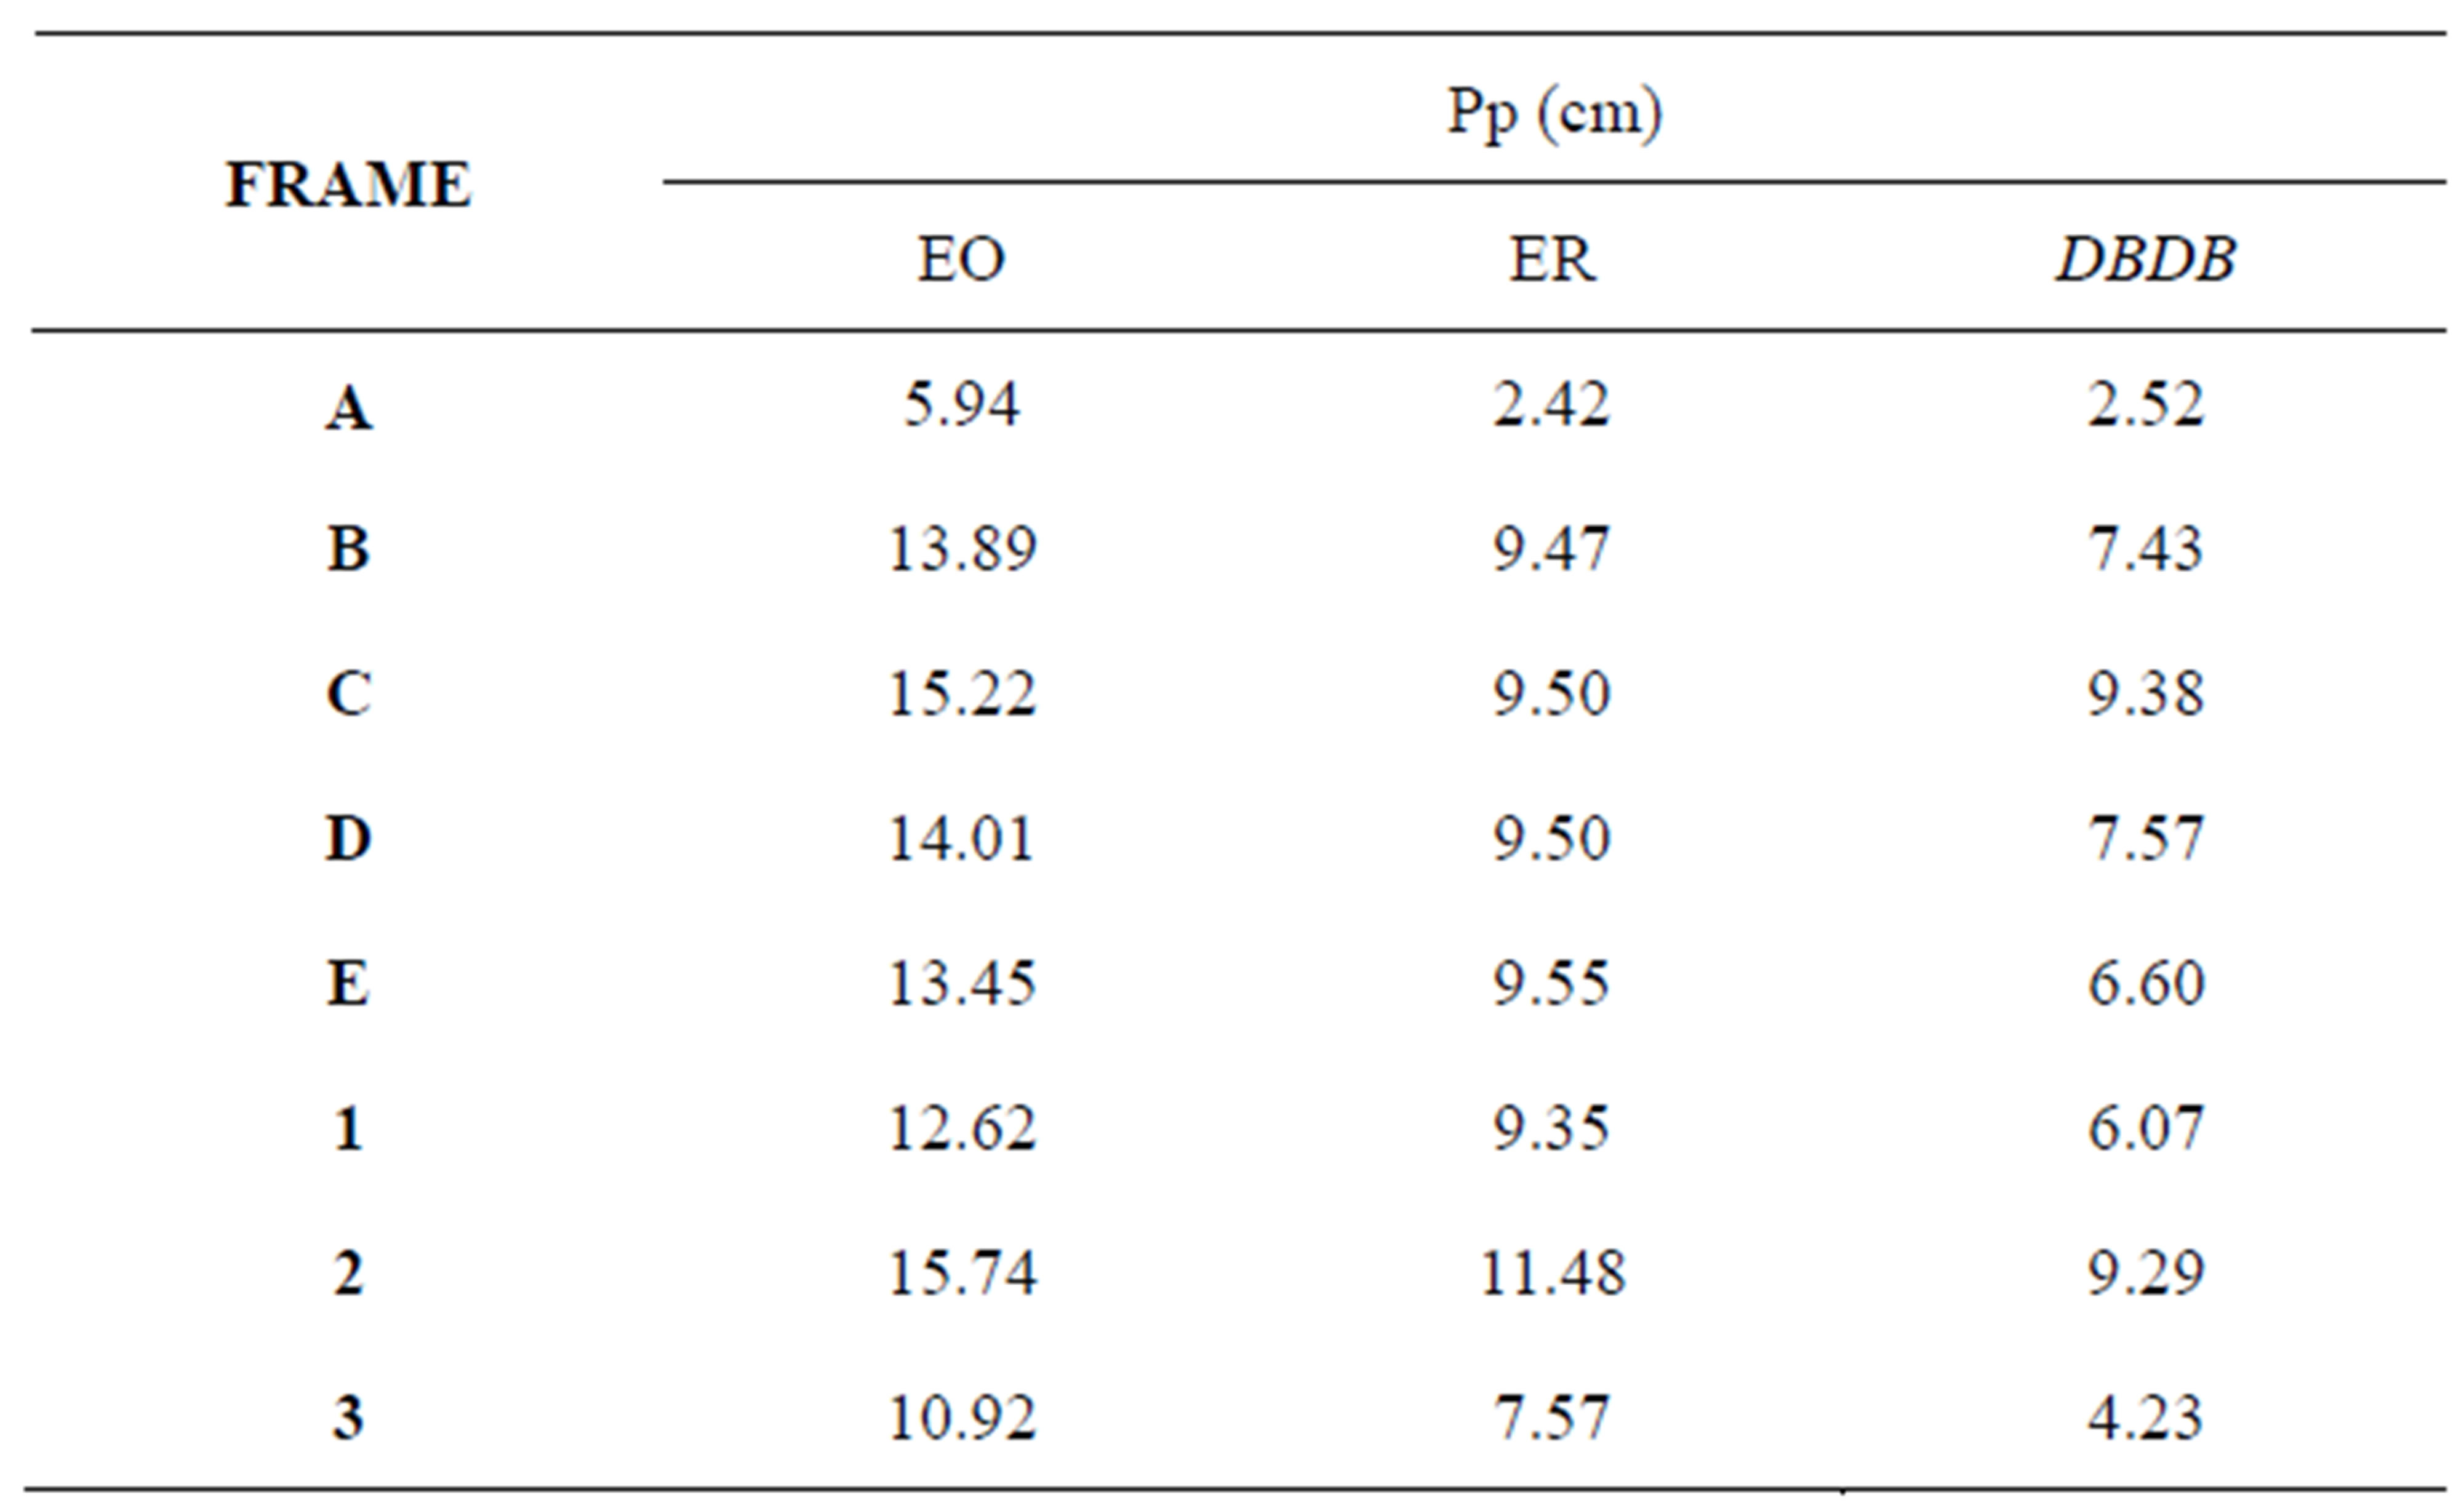
Table 5. Performance points (Pp) of studied buildings frames.
global (∆/H) drifts ex-pressed as a percentage respect to time(s) of the frame C from OB, RB and DBDB models for a seismic threat of 0.3 g.
Figures 8-10 show the results for interstory drifts of frame C from OB, RB and DBDB buildings, taking into account the R1_3 earthquake with duration of 60 seconds. Similarly, interstory drifts for applied earthquakes, R1, R2 and R3 with its three intensities, were obtained. It was verified for each Limit State considered in this study. Table 6 reflects the result of interstory drifts of buildings in study for earthquake R1, taking into account the three levels of hazard, 0.5%, 1.5% and 3%, for the Limits

Figure 4. Performance point of Frame C. OB Building, determined by N2 procedure.
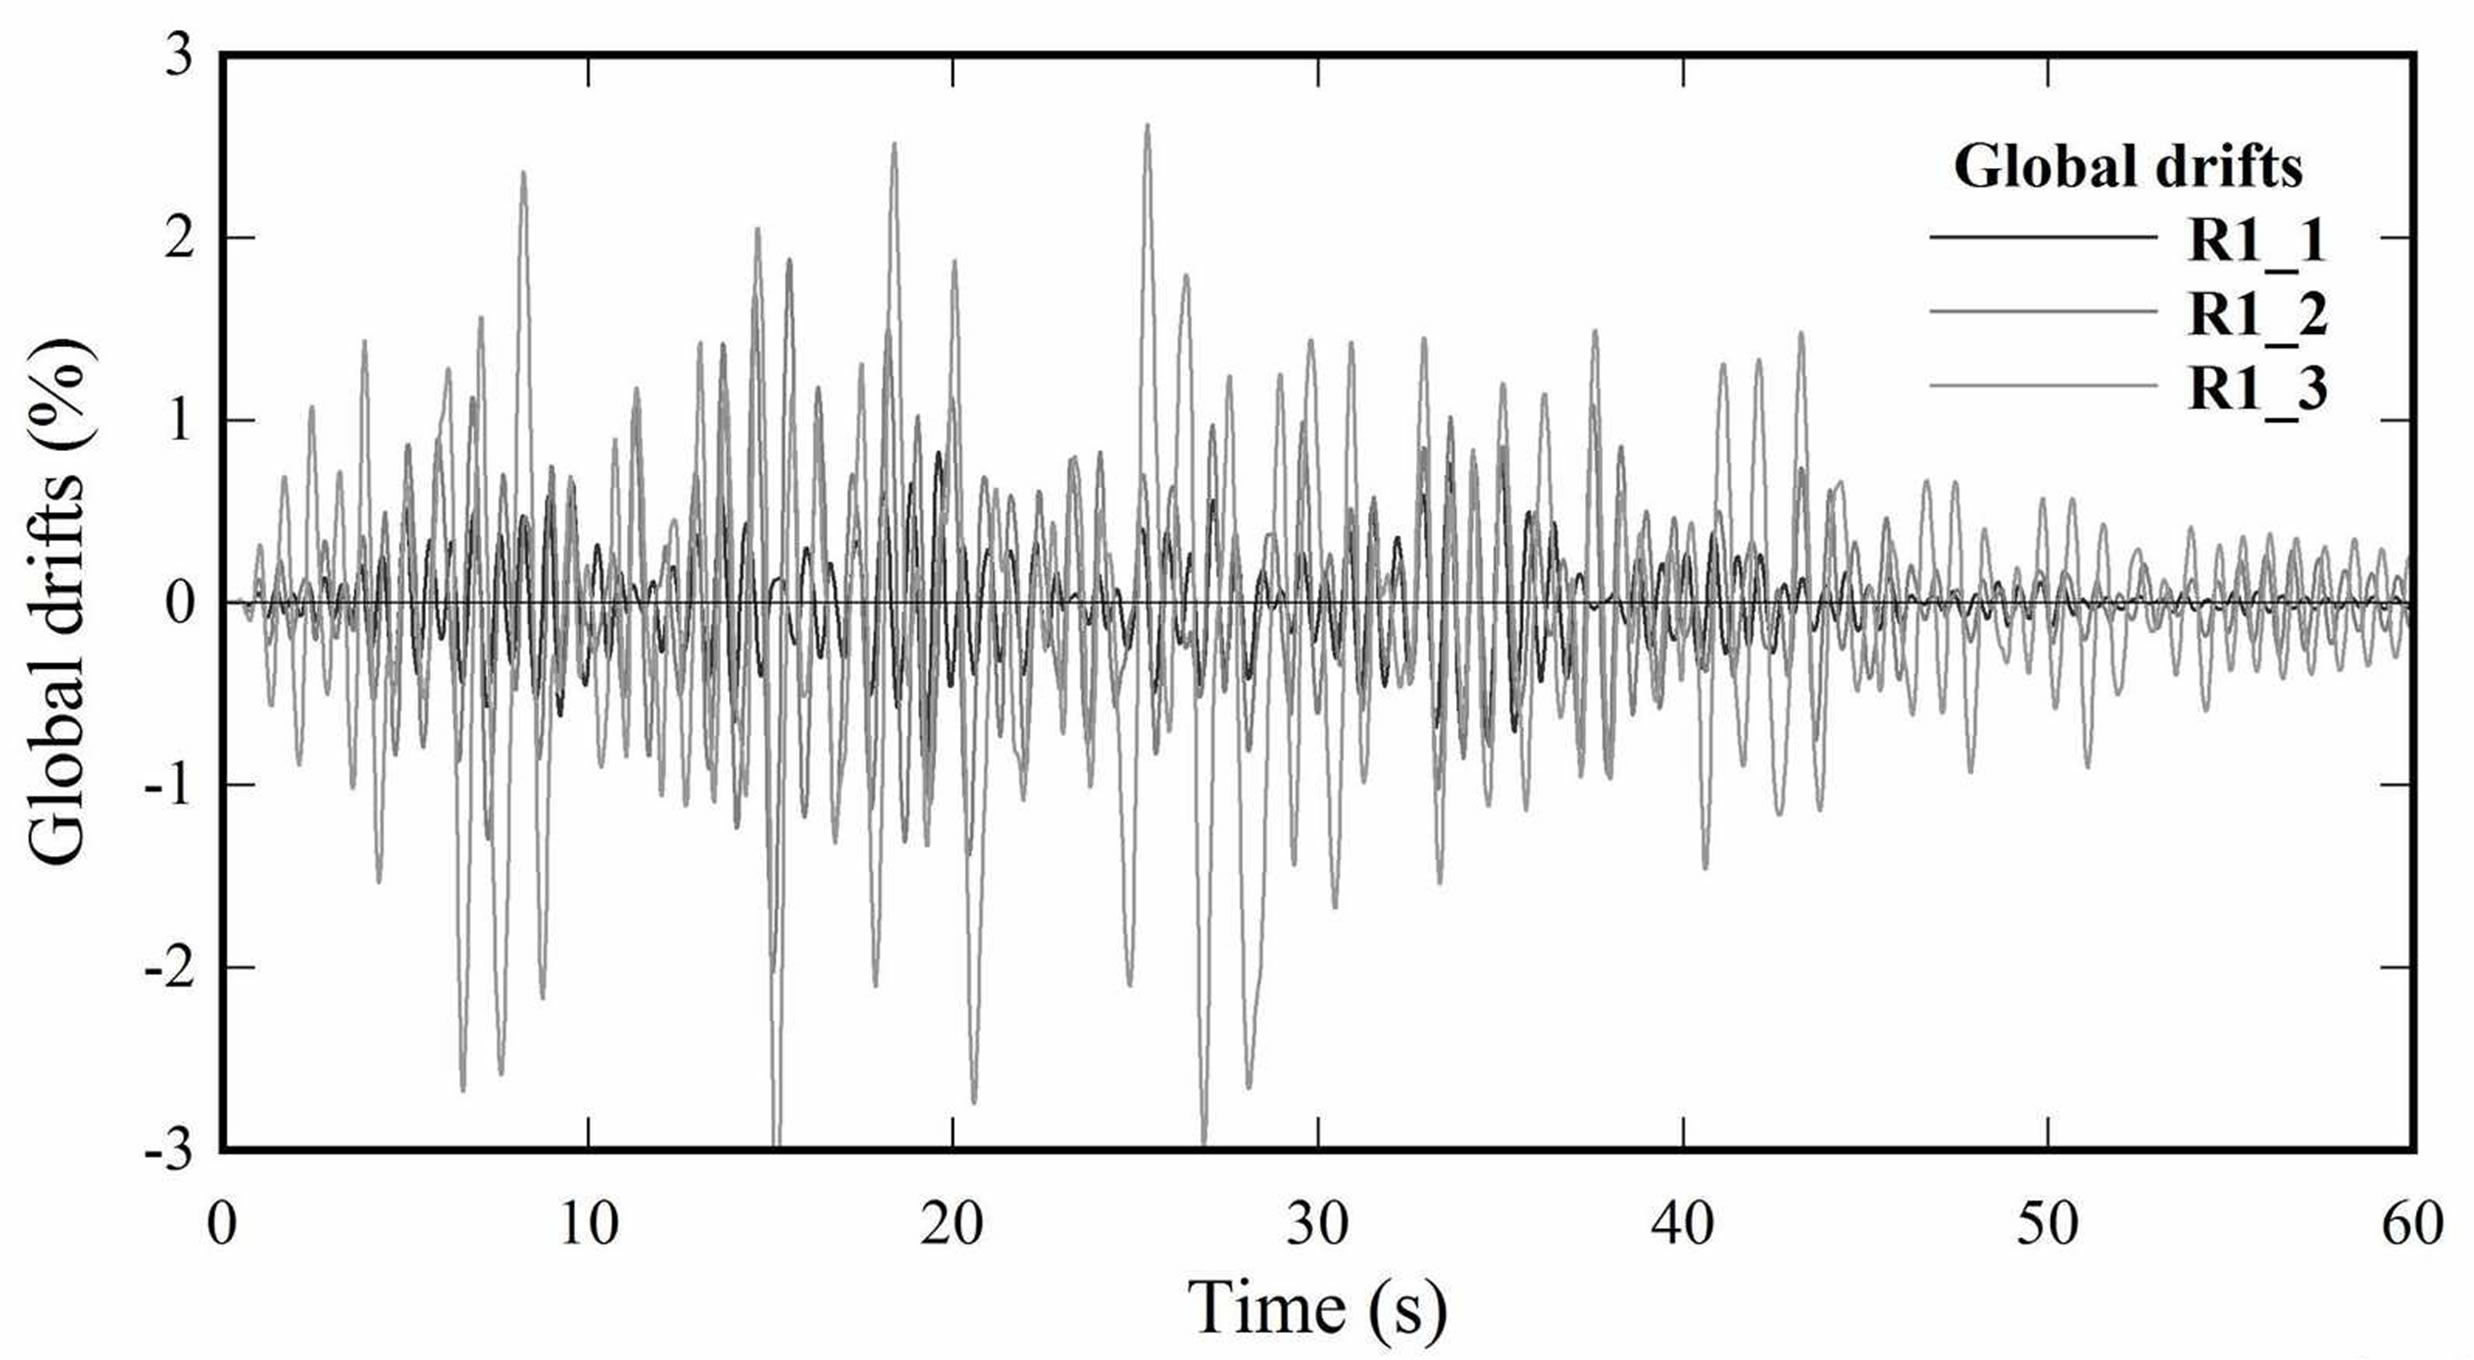
Figure 5. Global drifts. R1 earthquake. Frame C. OB building.
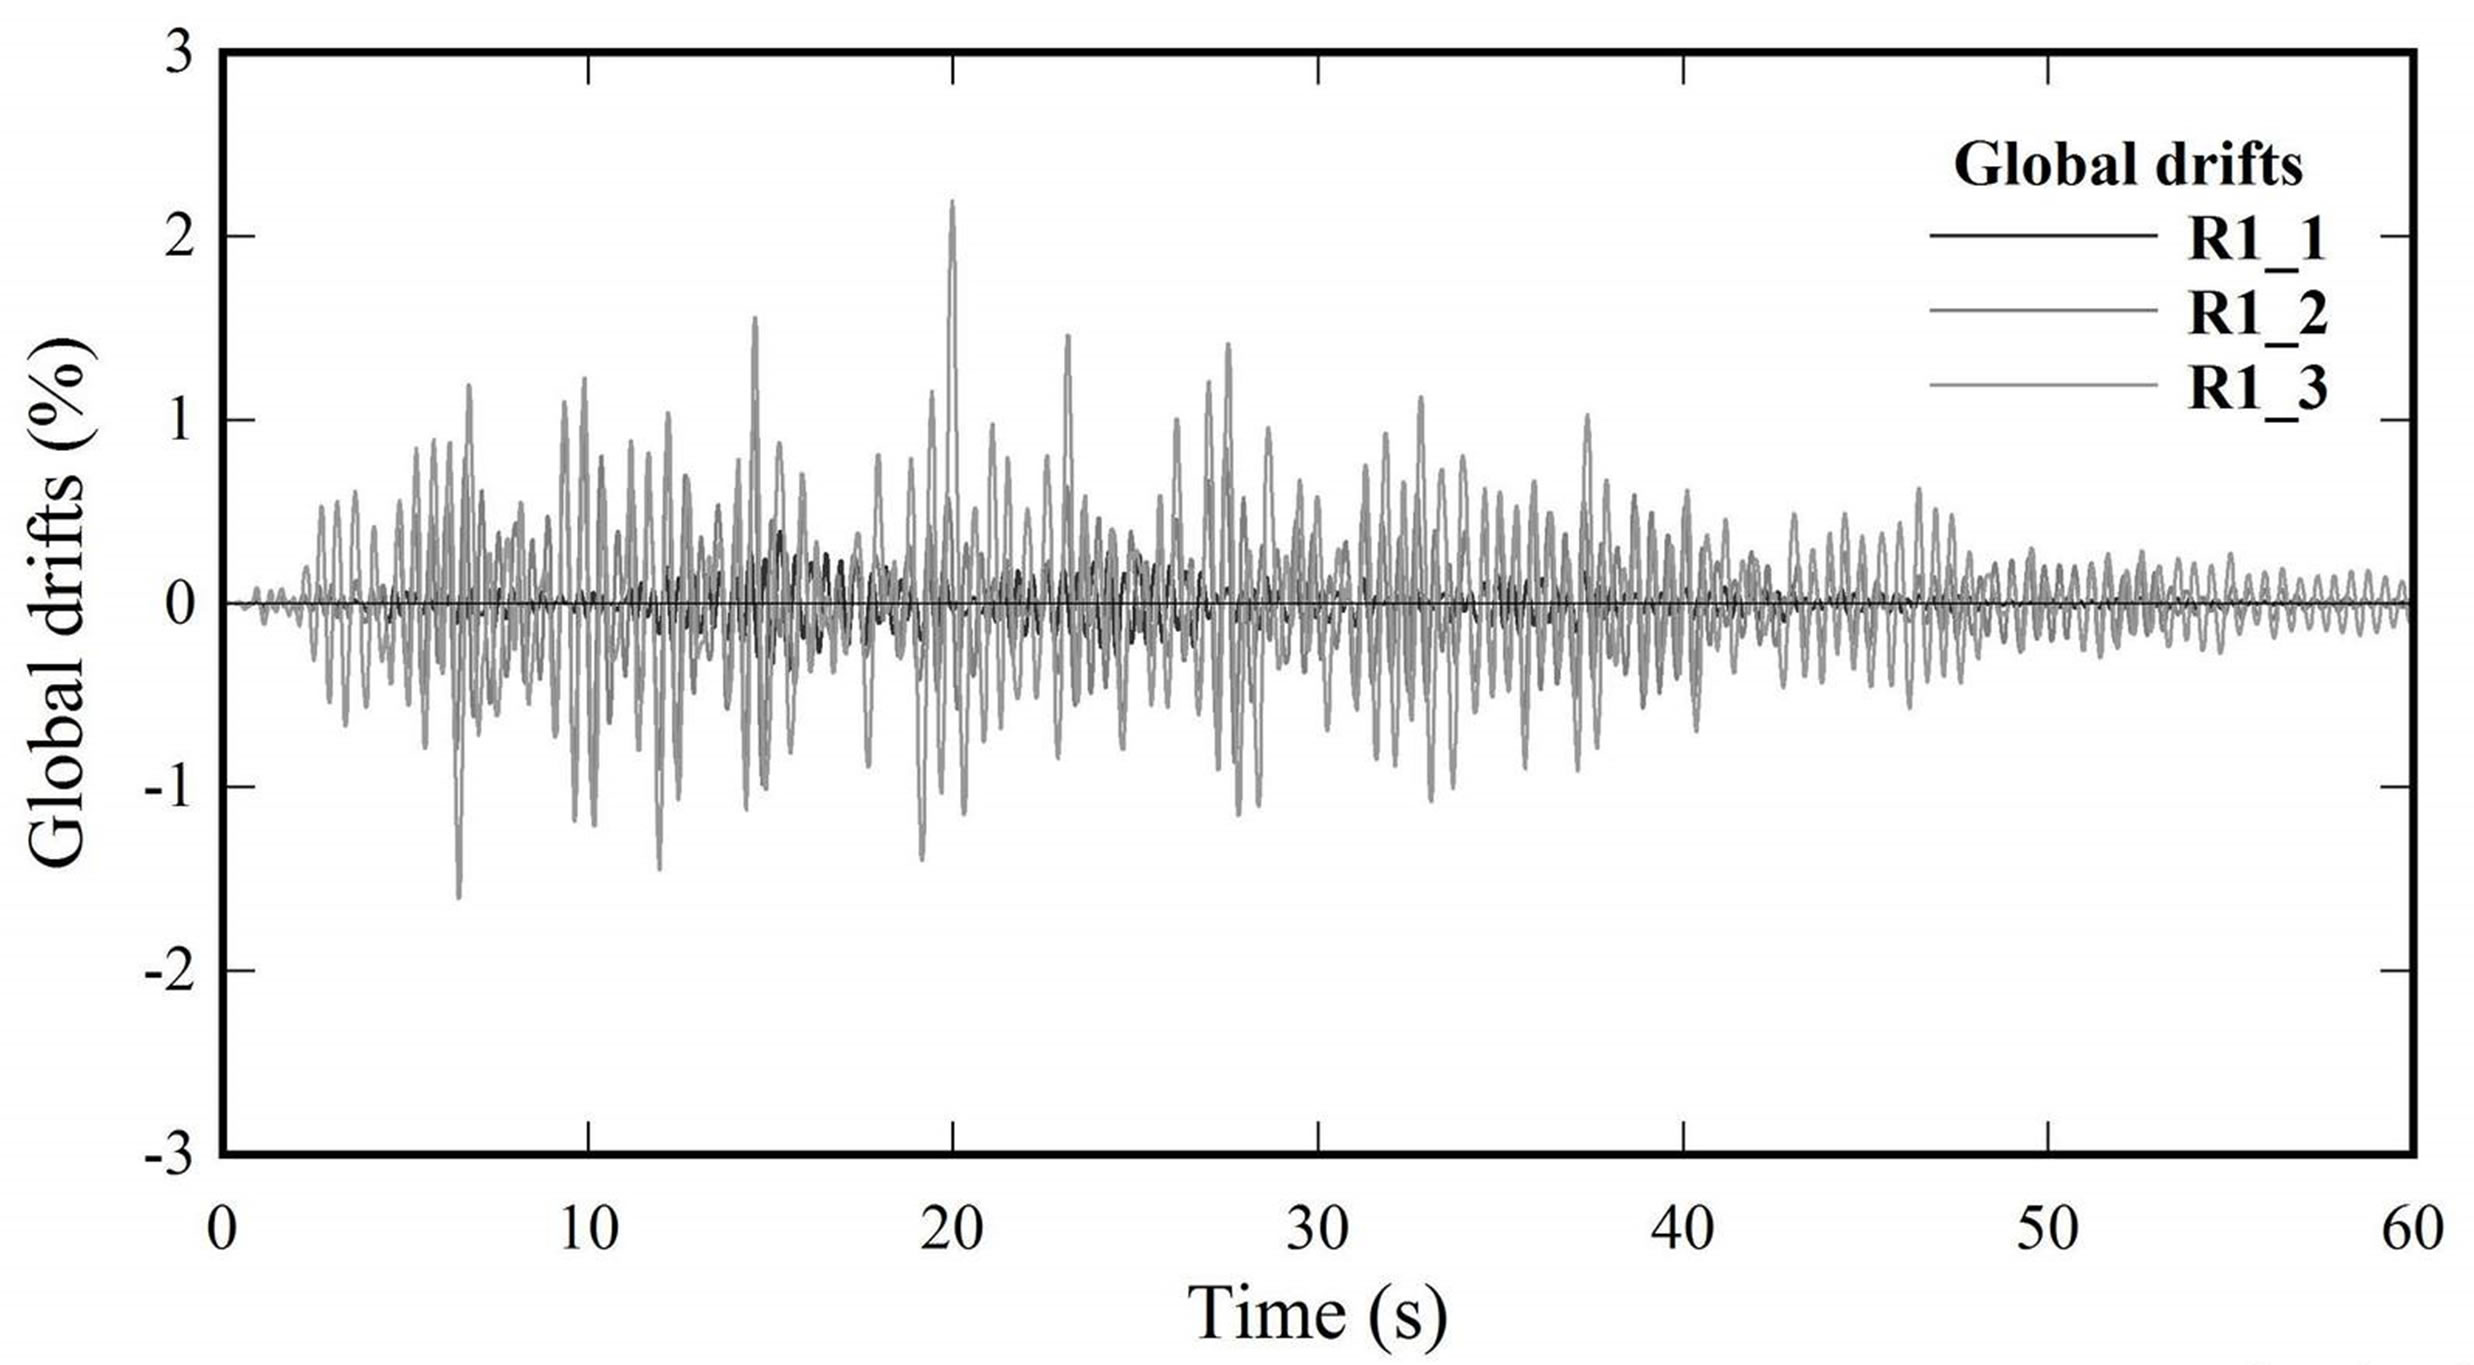
Figure 6. Global drifts. R1 earthquake. Frame C. RB building.
States considered.
3.3. 3D Nonlinear Dynamic Analysis
Interstory drifts in frames of RB, were obtained by applying the R1_3 earthquake for the combinations 1 and 2
(Table 7). Figures 11 and 12 show the drifts of frame C. The remaining frames have shown a similar behavior.
According to results obtained, interstory drifts in 2D and 3D modeled buildings differ greatly from each other. In the 2D model greaters drifts were obtained. Figures 9 and 11 show interstory drifts of frame C of RB building
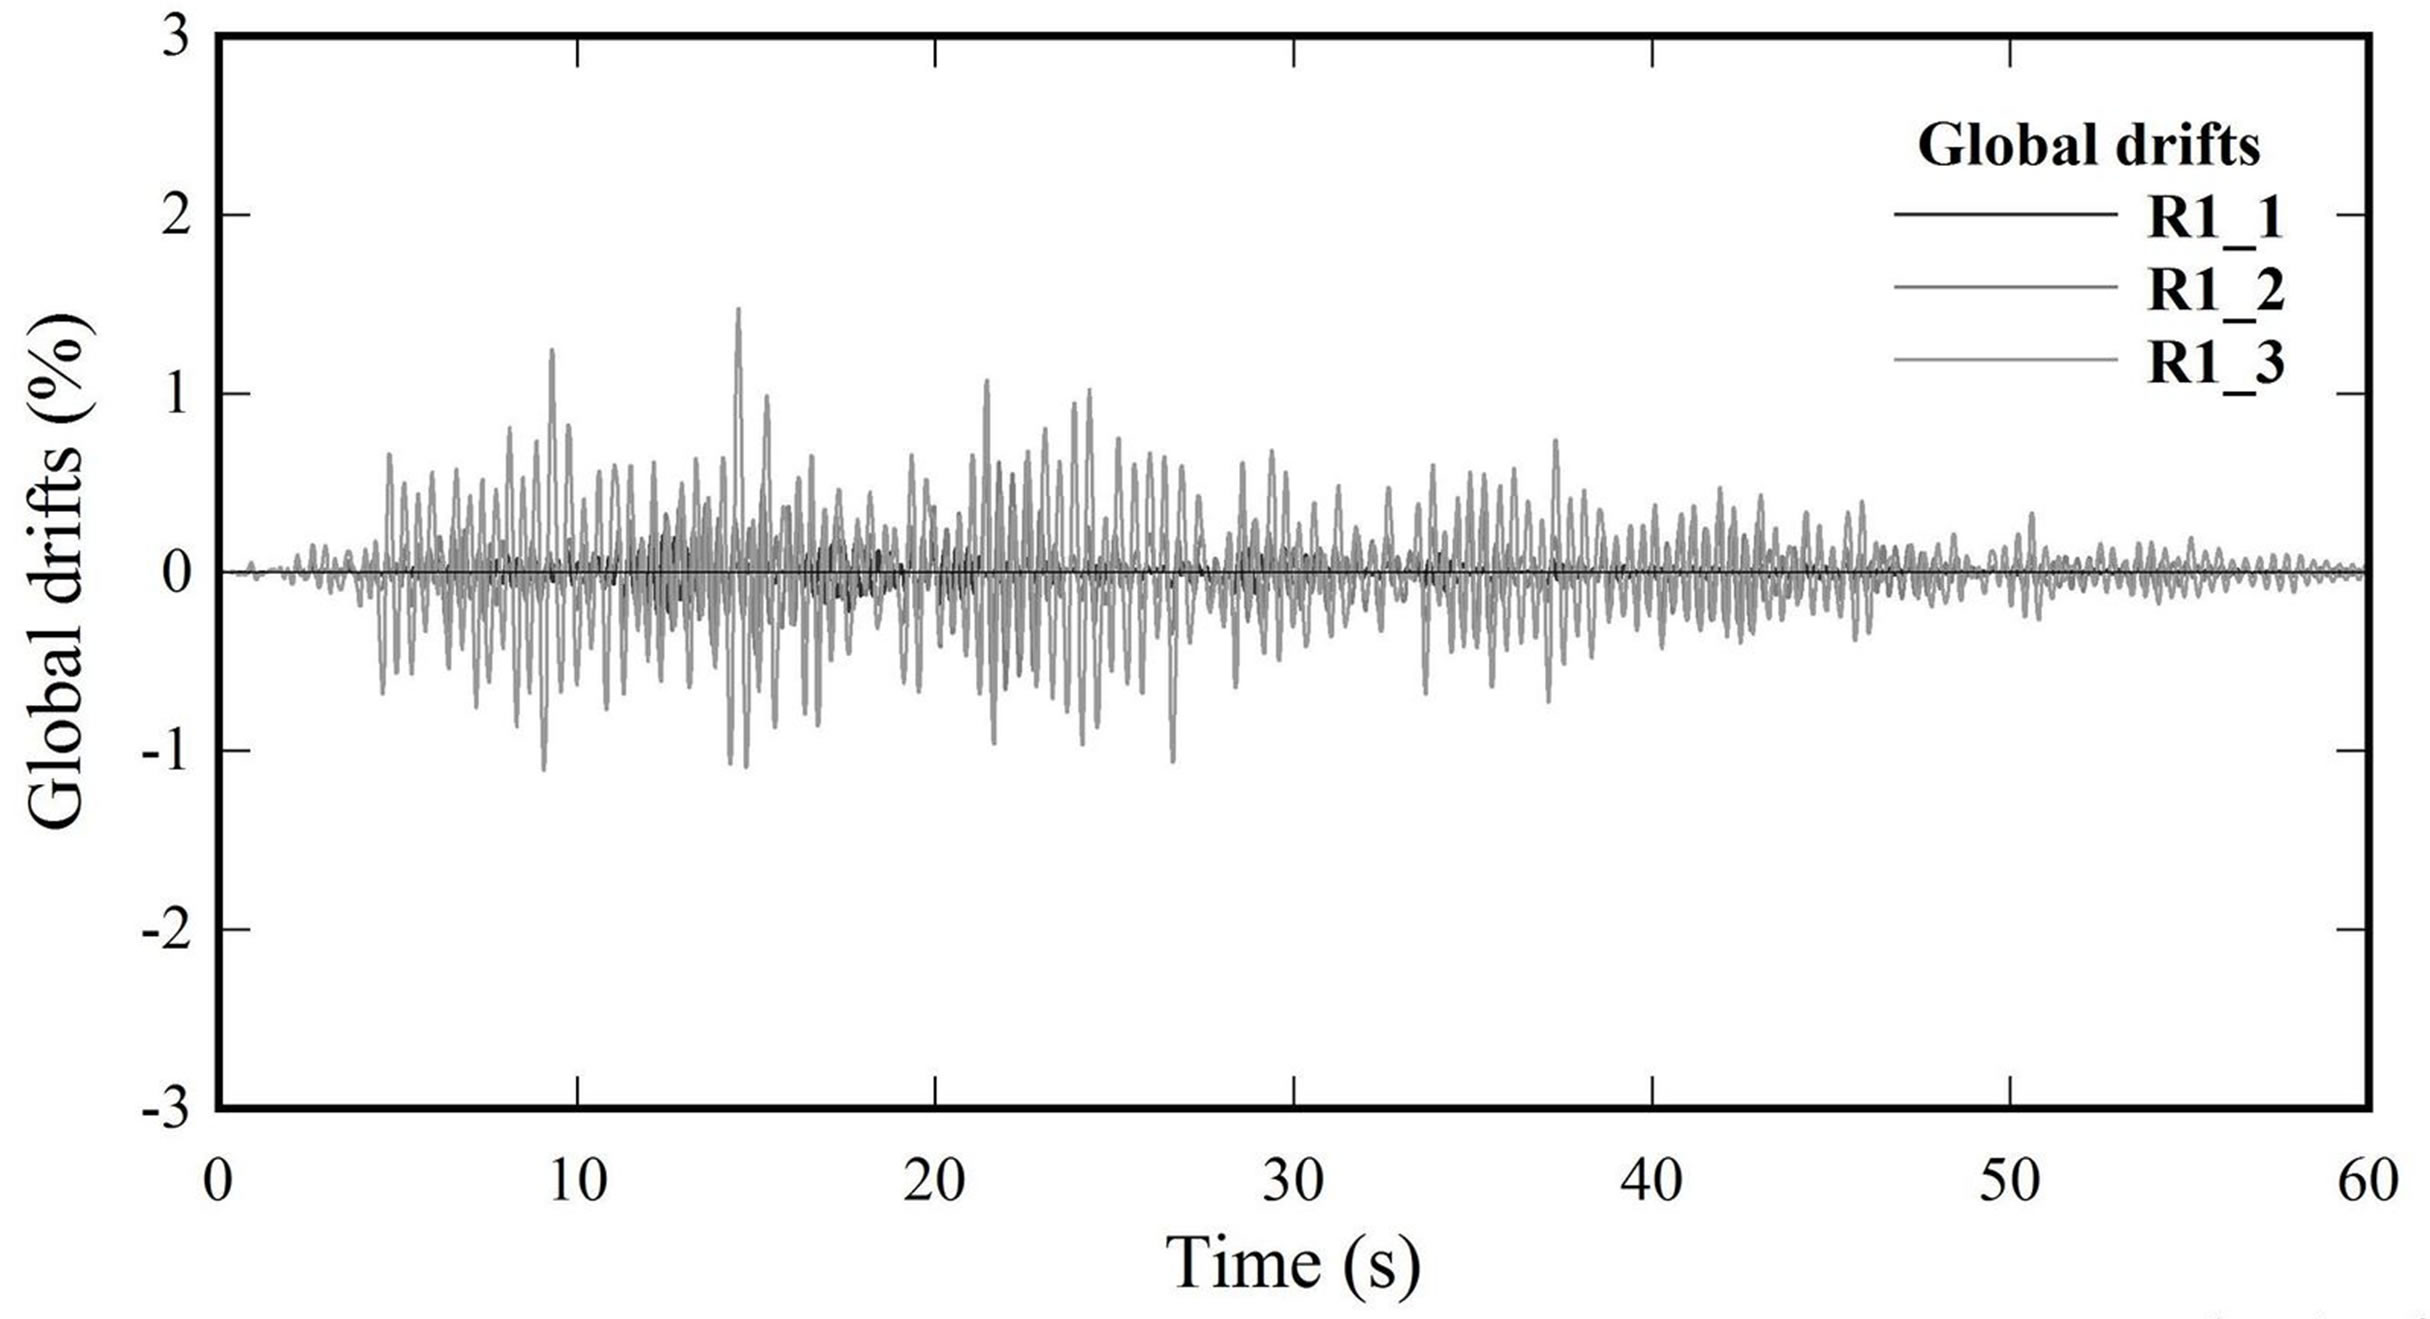
Figure 7. Global drifts. R1 earthquake. Frame C. DBDB building.

Figure 8. Interstory drifts. R1_3 earthquake. Frame C. OB building.

Figure 9. Interstory drifts. R1_3 earthquake. Frame C. RB building.
for earthquake R1_3 and combination 1 (Figure 9 is in 2D representation and Figure 11 is in 3D representation). Also it was determined the maximum torsional moments in each column before the implementation of R1_3 earthquake in all supports for the four combinations described in Table 7. In Figure 13 have been plotting torsional moments in function of time for the four combinations, where nodes appointed by n111 until the n513 are corresponding to supports, while Figure 14 shows the maximum torsional moment for each column of the three-dimensional analysis. The torsional moments for the other seismic combinations used in this study were obtained using the same procedure.
4. CONCLUSIONS
In order to determine or estimate the seismic response
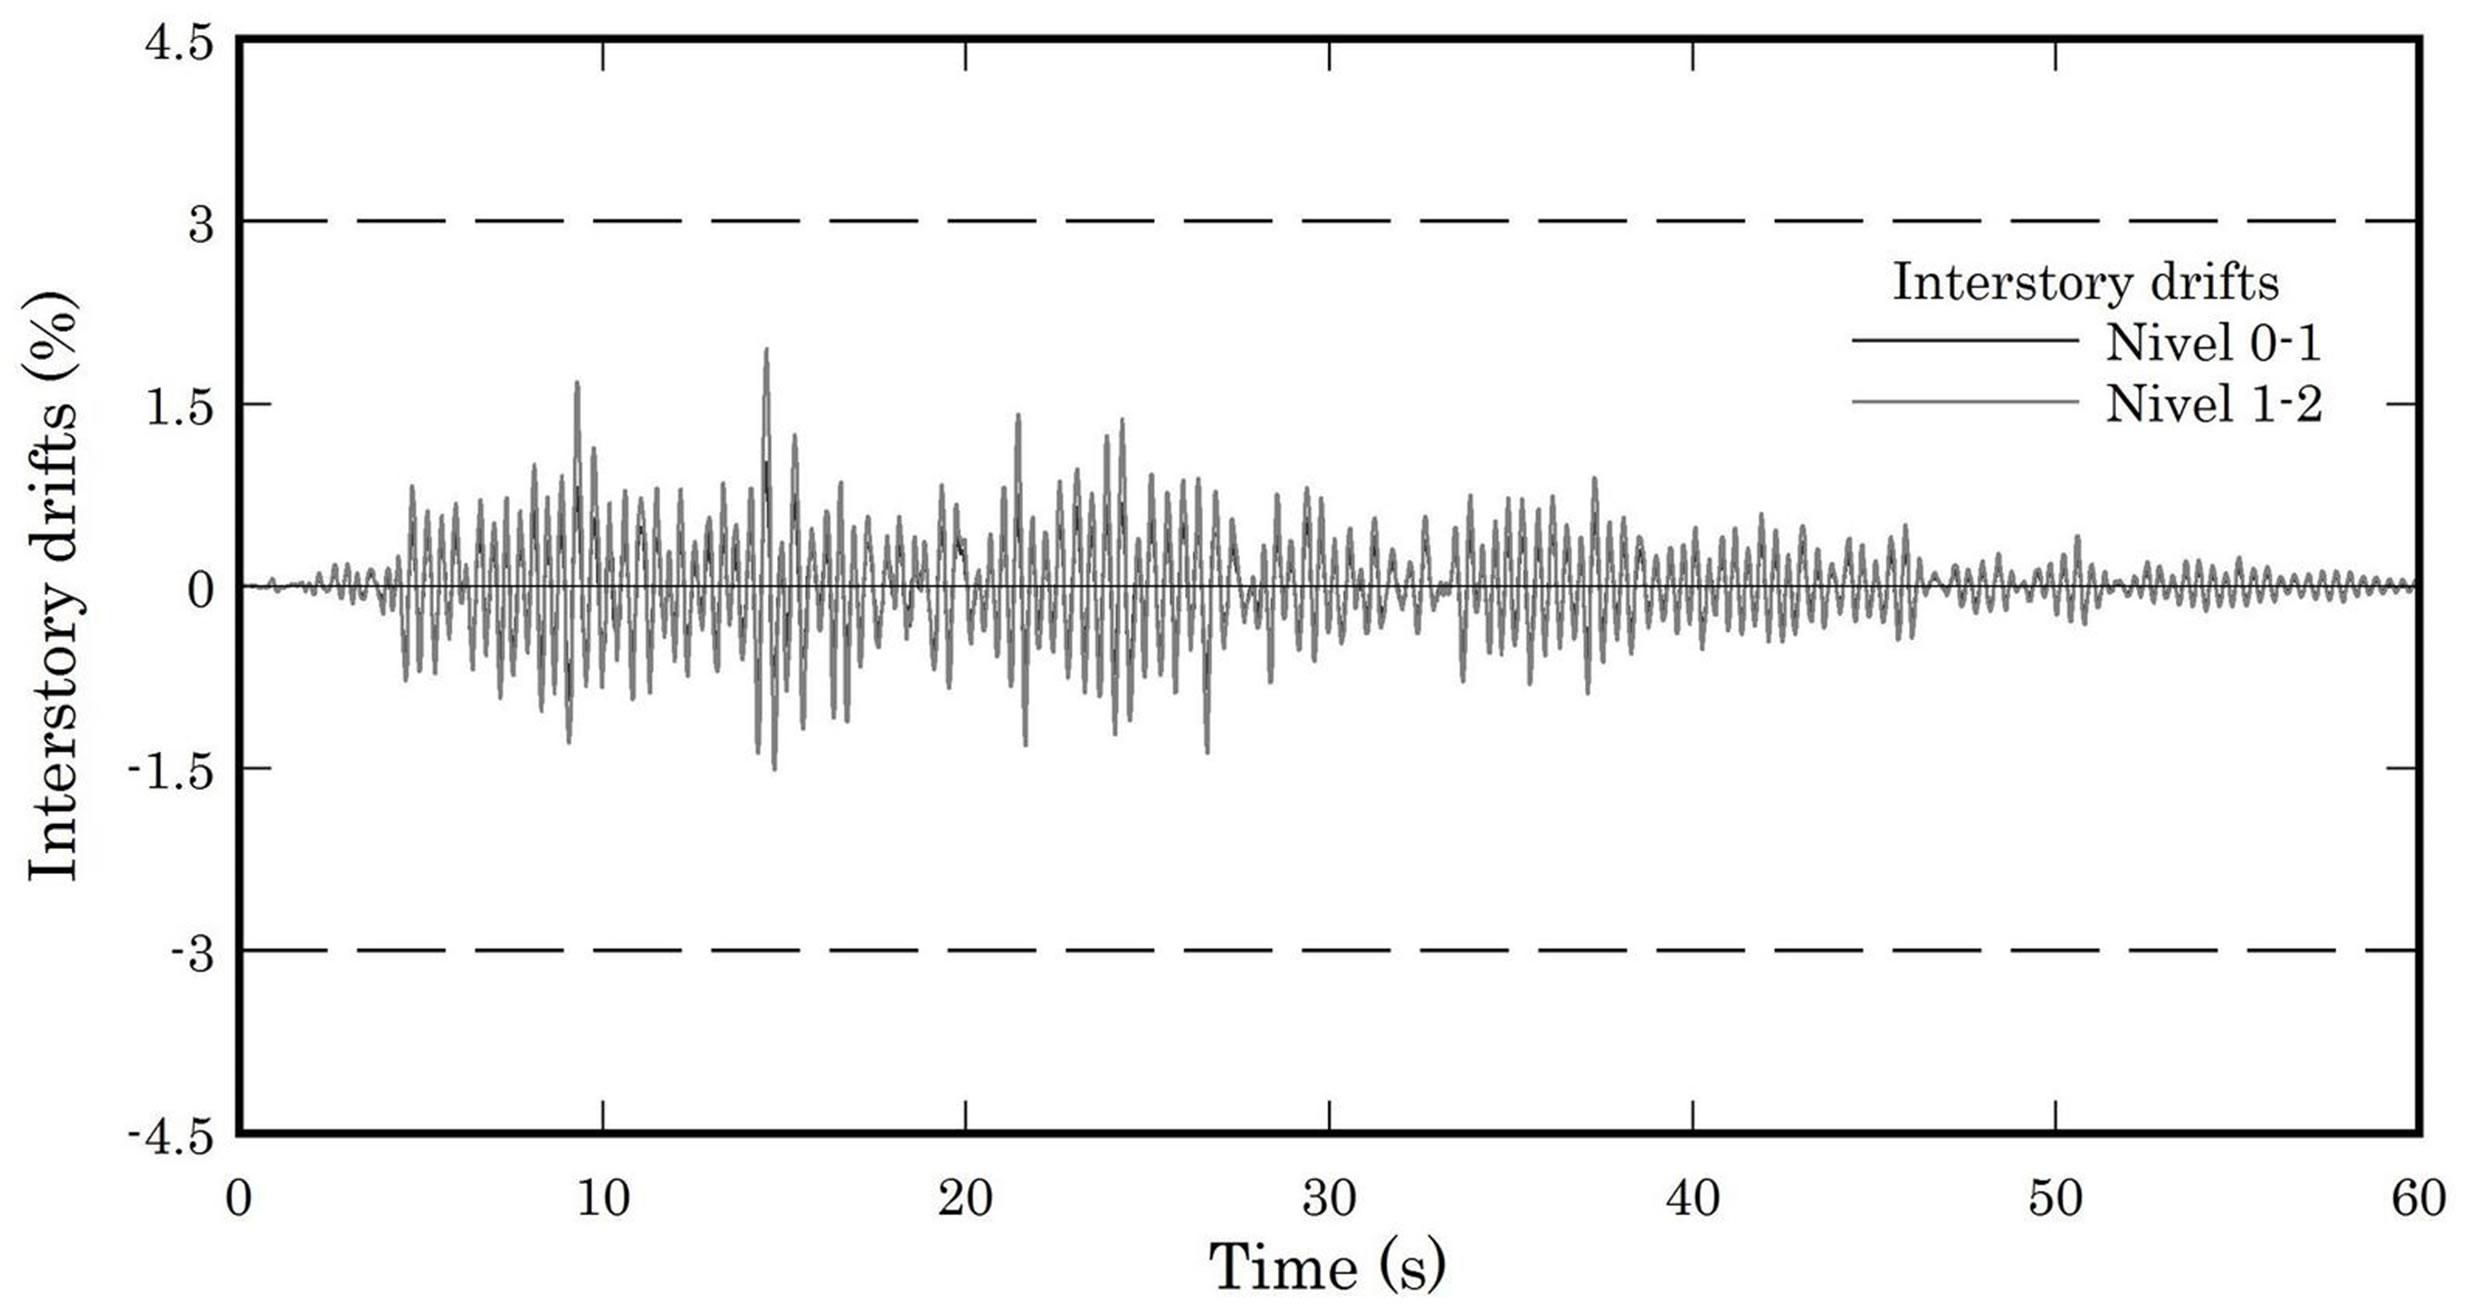
Figure 10. Interstory drifts. R1_3 earthquake. Frame C. DBDB building.
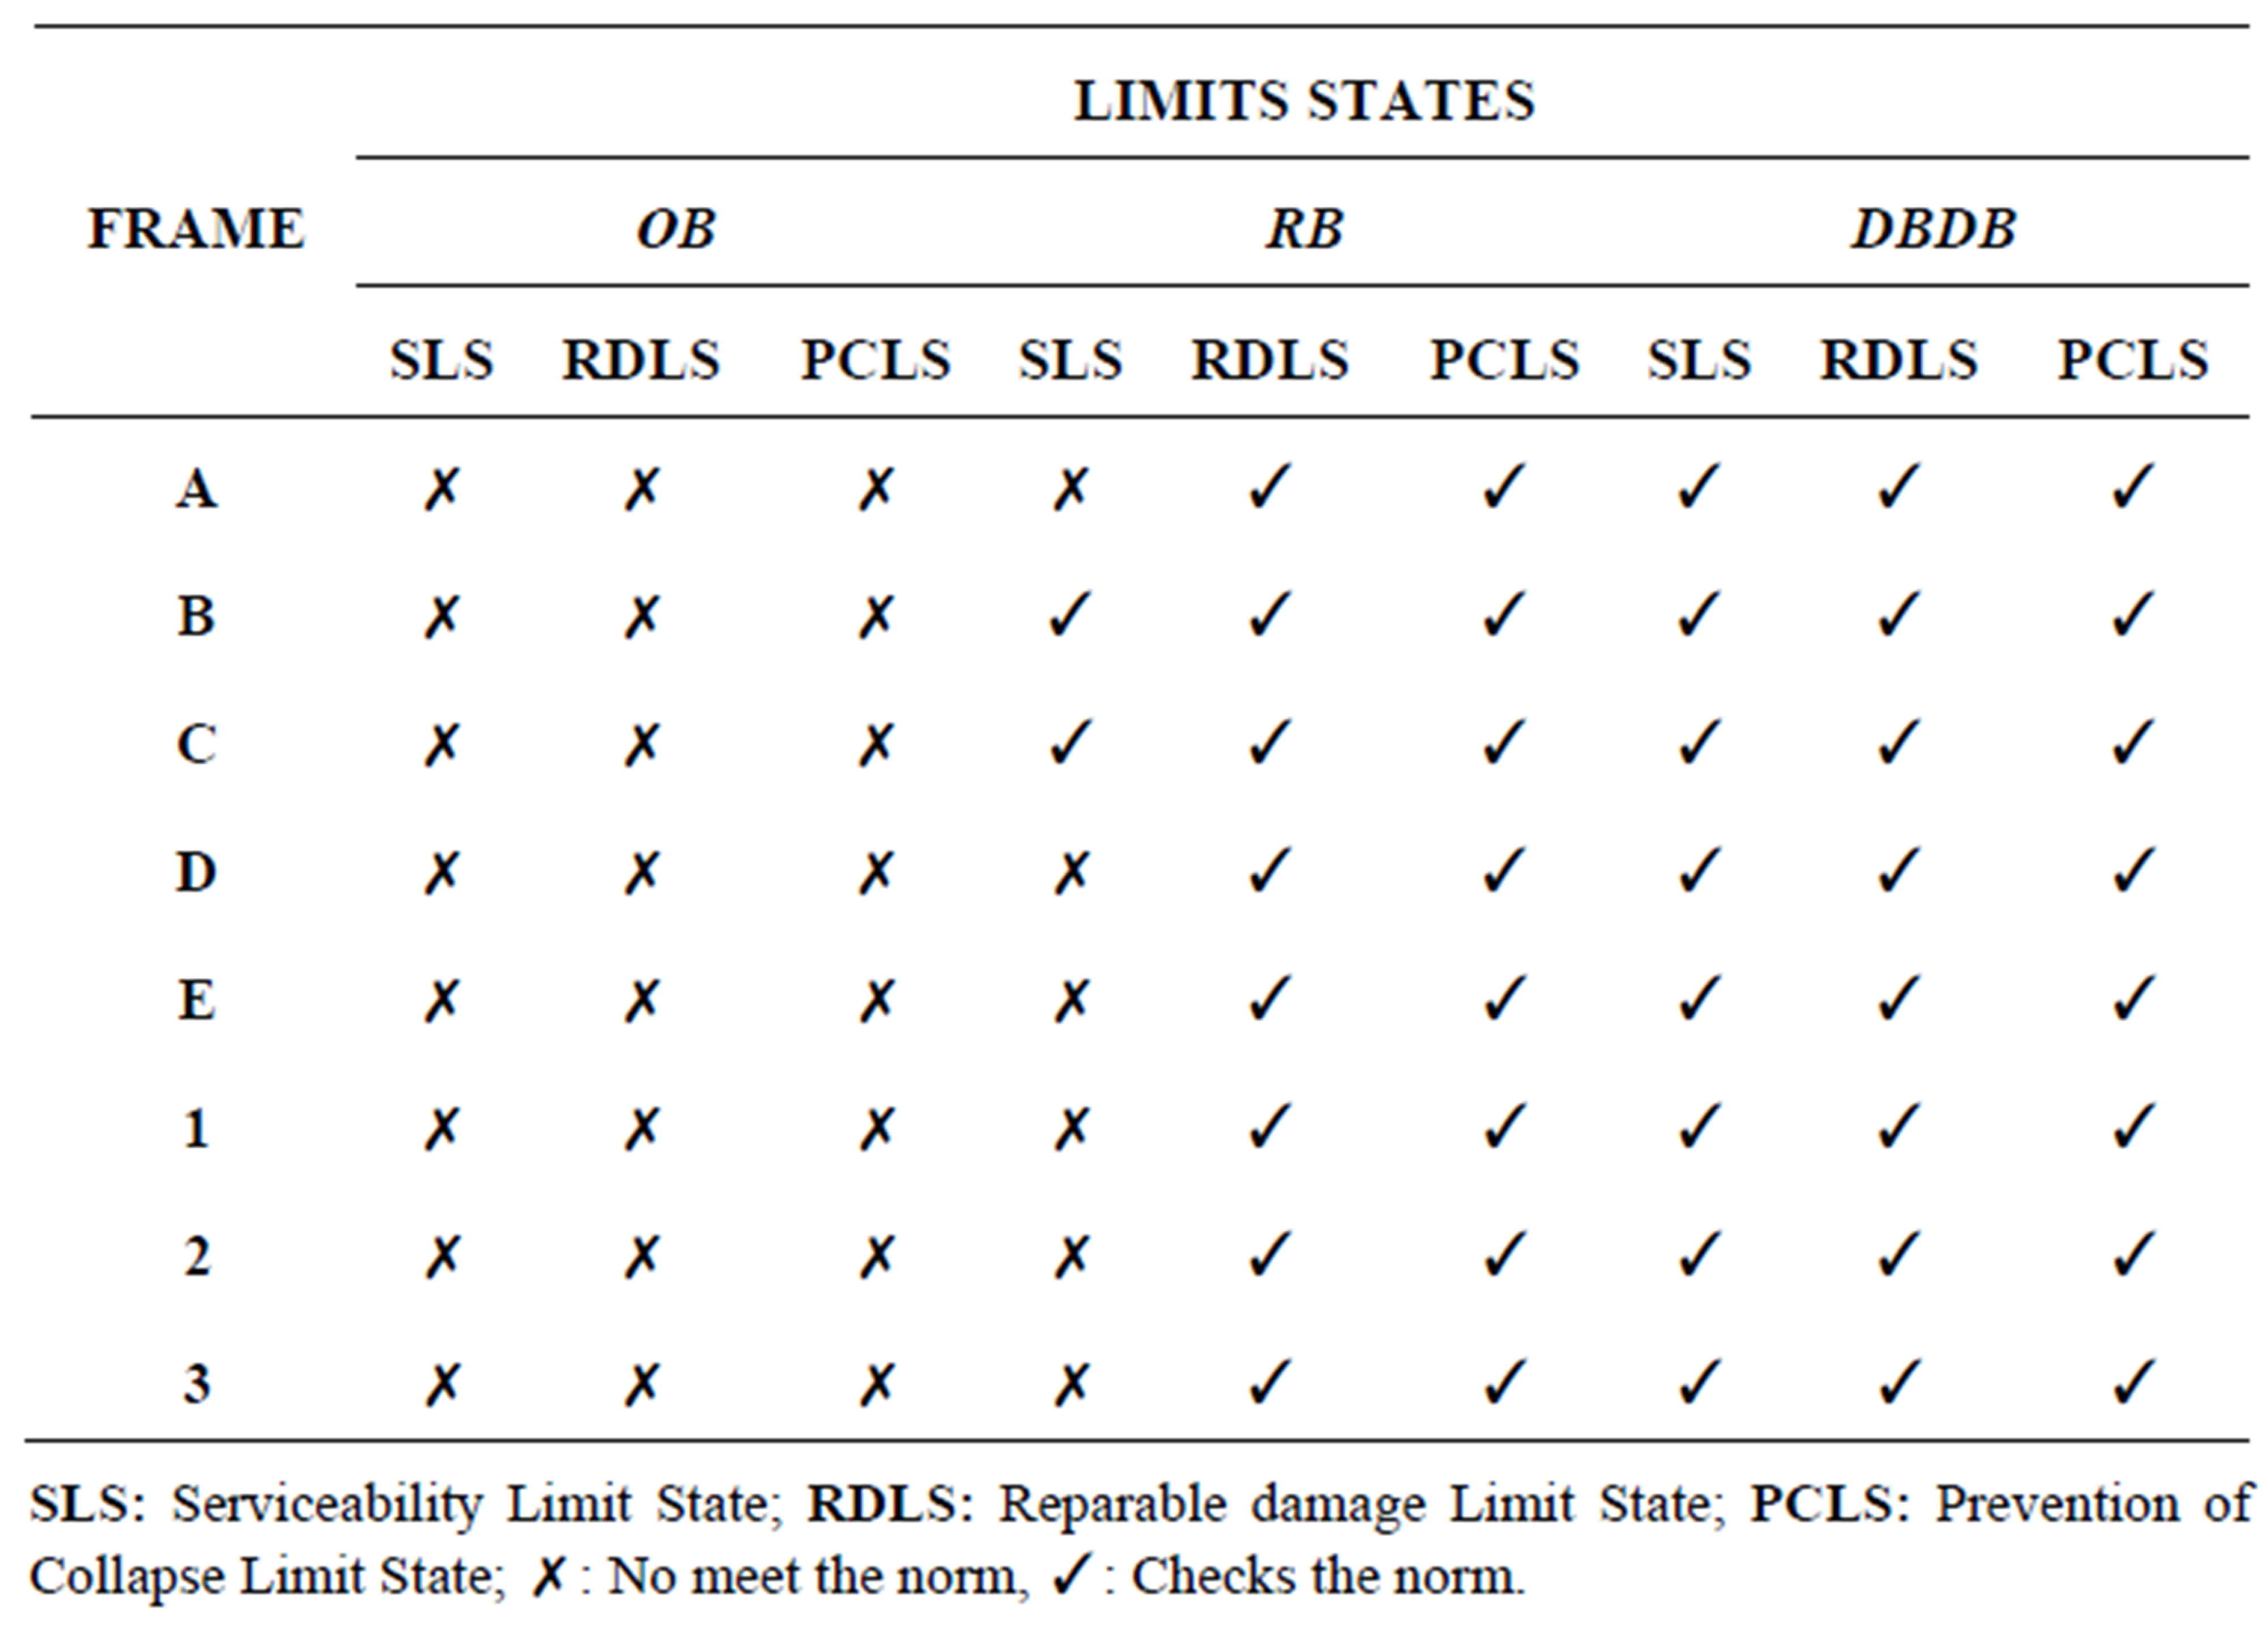
Table 6. Interstory drifts verification. R1 earthquake. OB, RB and DBDB building.
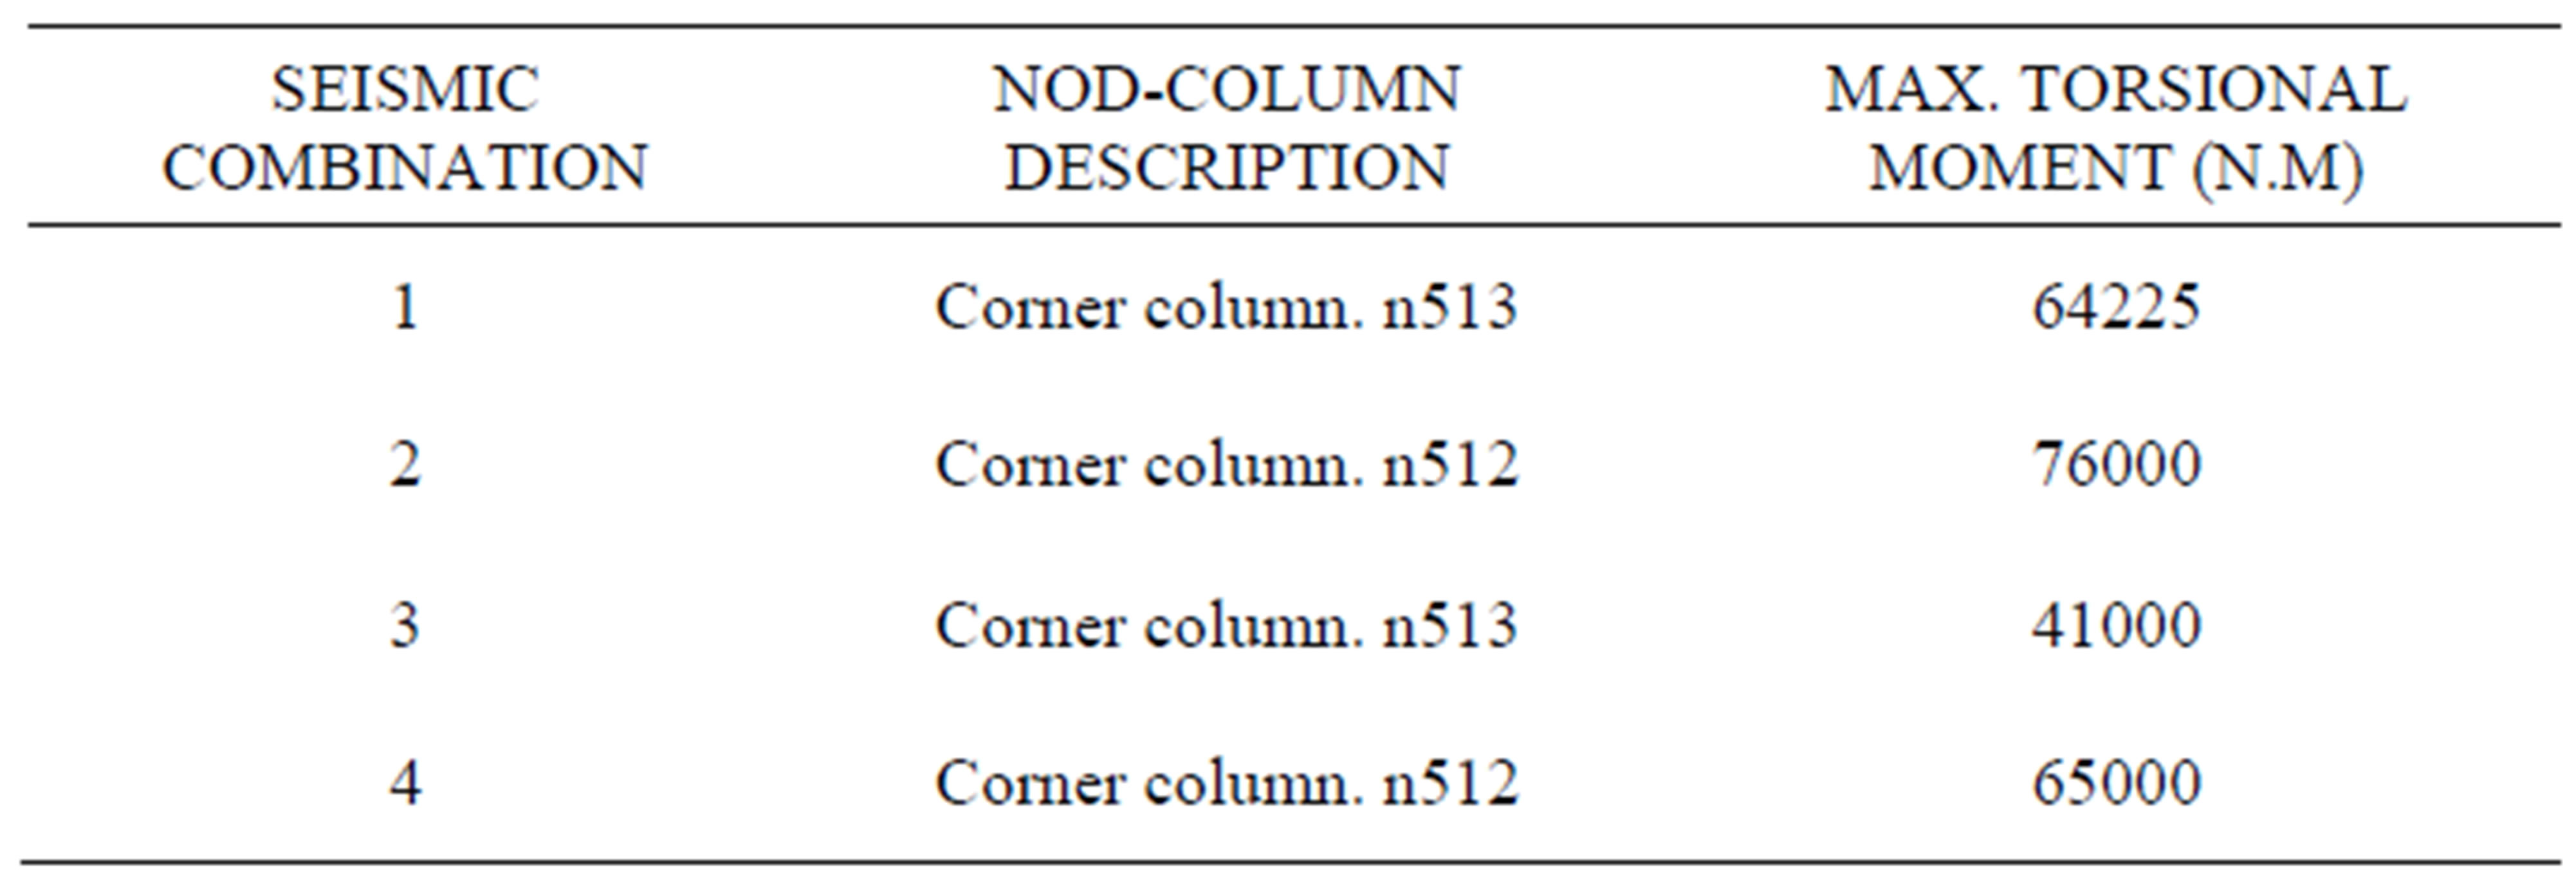
Table 7. Maximum torsional moments for seismic combinations.
of the considered building, analytical methods were considered seismic hazard level and structural regularity basis. The elastic analysis applied to the OB building identified elastic displacements above the maximum value of inter story drift established in Venezuelan seismic code [7]. From the resizing model RB the inter story is seen to satisfy the maximum value established in the code. Thus, the cross-sections of the structural elements of OB are insufficient to properly control the damage caused by seismic forces.
From dynamic analysis obtained global and interstory drifts for all three evaluated models determining the dynamic response of these structures and control-ling the damage level reached in them. With the global drifts the threshold of the collapse Limit State, which corresponds to the maximum value of 2.5%. RB and DBDB buildings
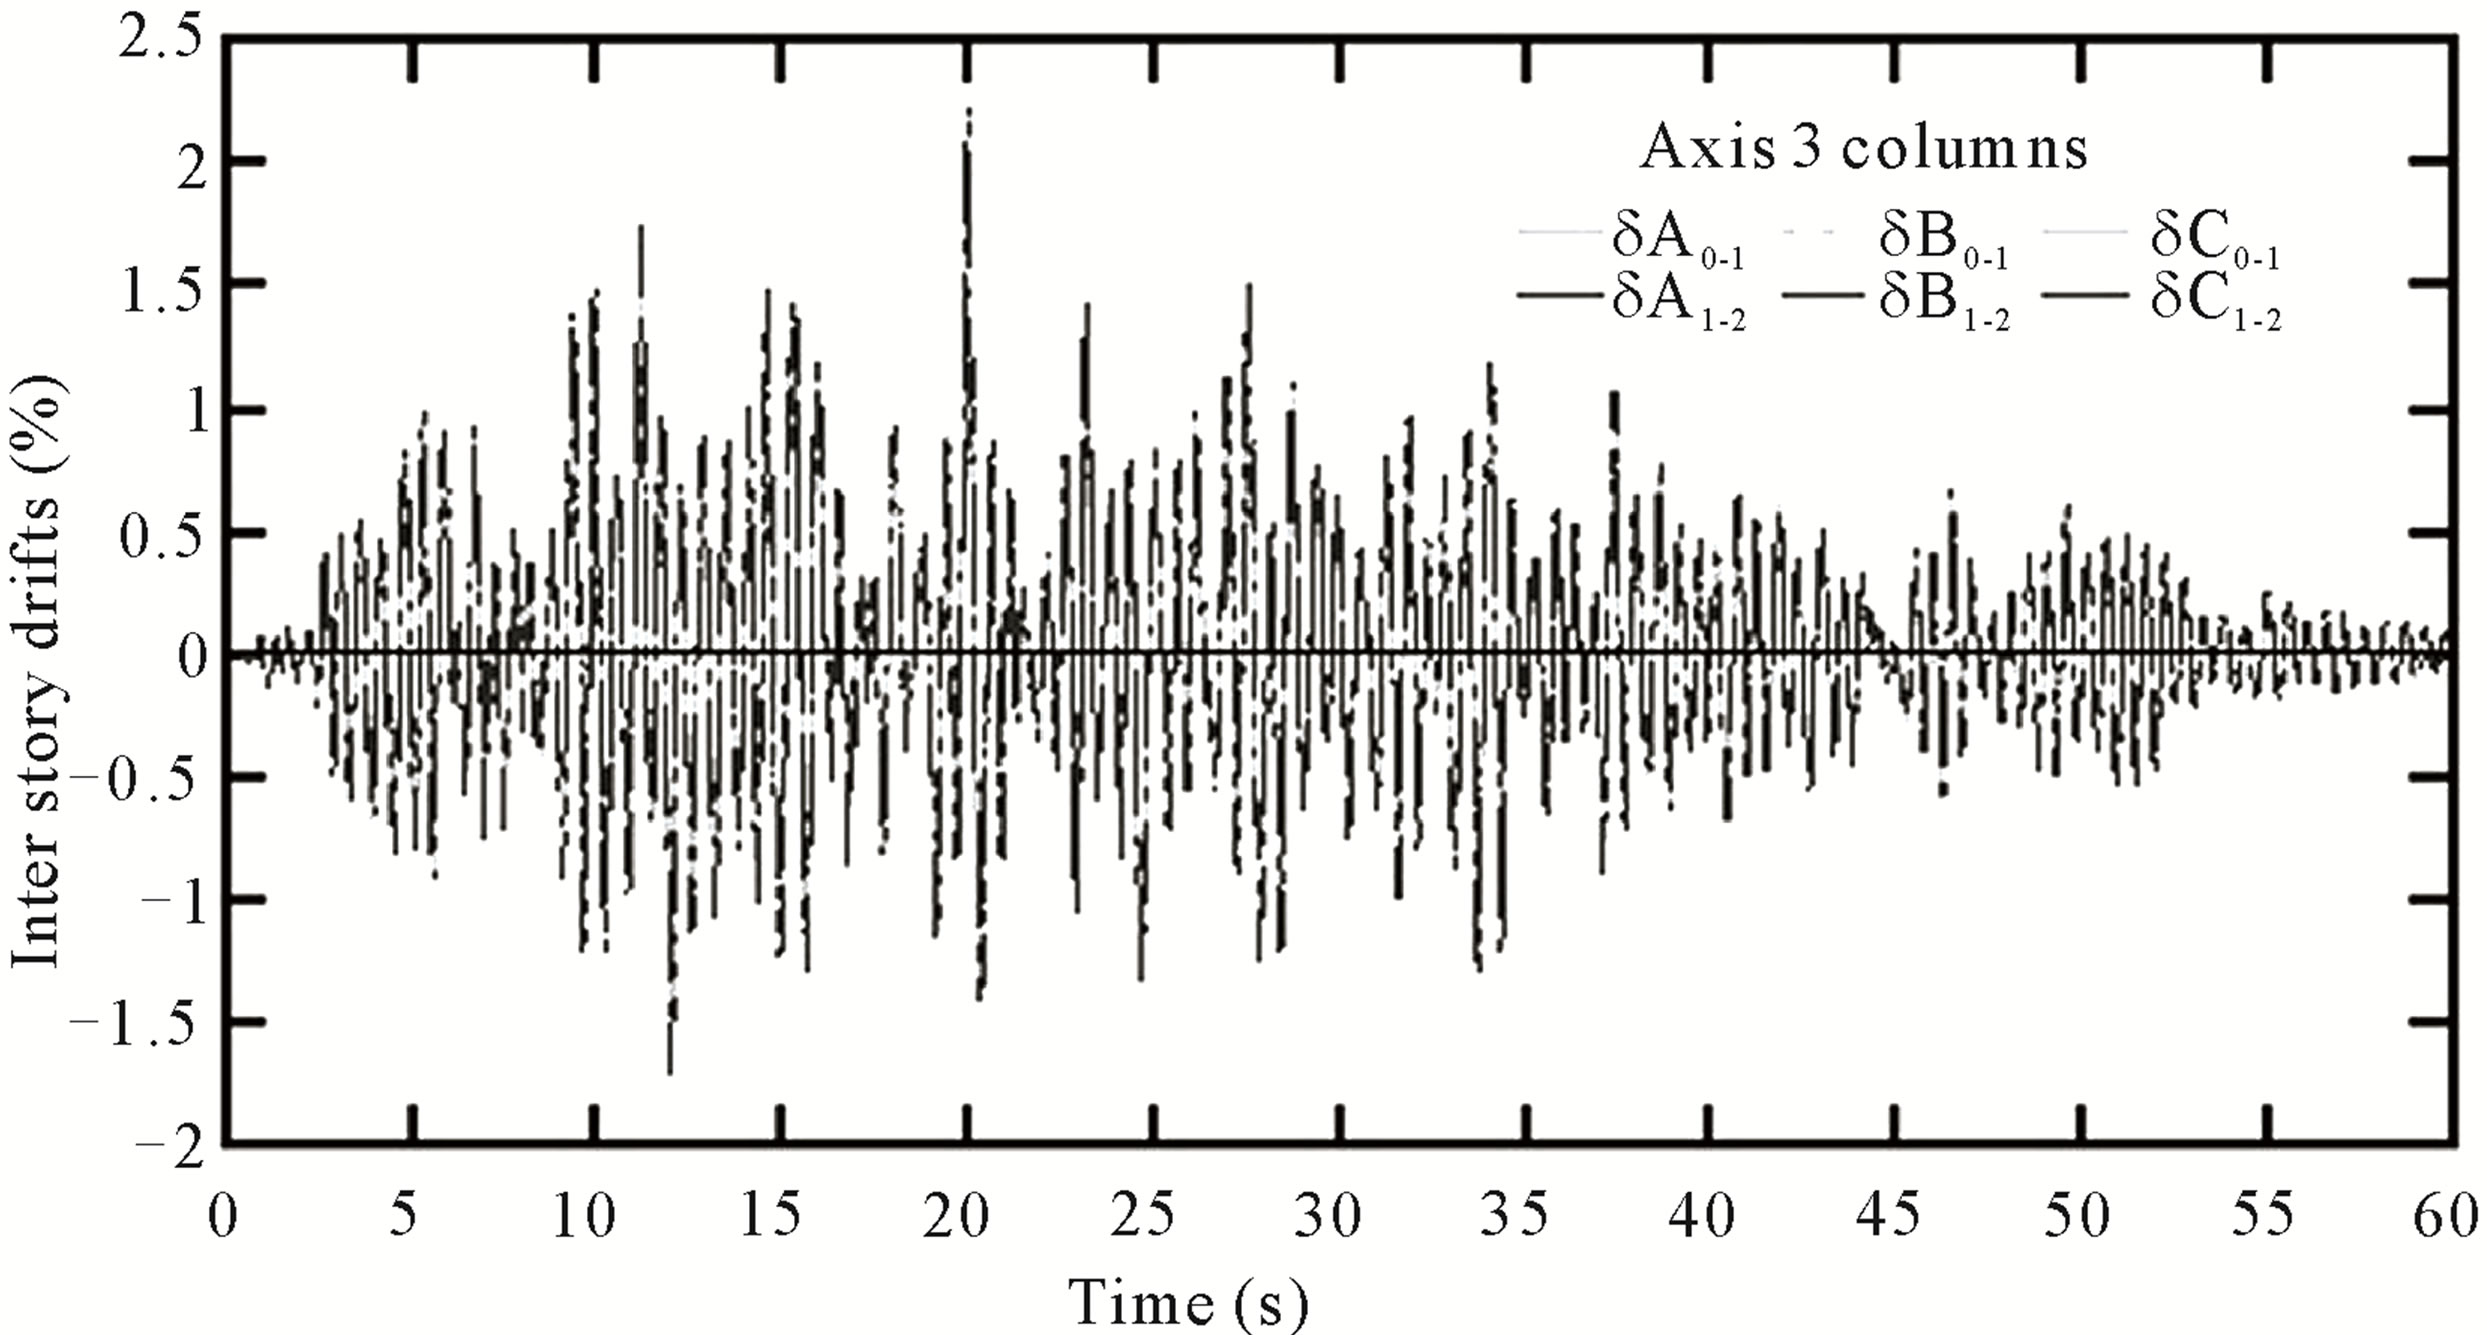
Figure 11. Interstory drifts. Frame C of RB building. Earthquake 100% (X).
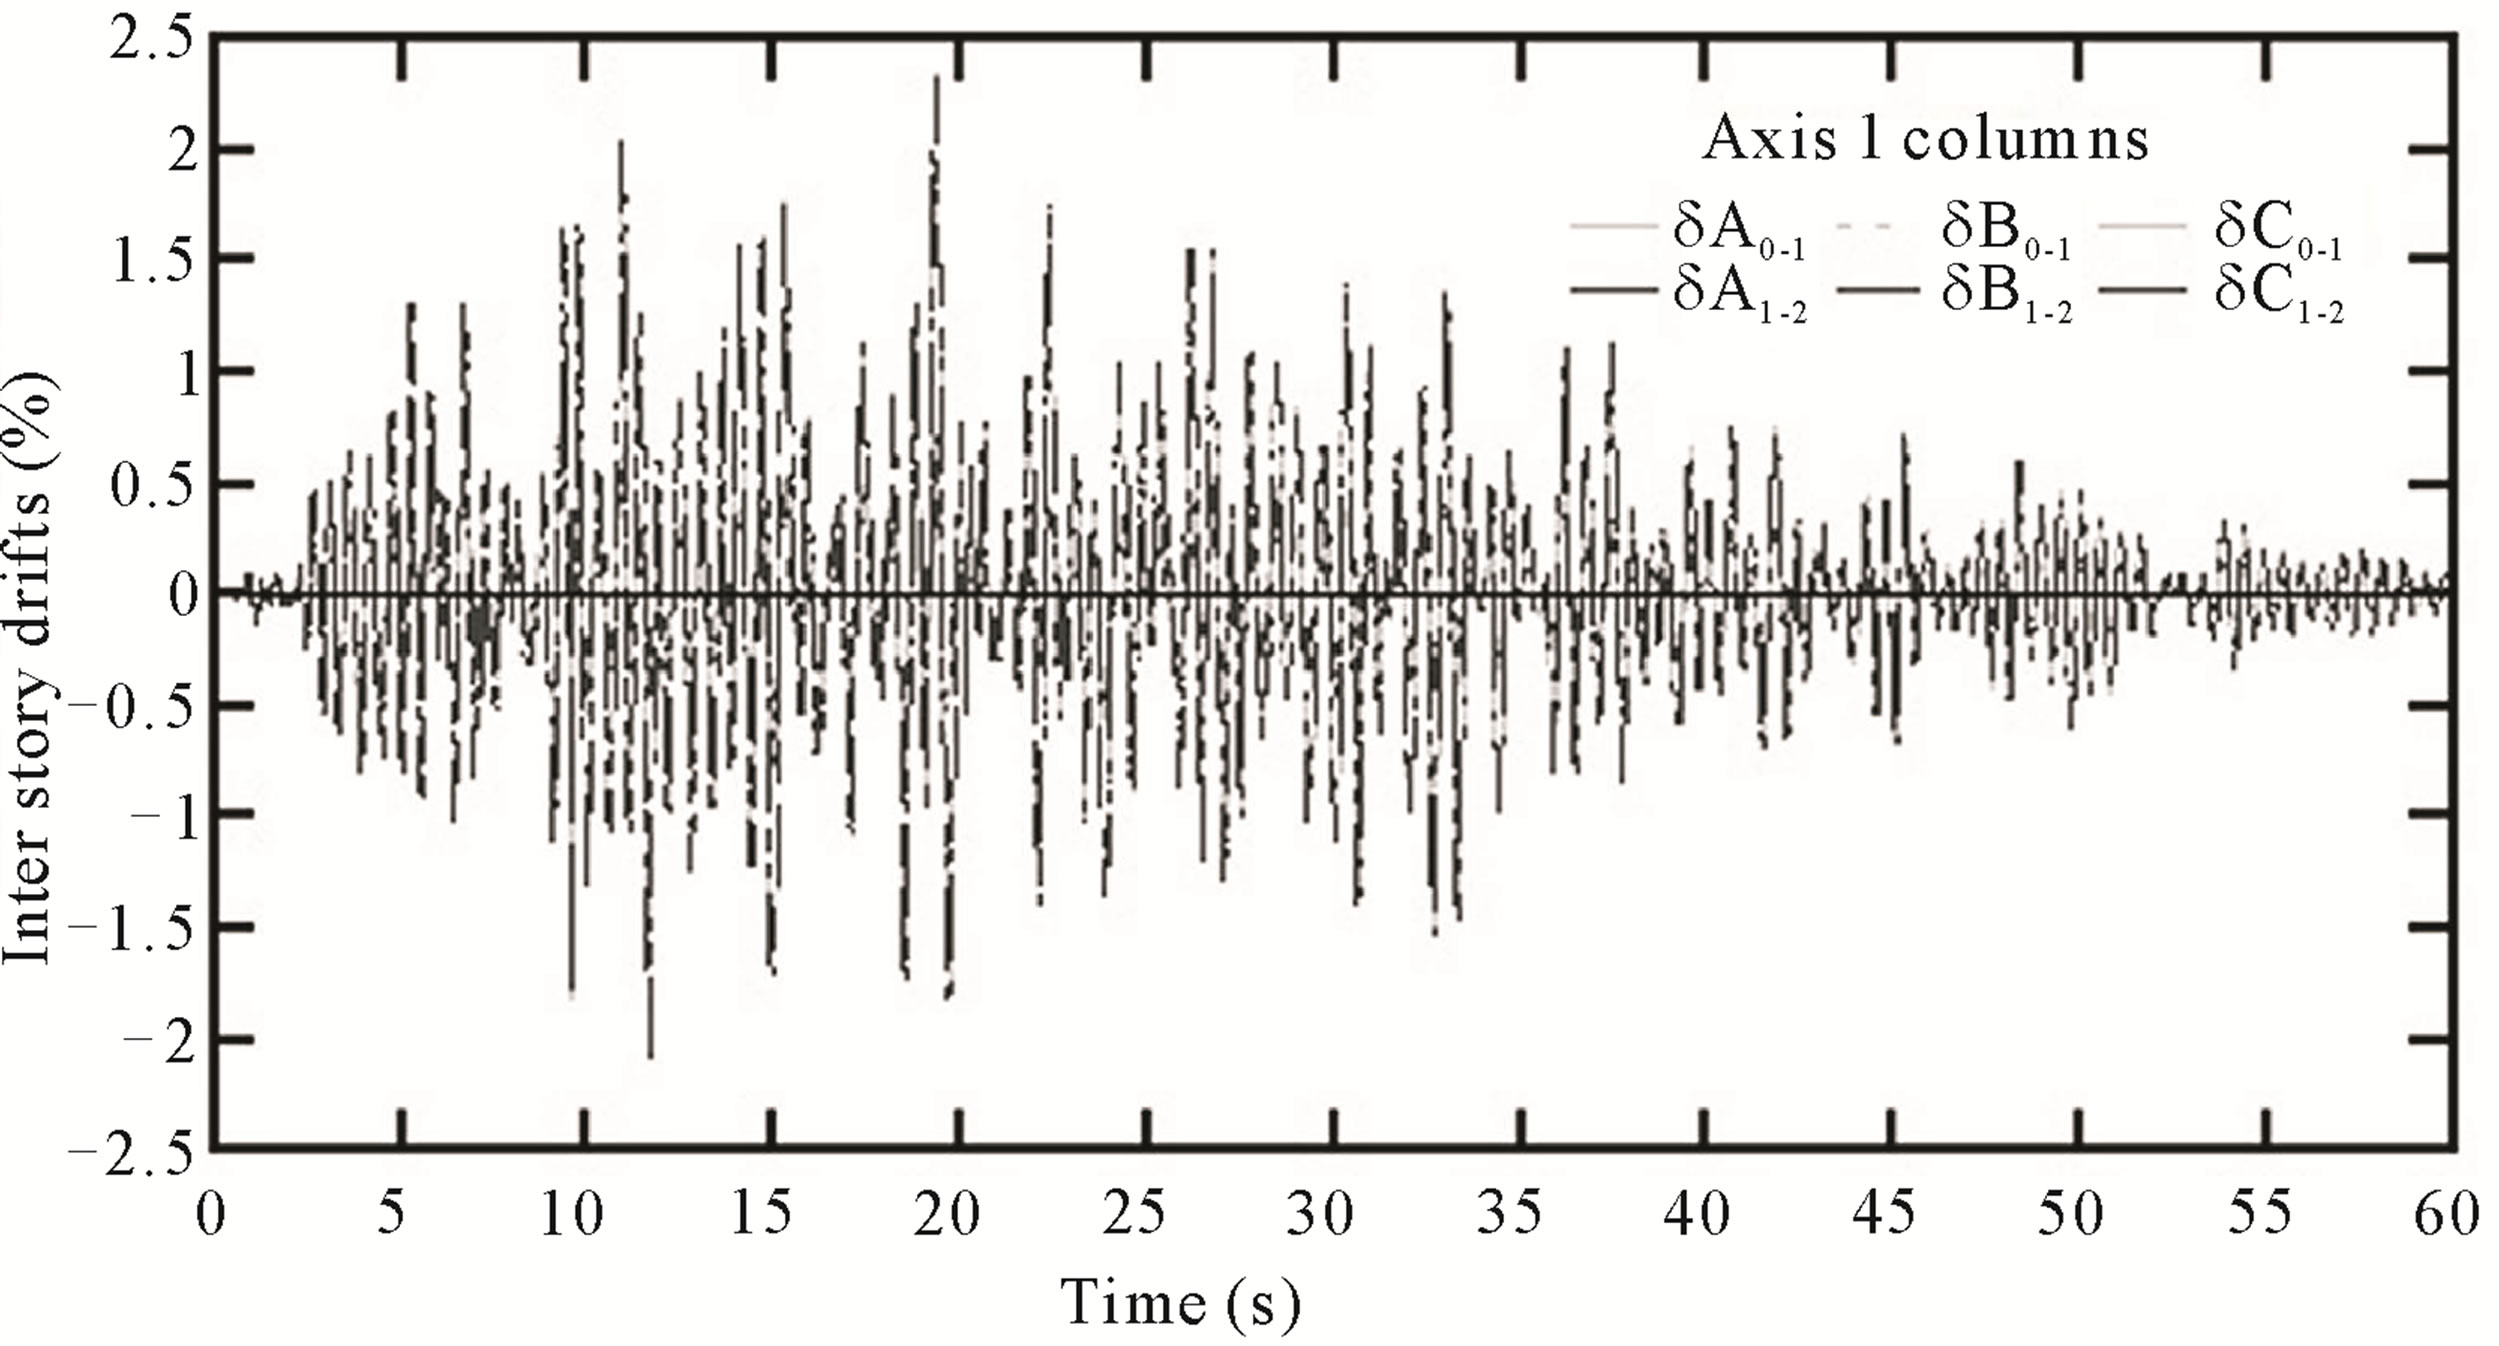
Figure 12. Interstory drifts. Frame C of RB building. Earthquake 100% (Z).
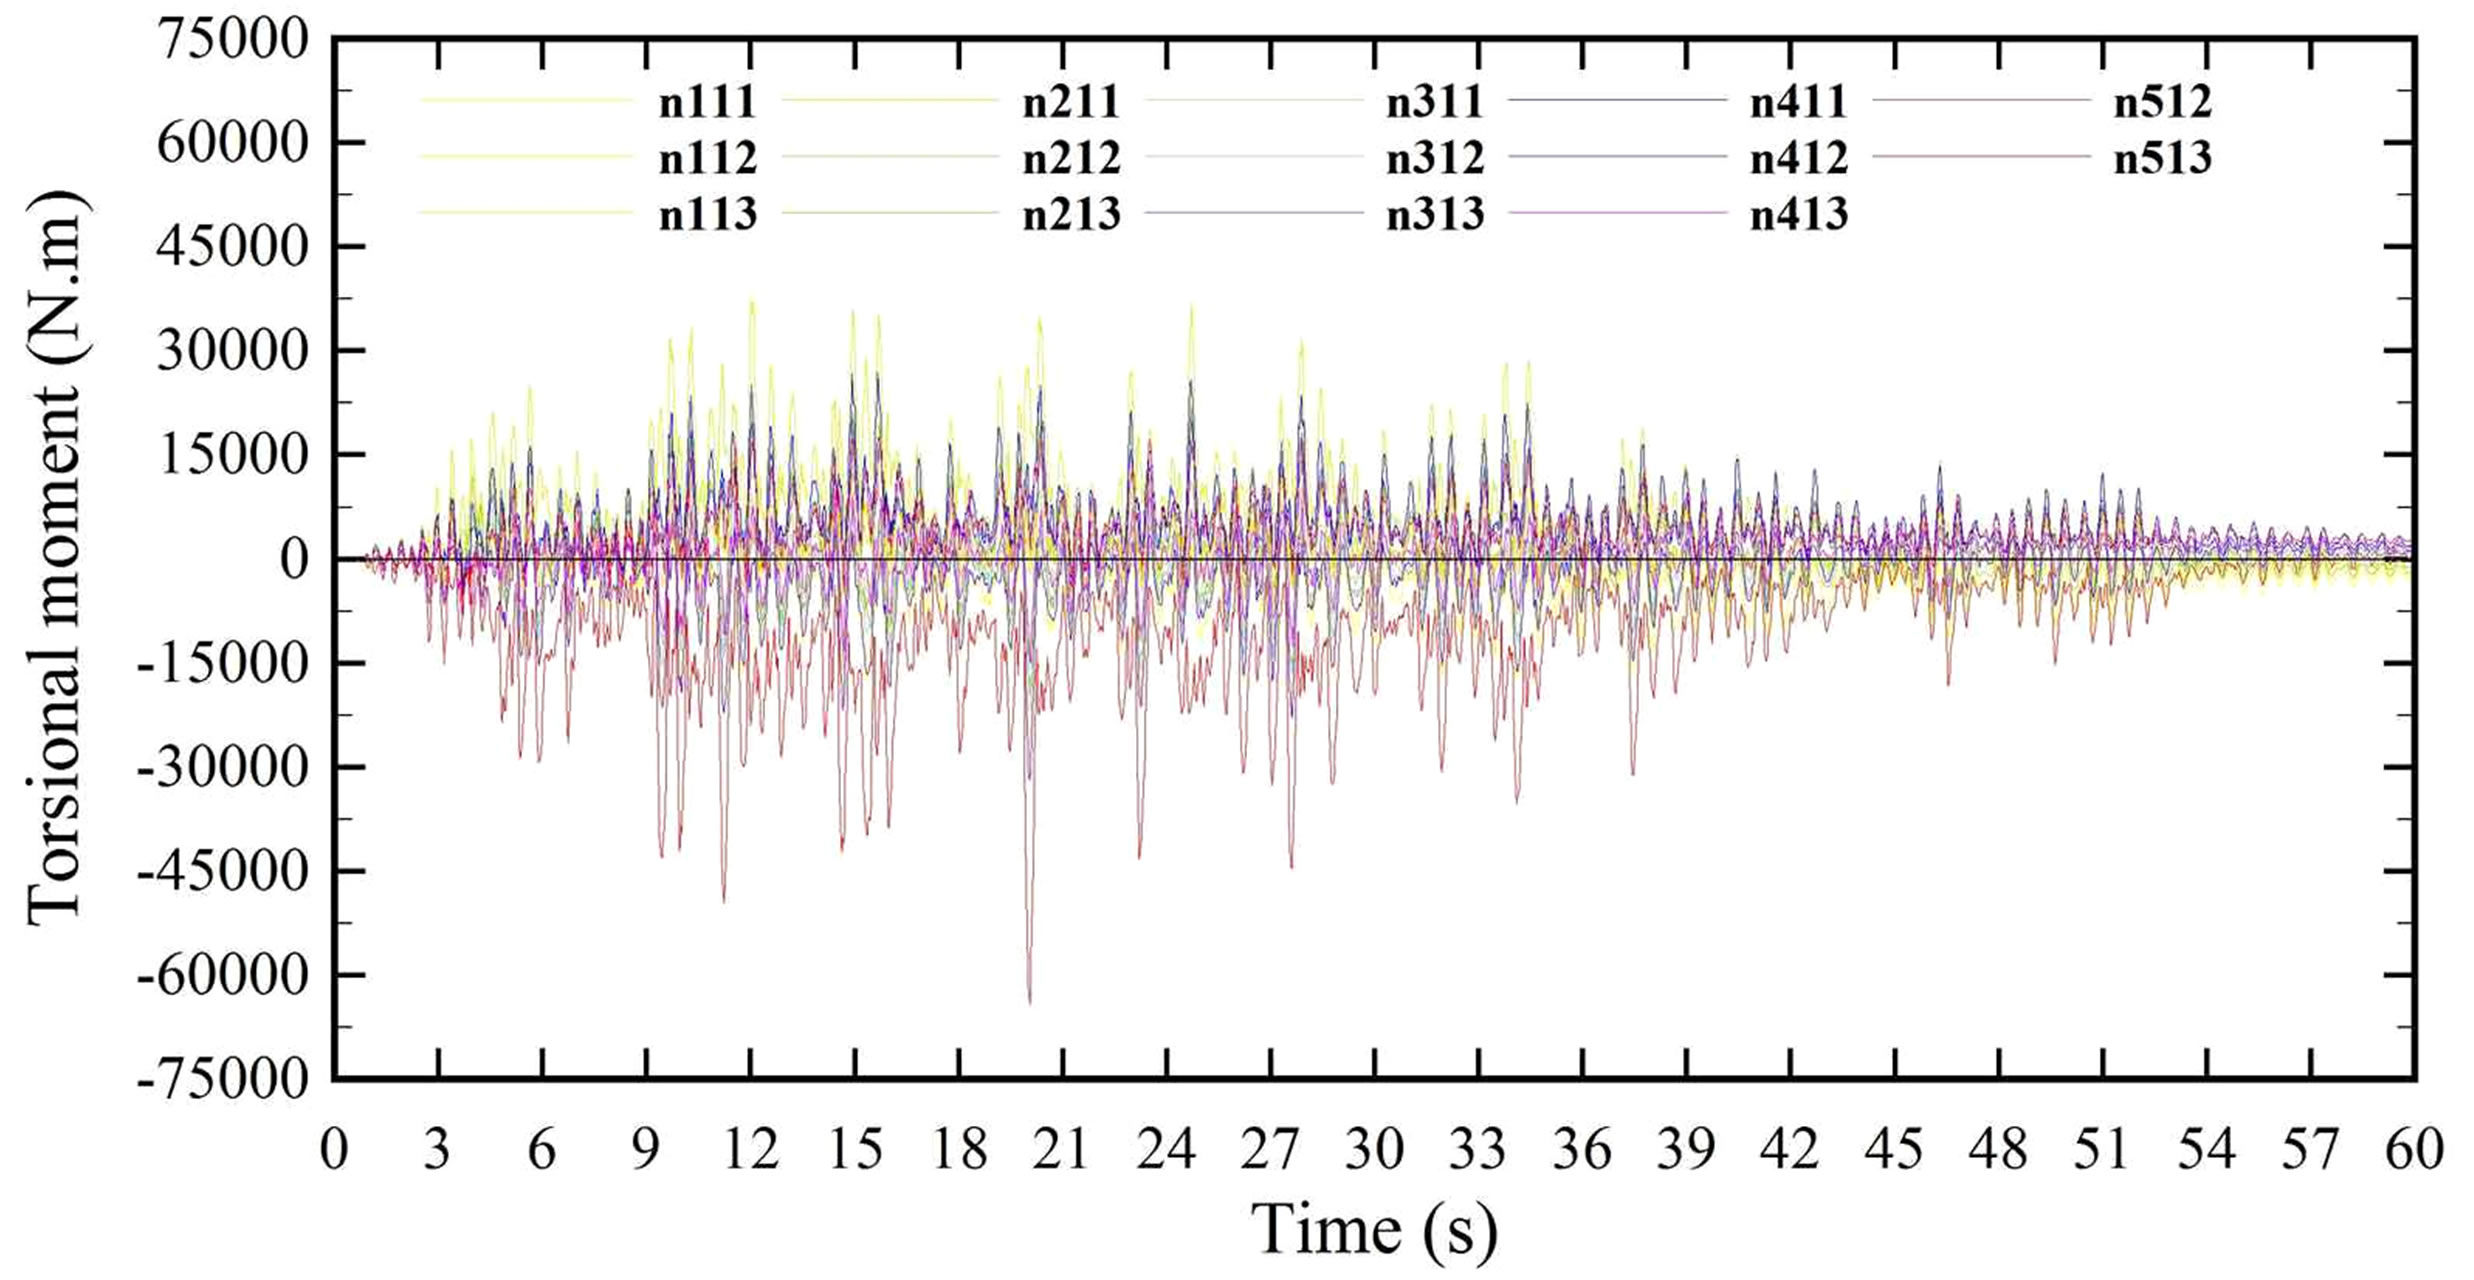
Figure 13. Torsional moments for earthquake 100% (X).
reached drifts values below this limit, proving good seismic performance on both buildings; OB presented drifts values which exceeded this limit. In the verification of interstory drifts it was generally noted that interstory drifts of OB building were longer than the considered by hazard levels, while the two resized buildings reached values within the thresholds established for each Limit State.
Three-dimensional dynamic analysis applied to RB building allowed determine that interstory drifts values were under the threshold of the Limit States considered. On the other hand, in order to know the maximum torsional moments for each column in this model, there were applied four seismic combinations where it was
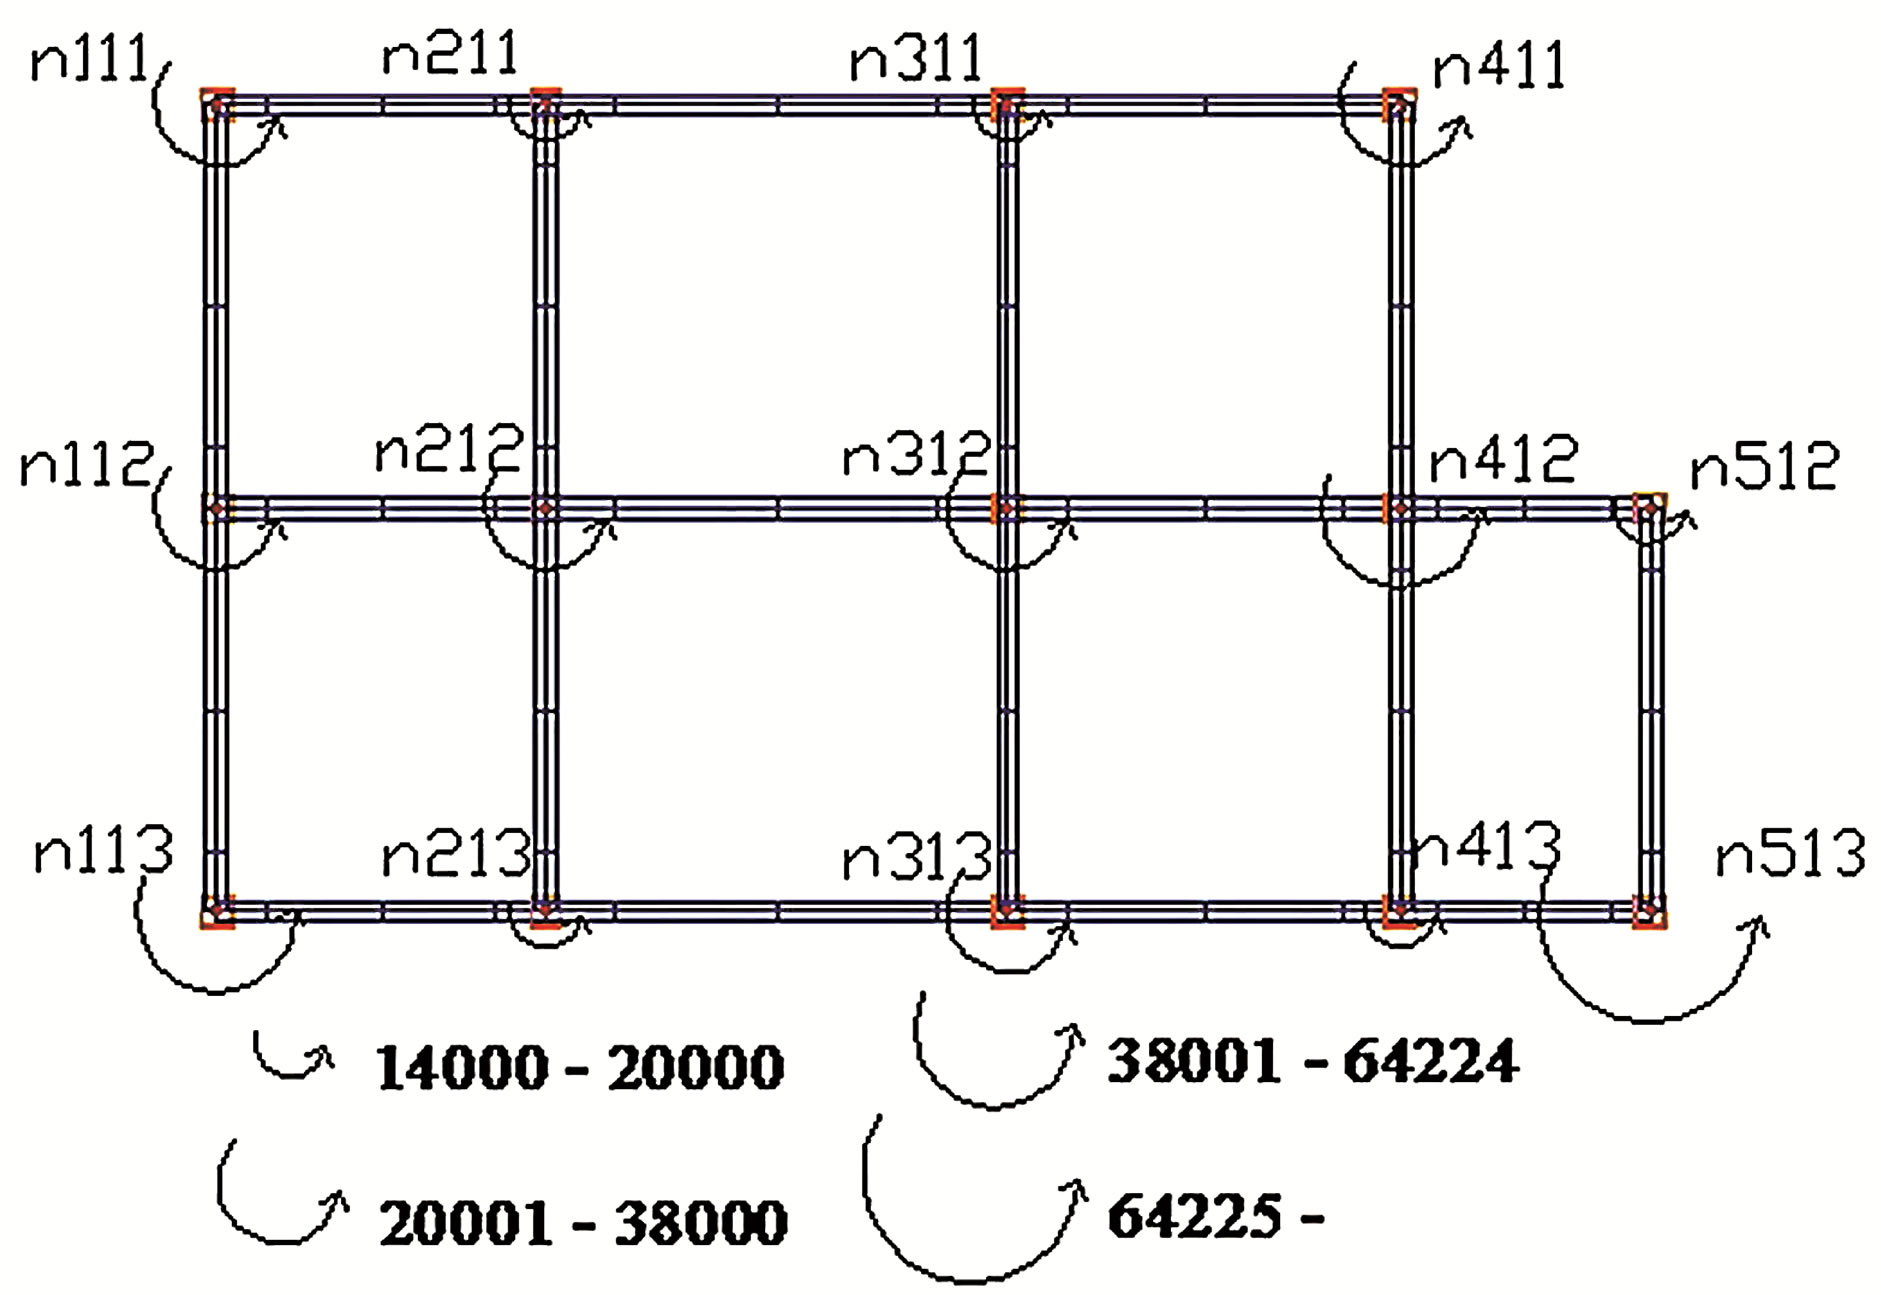
Figure 14. Torsional moments for earthquake 100% (X). Plant detail.
noted that there was greater torsion in the case of the component of the earthquake in Z-direction. Based on these results it was demonstrated the structural asymmetry of the assessed building since the center of mass does not coincide with the center of rigidity, determining that the greatest torsional moments are on outer columns and inner corners.
Interstory drifts of RB building obtained from 2D and 3D nonlinear dynamic analysis, it was noted that 2D model provided greater drifts values than the 3D model drifts. This is a logical and expected result since the 3D dynamic analysis considers the rigid diaphragm, which introduces restrictions to the number of degrees of freedom in the structure.
Inelastic static analysis is more reliable than linear methods in the prediction of the parameters of response of buildings, although this method has no response on the effects of higher modes of vibration. A more reliable and sophisticated method is the 2D no linear dynamic analysis, where it can be better determined the likely behavior of the building in response to the earthquake. However, the uncertainties associated with the definition of accelerograms used in these analysis and properties of coplanar structural models can be reduced with the implementation of the dynamic 3D analysis because there are considered factors associated with structural redundancy and are used more actual values in terms of rigidity of resistant structural lines.
REFERENCES
- Grases, J., Altez, R. and Lugo, M. (1999) Destructives earthquakes catalogue. Natural Sciences, Physics and Mathematics Academy, Caracas.
- Pérez, O. and Mendoza, J. (1998) Seismicity and tectonics in Venezuela and surroundings areas. Earth Physics, 10, 87-110.
- Barbat, A., Mena, U. and Yépez, F. (1998) Probabilistic evaluation of seismic risk in urban zones. International Magazine for Numerical Methods for Calculus and Engineering Projects, 14, 247-268.
- Calvi, G., Pinho, R., Magenes, G., Bommer, J., Restrepo, L. and Crowley, H. (2006) Development of seismic Vulnerability Assessment Methodologies over the past 30 years. ISET Journal of Earthquake Technology, 43, 75-104
- Fajfar, P. (2000) Nonlinear analysis method for performance based seismic design. Earthquake Spectra, 16, 573- 591. doi:10.1193/1.1586128
- Vielma, J.C., Barbat, A.H. and Oller, S. (2011) Framed structures earthquake resistant project. International Center for Numerical Methods in Engineering Monograph, Barcelona.
- COVENIN (2001) Earthquake resistant design code 1756:01. Ministerio de Fomento, Caracas.
- COVENIN (2006) Design and construction of buildings with structural concrete 1753:06. Ministerio de Fomento, Caracas.
- COVENIN (1988) Minimum actions and criteria for buildings projects code 2002:88. Ministerio de Fomento, Caracas.
- Priestley, M., Calvi, G. and Kowalski, M. (2007) Displacement-based seismic design of structures. IUSS Press, Pavia.
- Vielma, J.C., Barbat, A.H. and Oller, S. (2009) Nonlinear structural analysis: Application to evaluating the seismic safety. Nova Science Publishers, New York.
- Elnashai, A., Papanilolau, V. and Lee, D. (2011) ZEUS-NL: A system for inelastic analysis of structures. User Manual. Mid-America Earthquake Center Report No. MAE, Champagne.
- Papanikolaou, V. and Elnashai, A. (2005). Evaluation of conventional and adaptive pushover analysis I: Methodology. Journal of Earthquake Engineering, 9, 923-941. doi:10.1080/13632460509350572
- Mwafy, A. and Elnashai, A. (2001). Static pushover versus dynamic collapse analysis of RC buildings. Engineering Structures, 23, 407-424. doi:10.1016/S0141-0296(00)00068-7
- Vamvatsikos, D. and Cornell, C.A. (2002) Incremental dynamic analysis. Earthquake Engineering and Structural Dynamics, 31, 491-514. doi:10.1002/eqe.141
- Kappos, A. and Stefanidou, S. (2010). A deformationbased seismic design method for 3D R/C irregular buildings using inelastic dynamic analysis. Bulletin of Earthquake Engineering, 8, 875-895. doi:10.1007/s10518-009-9170-1
- UCLA-CIMNE (2009). Compatible accelerograms with elastic design spectrums generation programm (PACED). International Center for Numerical Methods in Engineering, Venezuela.
- Fajfar, P., Marusic, D. and Perus, I. (2005) Torsional effects in the pushover-based seismic analysis of buildings. Journal of Earthquake Engineering, 9, 831-854. doi:10.1080/13632460509350568