Health
Vol.08 No.01(2016), Article ID:63001,5 pages
10.4236/health.2016.81011
Perceptions on Public Health Facilities by Slum Dwellers in the Metropolitan Cities of India
Palaniappan Marimuthu1, Grish N. Rao2, Manoj Kumar Sharma3, Ramasamy Dhanasekara Pandian4
1Department of Biostatistics, National Institute of Mental Health Neuro Sciences, Bangalore, India
2Department of Epidemiology, National Institute of Mental Health Neuro Sciences, Bangalore, India
3Department of Clinical Psychology, National Institute of Mental Health Neuro Sciences, Bangalore, India
4Department of Psychiatry Social Work, National Institute of Mental Health Neuro Sciences, Bangalore, India

Copyright © 2016 by authors and Scientific Research Publishing Inc.
This work is licensed under the Creative Commons Attribution International License (CC BY).
http://creativecommons.org/licenses/by/4.0/


Received 8 December 2015; accepted 22 January 2016; published 25 January 2016
ABSTRACT
Rapid urbanisation and quest for better livelihood, push-pull factor of occupations education, policy changes attract large scale rural population to urban areas. It is well documented that in spite of better public health facilities including tertiary care hospitals which are available in the urban areas but the services are underutilised by the urban poor. Aim: Hence, in this paper, it is attempted to comprehend the reasons for underutilisation of available public health facilities and to compare the difference with non-slum areas of the major metropolitan cities of India. Methods: A secondary data from National Family Health Survey-III for five major metropolitan cities namely, Delhi, Hyderabad, Mumbai, Kolkata and Chennai is used for the analysis. Slum data which are classified by both the agencies, that is census of India and NFHS-III as slum households only considered for analysis. Results: In Mumbai slums about 90% of the households are having water sources from public tap or piped to yard followed by Hyderabad having better water supply and Chennai slum dwellers having minimum access to good water sources. About 11.4% of the households do not know where their toilet drainage is connected. There is a significant (P < 0. 001) difference in the observed proportions of toilet facilities by the cities studied. Proportions of open defecation is compared among five cities and it is found that Delhi and Hyderabad have similar proportion (P > 0.05) 75% to 79%, Kolkata and Chennai have parallel high proportion, that is more than 95% (P > 0.05) and Mumbai stands as median percent age as 89.6. Apart from Delhi, about 40% to 45% of the slum population is in the opinion of “long waiting time” in the government hospitals, and the same trend of proportions is observed for “poor quality of service”.
Keywords:
Slums, Metropolitan Cities, Government Health Facility, Toilets, Health Schemes, Perceptions

1. Introduction
The United Nations predicts that the world urban population will grow nearly two billion [1] by 2030. Slums are defined by the United Nations Organizations as “a building or group of buildings and area characterized by overcrowding, deterioration in sanitary conditions, or absence of facilities and amenities, which because of these conditions or any of them endanger the health, safety or morals of its inhabitants or the community”.
As per the census of India, the slums are defined as “residential areas where dwellings are in any respect unfit for human habitation by reasons of dilapidation, overcrowding, faulty arrangements and designs of such buildings, narrowness or faulty arrangement of streets, lack of ventilation, light, sanitation facilities or any combination of these factors which are detrimental to safety, health and morals [2] .
In India, unprecedented slum growth in their steep magnitude and their distribution is a big challenge to the civic administration. The slum population represents a poor physical, socio-economic environment and human health of an urban city.
In a decade, cultivable areas of India shrink from 163,355 to 141,861 (000’) hector [3] , forcing the agriculture labour force to seek for alternate livelihood. Rural literacy rate increases to 84.98% from 68.91% in a decade [4] and this elevated literacy rate is also another push factor for large scale migration to the urban areas. Lower sex ratio in the slum area indicates that male labour forces are more migrating to urban area than their counter part. The employment opportunity in the urban areas and the migration are in direct proportions. Slum dwellers ignore their health due to low literacy level, lack of awareness and reluctant to lose wage. Effective Health service for urban poor, which is a desperate need, their unwillingness to avail the health care facility and there are some bottle necks from the supply side. This implies that cases of infections, malnourishment in women and children and deaths rates are high in slum areas.
Apart from supplying civic amenities, sometime sudden epidemic break is a big challenge to the public health authorities. Government of India implemented some programs specific to slum population welfare and their health such as Rajiv A is Yojana, which is supporting states for activities like slum surveys, GIS mapping of slums and mobile clinic etc. Recently, Government of India launches the National Urban Health Mission for addressing the health needs of urban poor. All the health policy documents are too addressed the problem of slum health and recognise the underutilisation of the available welfare programs by slum dwellers.
It is well documented that in spite of better public health facilities including tertiary care hospitals which are available in the urban areas still the services underutilised by the urban poor. Hence, in this paper, it is attempted to understand the reasons for underutilisation of available public health facilities and is attempted to compare the difference with non-slum areas of the major metropolitan cities of India, viz., Delhi, Mumbai, Kolkata, Hyderabad and Chennai.
2. Data and Method
It is a secondary data analysis; National Family Health Survey-III data for five major metropolitan cities namely, Delhi, Mumbai, Kolkata and Chennai was used for the analysis. These data were obtained from Measuresdhs USA [5] . The households were classified as slum and non-slum by two agencies, viz., NFHS and census of India. slum data which were classified by both the agencies, that is census of India and NFHS-III as slum households were only considered for analysis. Definition for slum household by the census of India is provided above in the introduction part [2] and the in NFHS-III slum households were identified in the eight designated cities by the interviewing team supervisor at the time of the fieldwork. Few variables which are more relevant for the public health aspects namely, source of water supply, toilet facility, health insurance, reasons for not utilising the government health facilities and possessing of BPL cards selected for this study. Sampling and sample size of slum data where explained (Health and living conditions in eight Indian cities. NFHS-3) elsewhere [6] .
Chi-square test was used to test the proportions among five cities. Data were analysed using SPSS 11.0 Statistical package.
3. Results
From Table 1, it evident that better water supply is available for Mumbai slums about 90% of the households are having water sources from public tap or piped to yard followed by Hyderabad. From the above table it appears that Chennai slum dwellers having minimum access to good water sources. Majority of slum population is depending on the public water supply/hand pumps. Other category includes Protected well, unprotected well, Tanker truck, Cart with small tank, Bottled water. Observed difference of proportions in each city by source of water supply are significantly different (P < 0.001).
From Table 2, higher proportion of Mumbai and Kolkata slum households possess toilets with “Flush to piped sewer System” at the same time those who go for open defecation is also in higher proportion from these two cities. In general majority of the households are not having toilet facility and they mostly go for open defecation. About 11.4% of the households do not know where their toilet drainage is connected. “Other” category includes that Flush-don’t know where, Pit latrine-ventilated improved pit (VIP), Pit latrine-with slab, Pit latrine- without slab/open pit and dry toilet. There is a significant (P < 0. 001) difference in the observed proportion by each city. Proportions of the open defecation is compared [7] among the five cities it is found that Delhi and Hyderabad have similar proportions (P > 0.05) 75% to 79%, Kolkata and Chennai have parallel high proportion, that is more than 95% to 100% (P > 0.05) and Mumbai stand as medianper cent of 89.6.
In Table 3, it is shown that least proportion (25.8%) of Delhi slum dwellers expressed that “Facility time is not convenient” to them and highest proportion of (61.3%) form Mumbai slums also stated the same reason for not utilising the public health facility. Apart from Delhi, about 40 to 45 per cent of the slum population is in the opinion of “long waiting time” in the government hospitals. Same trend of proportions are observed for “poor quality of service” except for Delhi and Chennai. Another important reason for underutilisation of public health facility is “absence of health personnel” in the hospital and the least per cent is observed in Chennai. Others category includes Payment required, Medicine not provided reasons. Proportions of different reasons for not utilising the government health facilities by five cities are statistically significant (P < 0.001).

Table 1. Sources of water supply by five metropolitan cities.
*Mumbai for computing χ2-test last two categories (“tub well” and “other”) merged.
Table 2. Distribution of available Toilet facility by five metropolitan cities.
Table 3. Opinion about Government Health Facility by five metropolitan cities.
Above Figure 1 is self-explanatory for those who are covered by some health insurance schemes, it ranges from 14% to 24%, about one-fourth of slum population in Mumbai is covered by some health insurance scheme and least proportion observed from Delhi. Further analysis it is noted that those who are covered by some health scheme majority of them are supported by ESIS scheme (data not shown). Data have three categories that is “yes” “No” and “Don’t know” and the proportion from these five cities are statistically significant (P < 0.001).
Possessing the Below Poverty Line card is requirement for availing the government subsidised/welfare programs, by the poor people. It is noted that about 9.4% of themonly having this BPL cards in these five cities.
4. Discussion
Ample opportunities for health care, education and employment are available in the urban areas, but the newly migrated urban poor are reluctant to utilise the government facilities. The reason is that they are mainly migrated for their livelihood and they do not concentrate the available scheme or they do not know the places where to go and avail the services offered by the government. In Delhi slums, 86.50% of slum dwellers, the major source of drinking water is either tap or hand pump [8] . In another study from Delhi slums [9] , it is reported that tap water is 41.2%, ground water is 56.1%, and other sources are 50.8% [9] .
A study by Anita Khokhar, et al. [10] list the reasons for availing the government health facility which is easy available (45.3%), effective treatment (12.5%), low cost (67.3%), better service (4.4%), faith in system (6.9%), cordial behaviour (0%) and others (0%). And they also reveal that 87.3% of users in the opinion waiting time in the government health facility are more than 2 hours. In another study from Pune Slums [11] , it is reported that 35.1% of the slum dwellers avail the services of government health facilities while the satisfaction level is higher with private doctors (81.6%) and the main reason for the dissatisfaction with government health facilities is long waiting time (35.8%).
Upendra Bhojani et al. [12] from Bangalore, have demonstrated socioeconomic gradient with people living below the poverty line at significantly greater odds of reporting chronic conditions than people living above the poverty line (OR = 3, 95%; CI = 1.5, 5.8). Private healthcare providers manage over 80% of patients. They also show that an increase in income is positively associated with the use of private facilities. They also shown that an increase in income is positively associated with the use of private health facilities. A study on access to health service comprising of four cities [13] , it uncovers that majority (68%) of the respondents who are replied to the questionnaire say that there are only private health facilities in the slums. A small proportion about four percent says that there are government facilities. Most (80%) of those who consult a doctor prefer private facilities, of which about half visited private clinics, and 30% go to private hospitals and around 17% go to government hospitals. Almost no respondent choose to visit government dispensary for his or her conditions.
Archana S. Nimbalkar et al. [14] compare the health seeking behaviour between rural and slum samples and they report that antenatal care, hospital delivery, neonatal follow-up, health seeking, essential newborn care and exclusive breastfeeding are also lower in urban slums, as compared to villages. Health care and socioeconomic status of neonates in slums of smaller cities is poorer than in surrounding villages. BBL Sharma et al. [15] have demonstrated that more than 90 per cent of the population and almost all the poor are not covered by any health insurance scheme. Health care needs of these disadvantaged groups are primarily met through direct out-of
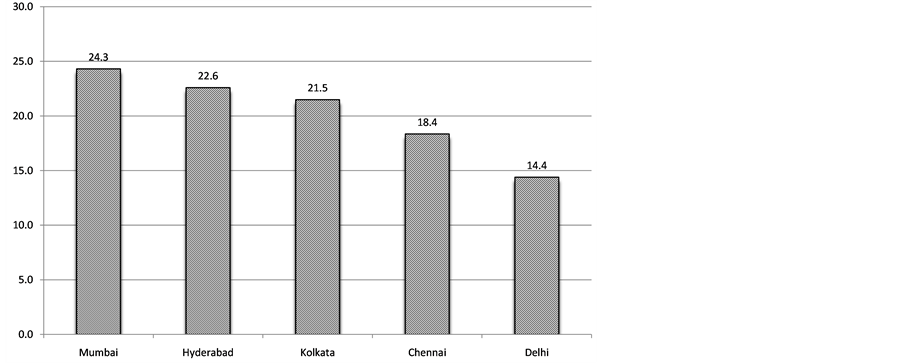
Figure 1. Members of the Households (%) covered by a health scheme or Health Insurance by Five cities.
pocket expenditure on services provided by the public and private sectors.
There are some Health supporting/insurance schemes available for the poor people by Government, they are Rashtiya Swasthiya Bima Yojana (RSBY), Employment State Insurance Scheme (ESIS), Aam Aadmi Bima Yojana (AABY), Janashree Bima Yojana (JBY), Universal Health Insurance Scheme (UHIS). But for availing benefits from these (most) schemes one should have the BPL card, it may note that, from this study we found that only 9.5% of the slum dweller are having the BPL card.
Cite this paper
PalaniappanMarimuthu,Grish N.Rao,Manoj KumarSharma,Ramasamy DhanasekaraPandian, (2016) Perceptions on Public Health Facilities by Slum Dwellers in the Metropolitan Cities of India. Health,08,93-97. doi: 10.4236/health.2016.81011
References
- 1. (2007) UN-HABITAT Report, Slum Dwellers to Double by 2030.
- 2. RGI. Census of India, Housing Stock, Amenities & Assets in Slums—Census 2011 HH-1.
- 3. Agriculture Census Division, Department of Agriculture and Cooperation (2012) All India Report on Agriculture Census 2005-06. Agriculture Census Division, Department of Agriculture and Cooperation, New Delhi.
- 4. Rao, K.H. Rural Development Statistics, 2011-12. National Institute of Rural Development, Hyderabad.
- 5. http://www.dhsprogram.com/data/available-datasets.cfm
- 6. Gupta, K., Arnold, F. and Lhungdim, H. (2009) Health and Living Conditions in Eight Indian Cities. National Family Health Survey-3, India 2005-06, Ministry of Health and Family Welfare, Government of India.
- 7. Fleiss, J.L., Levin, B. and Paik, M.C. (1980) Statistical Methods for Rates and Proportions. Wiley, USA, 138-142.
- 8. Directorate of Economics and Statistics Urban Slums in Delhi. Based on 69th Round of NSS. State Sample, Delhi-110054.
- 9. Marimuthu, P., Meitei, M.H. and Sharma, B.B.L. (2009) General Morbidity Prevalence in the Delhi Slums. Indian Journal of Community Medicine, 34, 338-342.
http://dx.doi.org/10.4103/0970-0218.58395 - 10. Khokhar, A., Garg, S. and Singh, M.M.C. (2003) Health Care Service Utilization for Kuslsus and Diarrhoeal Diseases: A Study amongst Slum Dwellers in Delhi. Health and Popula-tion-Perspectives and Issues, 26, 59-66.
- 11. Banerjee, A., Bhawalkar, J.S., Jadhav, S.L., Rathod, H. and Khedkar, D.T. (2012) Access to Health Services among Slum Dwellers in an Industrial Township and Surrounding Rural Areas: A Rapid Epidemiological Assessment. Journal of Family Medicine and Primary Care, 1, 20-26.
- 12. Bhojani, U., Beerenahalli, T.S., Devadasan, R., Munegowda, C.M., Devadasan, N., Criel, B. and Kolsteren, P. (2013) No Longer Diseases of the Wealthy: Prevalence and Health-Seeking for Self-Reported Chronic Conditions among Urban. BMC Health Services Research, 13, 306.
http://dx.doi.org/10.1186/1472-6963-13-306 - 13. Pradeep, I.G. (2015) Health Status and Access to Health Services in Indian Slums. Guin Health, 7, 245-255.
- 14. Nimbalkar, A.S., Shukla, V.V., Phatak, A.G. and Nimbalkar, S.M. (2013) Newborn Care Practices and Health Seeking Behavior in Urban Slums and Villages of Anand, Gujarat. Indian Pediatrics, 50, 408-410.
- 15. Sharma, B.B.L., Nair, K.S. and Bir, T. (2002) National Seminar on Development of Health Insurance in India: Current Status and Future Directions an Overview. Health and Population-Perspectives and Issues, 25, 11-25.