Engineering
Vol. 4 No. 10 (2012) , Article ID: 23356 , 4 pages DOI:10.4236/eng.2012.410086
Three-Level Control of a Distillation Column
1Department of Process Engineering, University of Pannonia, Veszprém, Hungary
2MOL Plc., Budapest, Hungary
Email: szabol@fmt.uni-pannon.hu
Received July 14, 2012; revised August 15, 2012; accepted August 26, 2012
Keywords: Distillation; Control; Multilevel Control
ABSTRACT
In this simulation study the operation of conventional distillation column (column with one feed and two products) was investigated with the application of AspenPlus DynamicsTM software. Control structures of the column which separate a two-component mixture were studied. The aim of our investigations was to discover dynamic and steady-state effects of heating and cooling on tray temperatures. The relationship of the tray temperatures and the purity of products were also identified. Based on the identified relationships a three level hierarchical control structure was developed. On the lowest level of the hierarchy there are the local controllers of heating and cooling. On the middle level of the control hierarchy the process variables are two tray temperatures and the output of the controllers is the set point of local controllers. On the top level of the control hierarchy the purity of the products are controlled over by manipulating the set point of the temperature controllers. This paper presents the functions of the control hierarchies and the middle level of the control hierarchy was analyzed in detail.
1. Introduction
Distillation is the most widely used method in chemical and petrochemical industry for separation. Approximately 95% of the component separation tasks are carried out with distillation in chemical industry, and the distillation units use around 3% of the total energy consumption of the world [1]. The improvement of the distillation equipments and processes are important because of their widespread use and their huge energy needs. Operation methods of distillation columns directly affect the product quality, production rates and utility usage. Hence suitable control of the distillation tower is very important from an economic viewpoint.
In this work multilevel control structures of the column with two products and one feed have been analysed.
In the point view of control the distillation columns can be considered for MIMO objects, the control of these kinds of units are a complex task [2]. The interaction of controllers and the behaviour change according the working point of objects were analysed in each level of the control hierarchy during the creating of control system. In view of discovered relationships the structures of each control levels were determined.
2. Separation Task
The feed is a binary mixture which consists of acetone and benzene. The concentration of each component are 50 mole%. The purity of the product is 99 mole%. The vapour fraction of the feed and the products is zero. The pressure of the separation is 4.5 bar.
The simulator was implemented in AspenPlus DynamicsTM. The structure of the simulator is shown on Figure 1.
3. Control Structure of Column
Figure 2 represents the structure of the three levels of controllers.
On the lower level of the hierarchy there are the local controllers. On this level the controllers ensure the operating condition (pressure and level controllers) of the column and eliminate the disturbance (flow rate controllers) of the environment. The controller output variables are the valve positions and process variables are the mass rates and the pressure. The local controllers are shown on Figure 1 [3]. The FC1 controller compensates the fluctuation of the feed mass flow. The PC and the FC3 controllers eliminate the fluctuation of cooling water and heating steam. The level controllers (LC1 and LC2) are necessary to ensure the normal operation inevitably because the reflux and boilup flowrate will be zero if there is not liquid phase in the reflux drum and the bottom of the column. PI controller has been applied here.
The separation is based on the sustenance of the temperature difference between the head and bottom pro-
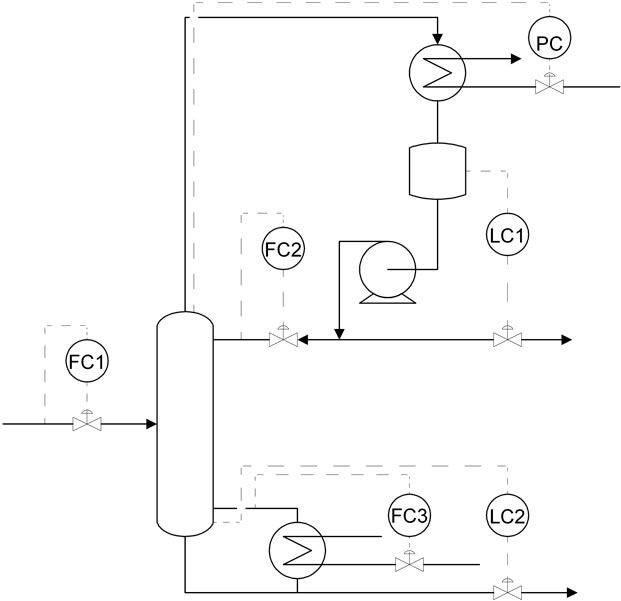
Figure 1. Structure of local controllers.

Figure 2. Structure of control system.
ducts. Therefore on the middle level of control hierarchy the process variables are two tray temperatures which characterize the upper (rectifying zone) and lower (stripping zone) part of the column. The controlled tray temperature can be chosen according the steady state characteristic. The temperature of the upper column part was controlled by manipulating the set point of FC2 controller, while the temperature of the lower column part was controlled by the set point of FC3 controller. The purities of the products determine the quality of the separation. Therefore the purity of the products are controlled on the top level of the control hierarchy The controller outputs on this level are the set point of the temperature controllers.
4. Analysis of Local Controllers
Due to interaction of the control loops the order of the controller tuning is important and if it is necessary these controllers should be tuned in iterations (retune).
In the analysis of local controllers the first step is the open loop analysis and the tuning of liquid level controllers (LC1, LC2). These controllers are turned on in further steps.
In the second step the pressure (PC) and mass flow (FC1, FC2, FC3) control loops were analysed. During the examination of each control loop the other analysed (open-loop identification and tuning) controllers were turned off. In the third step the previous analysis was repeated but the other analysed controllers were turned on. We collected the following experience during the analyses the local controllers.
There are two kind of local controllers according the interaction:
• The other control loops do not disturb it. These controllers should be tuned in one step.
• The other control loops disturb it. These controllers should be tuned in iterations.
The operation of boilup controller is shown on Figure 3, it is an example for the behaviour of the local control loops. The figure also shows that the process variable (PV) settles on the setpoint without overshoot. The operation of other local controllers is similar to the operation of boilup control loop.
5. Selecting the Process Variable
The analysis of temperature controllers is preceded by the selection of the process variable (Figure 4). The controlled temperature of the upper column part was chosen from the temperature of trays 15 - 21 because:

Figure 3. Operation of local controllers.
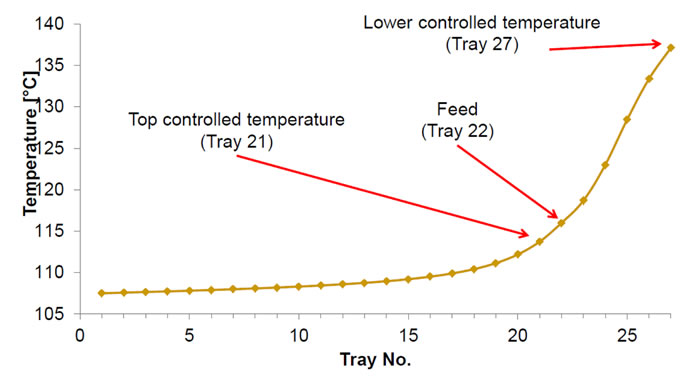
Figure 4. Selecting the process variable.
• The changes in temperature from tray to tray were little in the part of the column above• The controlled temperature should be above the feed.
Accordingly the upper controlled temperature is measured on the 21st tray and the lower controlled temperature is measured on the 27th tray [4].
6. Decoupling
In the first case the open-loop identification and tuning of the temperature controllers are carried out with the other analysed controller turned off. In the second case the other analysed controller is turned on. The analysis of temperature controller is shown on Figures 5-8.

Figure 5. Analysis of TC1 (1st case).
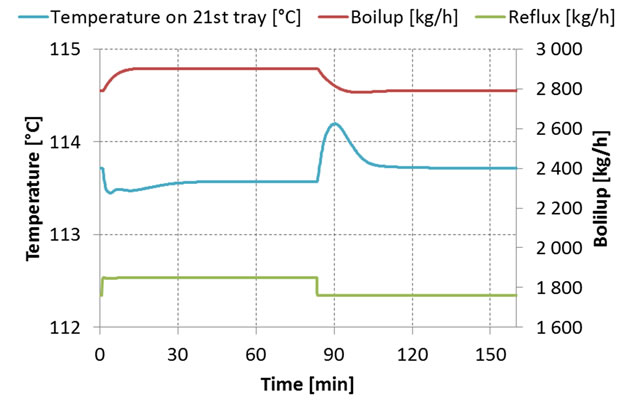
Figure 6. Analysis of TC1 (2nd case).
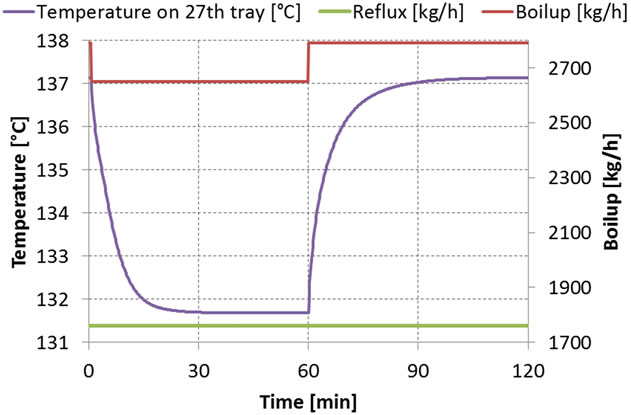
Figure 7. Analysis of TC2 (1st case).
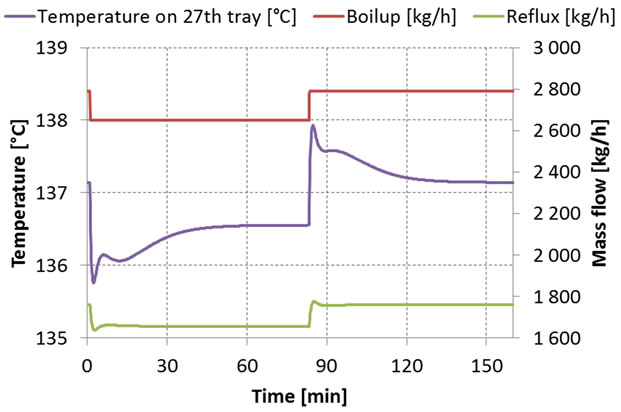
Figure 8. Analysis of TC2 (2nd case).
It can be seen that the second case shapes of the transient become radically different. In the second cases the approximation of the controlled objects are not possible because of the shape of the transients. The main cause of radical difference is the coupling effect. This means that the two controller outputs take significant effect on both process variables (Figure 9). The Bristrol [5] matrix also shows the interaction of the control loop (Table 1).
The Figure 9 shows the analysis of the coupled effect. In this case the output of the controller was changed with 10 kg/h while the other output was constant. In the next step the process variable was plotted as the function of time. Using the collected simulated data first order with time delay models were identified and these models can be applied to calculate the parameter of the control structure with decoupling [6].
The control time constant is large because of the coupling effect if the two controllers are turned on and the parameters which are obtained in the first case are used. In order to eliminate this effect dynamic and static decoupling was tested. The structure of control system is shown on Figure 10.
The block D1 and D2 represent the decoupling. The parameters obtained from the first case of the temperature control analysis were used in the calculation of the parameters of D1 and D2 (Equations (1)-(2)).
The operations of controllers are shown on Figure 11. The results show that the controllers with decoupling are faster than the simple PI controllers without decoupling. There is no significant difference between the operation of dynamic and static decoupling. Hereafter PI controller with static decoupling is analysed.
 (1)
(1)
 (2)
(2)
7. Adaptive Control
Besides the coupling effect another well-known effect
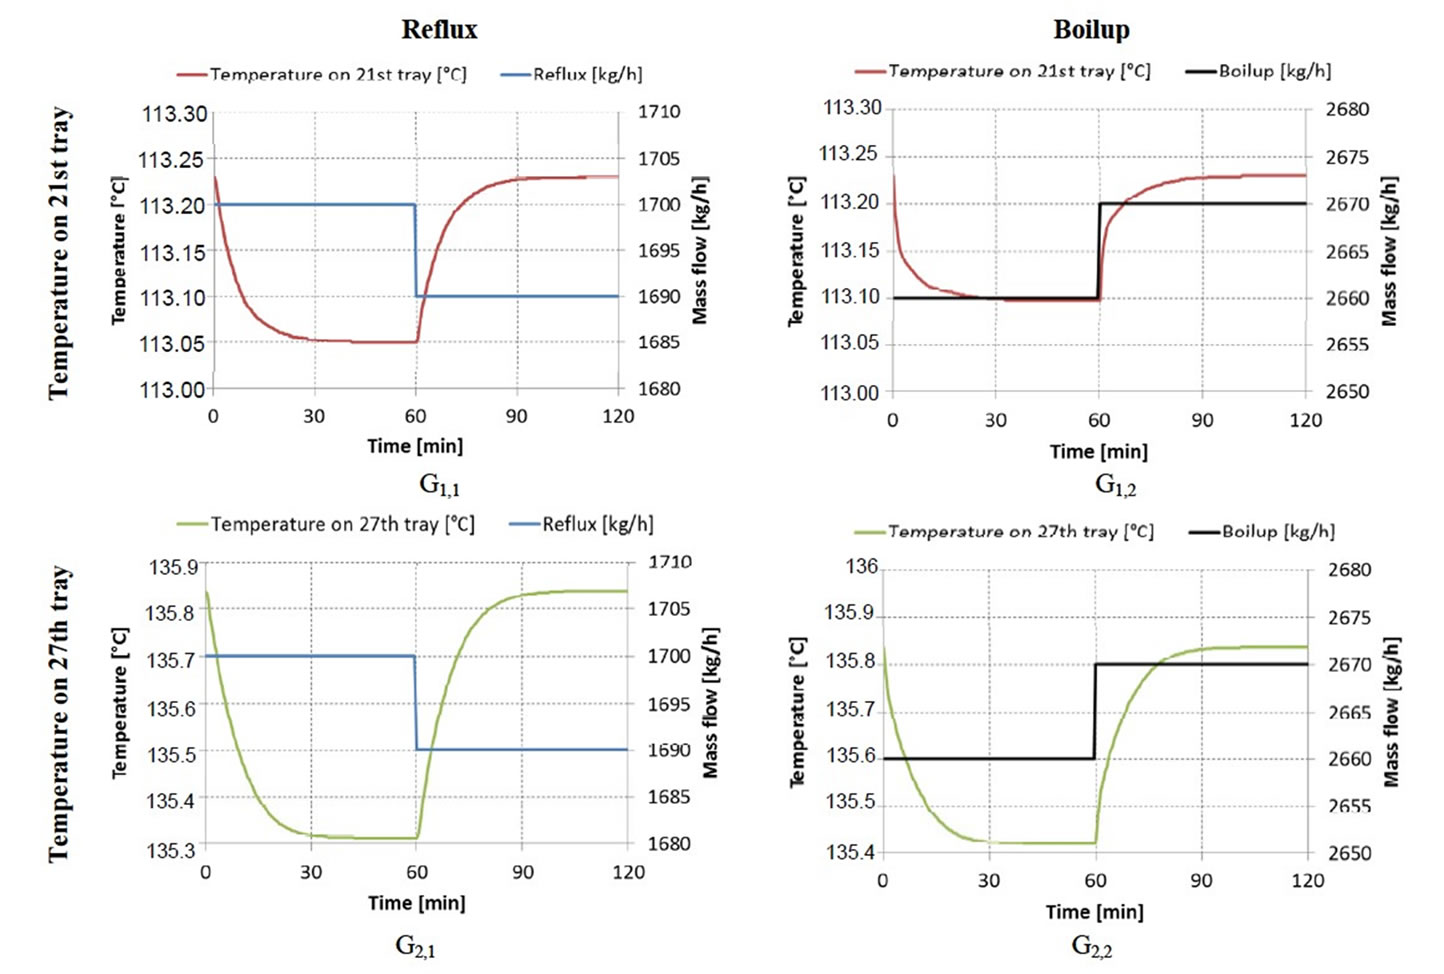
Figure 9. Coupled effect.

Table 1. Bristrol matrix of the column.
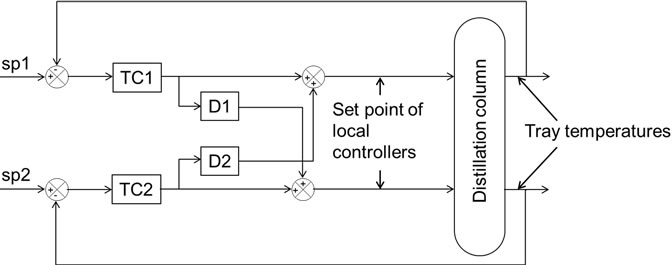
Figure 10. Decoupling.
was analysed during the analysis of temperature controllers which is the nonlinearity. This effect is shown on Figure 12.
In order to eliminate this effect, the parameters of the controllers were obtained according to the operation point (adaptation). The structure of the control system is shown on Figure 13.
The control with adaptation becomes independent of the operation point (Figure 14). During this analysis the other analysed controller is turned off.
8. The Middle Level Temperature Control
The temperature control is on the middle level of the con-

Figure 11. Operation of TC2 temperature controller I.

Figure 12. Nonlinearity.
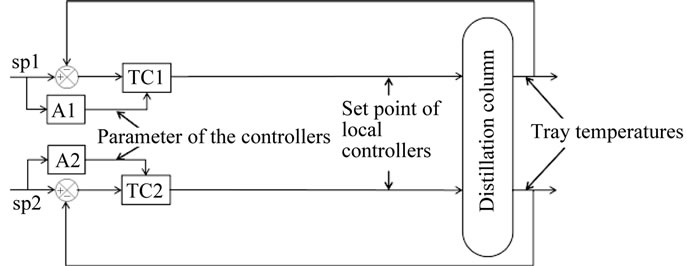
Figure 13. Adaptive control.

Figure 14. Operation of TC2 temperature controller II.
trol hierarchy therefore the setpoint of these controllers are the outputs of the controllers on the top level of the control hierarchy. Hence the temperature controllers have to eliminate the previous effects in a defined range. That is why the previous control solutions are combined, the parameter of the controller with decoupling was also obtained according to the operation point.
Another effect makes more difficult to control. Changes of the operation point can cause difference in steady state characteristics (Figure 15). Qualitatively of the steady state characteristic on Figure 4 can became different (Figure 15) according to the operating point. This cause that the place of the temperature measurement point should be changed and the analysis should be repeated onto the new structure. The domain of the two different characteristic can be seen on the Figure 16. On border of the two parts hysteresis phenomenon is detected [7].
The parameter of the temperature controllers are obtained with open loop analysis, therefore a domain of the reflux and boilup was defined around the operation point (Reflux: 1690 kg/h; boilup: 2670 kg/h). The domain is shown on the Figure 16. In this domain the parameters of the controllers are obtained by changing the controller outputs in steps in an open-loop experiment. Figure 17 shows the change of the process gain of the TC1 control loop in the domain. This is example for the stationary characteristics.
The analysed domain can be divided into five different parts. In the part of the domain with minimal reflux and maximal boilup the trays of the column are dried up and with minimal boilup and maximal reflux the trays are
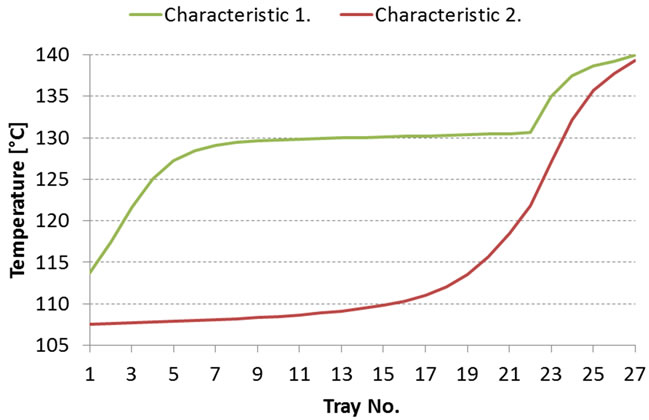
Figure 15. Temperature profiles.

Figure 16. Domain of the controller outputs.
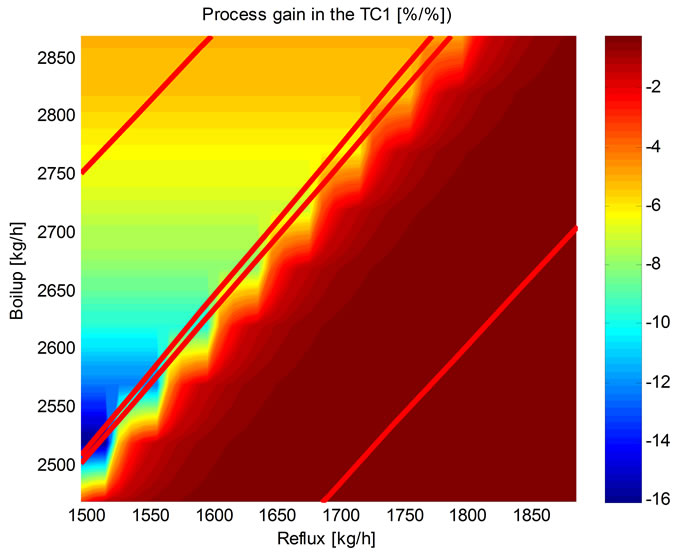
Figure 17. Process gain in the TC1 control loop as the function of reflux and boilup.
flooded. In these regions the column cannot operate. The rest of the domain can be divided into two main parts considering the shape of the temperature profile of the column (Figure 15). Between the two main parts a transitional zone was identified. In this zone the change of the parameter is significant and the column has more than one steady states. In the transitional zone hysteresis (Figure 18) was found in the steady states of the controlled temperature according to the way of the controller outputs. On the Figure 16 the borders of the transitional zone are plotted. In this zone the control is unstable if this control structure was applied.
Because the operating point is in the part of the domain where the type of temperature profile is the 2nd type therefore the parameter of the controllers are just obtained on this part. The structure of the control system is shown on Figure 19.
The parameters changes of the controllers are obtained as the function of reflux and boilup. However the parameters changes have to be obtained as the function of the two controlled temperature in the interest of the control system stability. Therefore the reflux and boilup as the function of the two controlled temperature are calculated (Figure 20). These characteristics were obtained from the steady states temperatures of the open loop analyses. Accordingly the temperature of the 21st tray depends on the other controlled tray temperature [8].
The operations of the controllers are shown on the Figures 21 and 22. The figure also shows that in case of PI controllers with static decoupling and adaptation the process variables settle on the setpoint with overshoot. However the behaviour of the controller is mostly inde-

Figure 18. Hysteresis of the 27th tray temperature.
pendent of the operation point. The operation of the controllers on the middle level of the control hierarchy is adequate.
9. Conclusion
For the operation of the distillation column a three-level control structure was developed. On the lower level of the control hierarchy controllers were created which ensure the operating condition of the column (pressure and level controllers) and eliminate the disturbance of the environment (flow rate controllers). In the aspect of the controller tuning there are two types of controllers. The
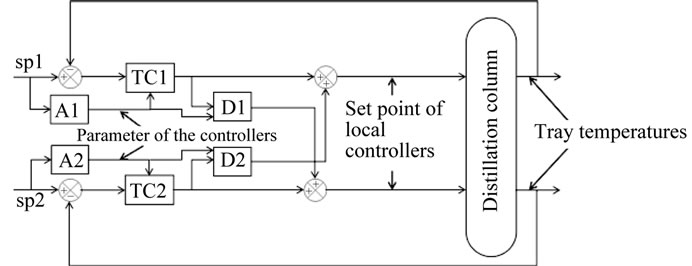
Figure 19. Structure of middle level control.
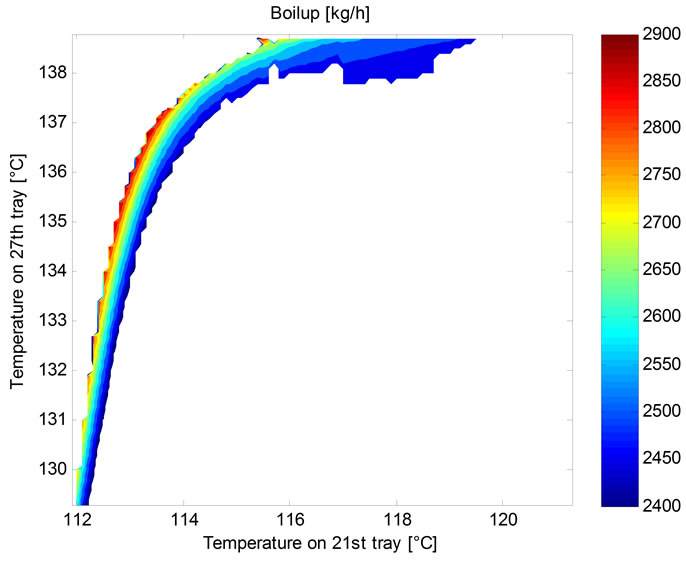
Figure 20. Boilup as the function of lower and upper controlled temperatures.

Figure 21. Operation of TC2 temperature controller III.

Figure 22. Operation of TC1 temperature controller.
first type can be tuned independent because of the little interaction. At the tuning of the second type controllers the order of the tuning is important. On the middle level of the control hierarchy two mutually strongly connected temperature controllers are developed. The interactions of the controller are eliminated with decoupling and adaptation. The domain of the operation can be separated into two main partitions. In these parts the steady state characteristics show qualitative differences. Different control structures belong to the different steady state characteristic. On border of the two domains hysteresis phenomenon is detected. The top level of the control hierarchy can be developed from the steady state characteristic of the temperature and concentration.
10. Acknowledgements
This work was supported by the European Union and financed by the European Social Fund in the frame of the TAMOP-4.2.1/B-09/1/KONV-2010-0003 project.
The financial support from the TAMOP-4.2.2/B-10/ 1-2010-0025 project is gratefully acknowledged.
REFERENCES
- K. Mansour and E. Mansour, “Rigorous Optimization of Heat-Integrated and Petlyuk Column Distillation Configurations Based on Feed Conditions,” Clean Technologies and Environmental Policy, Vol. 11, No. 1, 2009, pp. 107-113.
- S. Skogestad and M. Morari, “The Dominate Time Constant for Distillation Columns,” Computers & Chemical Engineering, Vol. 11, No. 6, 1987, pp. 607-617. doi:10.1016/0098-1354(87)87006-0
- P. S. Buckley, “Techniques of Process Control,” Wiley, London, 1964.
- J. Abonyi, “Fuzzy Modell Identification for Control,” Birkhäuser, Boston, 2003. doi:10.1007/978-1-4612-0027-7_4
- S. Skogestad, “Dynamics and Control of Distillation Columns: A Tutorial Introduction,” Chemical Engineering Research and Design, Vol. 75, No. 6, 1997, pp. 539- 562. doi:10.1205/026387697524092
- S. J. Benz1 and N. J. Scennal, “An Extensive Analysis on the Start-Up of a Simple Distillation Column with Multiple Steady States,” The Canadian Journal of Chemical Engineering, Vol. 80, No. 5, 2002, pp. 865-881. doi:10.1002/cjce.5450800510
- N. Sharma and K. Singh, “Control of Reactive Distillation Column: A Review,” International Journal of Chemical Reactor Engineering, Vol. 8, No. 1, 2010.
- W. L. Luyben, “Process Modeling, Simulation, and Control for Chemical Engineers,” 2nd Edition, McGraw-Hill College, Singapore City, 1990.

