Materials Sciences and Applications
Vol.4 No.8A(2013), Article ID:36317,9 pages DOI:10.4236/msa.2013.48A011
Fabrication of Congo Red/Oxidized Porous Silicon (CR/OPS) pH-Sensors
![]()
1Advanced Technology and New Materials Research Institute, City for Scientific Research and Technology Applications, New Borg El-Arab City, Alexandria, Egypt; 2Physics Department, Faculty of Science, Alexandria University, Alexandria, Egypt.
Email: hady8@yahoo.com, h.soliman@mucsat.sci.eg, marwamoh2000@yahoo.com, ahmedbishara@yahoo.com
Copyright © 2013 Abdel-Hady Kashyout et al. This is an open access article distributed under the Creative Commons Attribution License, which permits unrestricted use, distribution, and reproduction in any medium, provided the original work is properly cited.
Received June 13th, 2013; revised July 14th, 2013; accepted July 27th, 2013
Keywords: Nano porous silicon; anisotropic etching process; alkali etching; Congo red; pH sensor
ABSTRACT
The fabrication of nano porous silicon, nPSi, using alkali etching process has been studied and carried out. The surface chemistry of anisotropic etching of n-type Si-wafer is reviewed and the anisotropic chemical etching of silicon in alkaline solution using wetting agents is discussed. Transformation of crystallographic plane of n-Si (211) to nPSi (100) has occurred on using n-propanol as wetting agent. The rate of pore formation was 0.02478 - 0.02827 µm/min, which was heavily dependent upon the concentration of the etchant containing wetting agents, allowing patterned porous silicon formation through selective doping of the substrate. A particle size of 15 nm for porous nano-silicon was calculated from the XRD data. Porosity of PS layers is about 10%. Pore diameter and porous layer thickness are 0.0614 nm and 16 µm, respectively. The energy gap of the produced porous silicon is 3.3 eV. Furthermore, the combination of PS with Congo Red, which are nanostructured due to their deposition within the porous matrix is discussed. Such nano compounds offer broad avenue of new and interesting properties depending on the involved materials as well as on their morphology. Chemical route was utilized as the host material to achieve pores filling. They were impregnated with Congo Red, which gave good results for the porous silicon as a promising pH sensor.
1. Introduction
Porous silicon is a very promising material due to its excellent mechanical and thermal properties, its obvious compatibility with silicon based microelectronic and its low cost. Also it has large surface area within a small volume, its controllable pore sizes and its convenient surface chemistry. All these features lead, on one hand, to an interest in optical properties by mixing silicon with air in the effective medium approximation. On the other hand, the pores allow the penetration of chemical and biological substances, liquids cells molecules to change; i.e. the optical behavior of the original system. These effects inspired research into different applications like optical sensing applications and biomedical applications [1].
Wet etching of semiconductor crystal in solutions is a dissolution process to uniformly or preferentially remove material from the crystal surface. Etchings of silicon in solutions commensurate with its large range of etch rates, great selectivity with respect to orientation and doping type [2]. Nano porous silicon (nPSi) can be considered as a silicon crystal having network of voids in it. The nanosized voids in the silicon bulk result in a sponge-like structure of pores and channels surrounded by a skeleton of crystalline Si nanostructure [3].
The morphology is the least quantifiable aspects of porous silicon. It is very difficult to systematically characterize the morphology of porous silicon, which has extremely rich details with respect to variations in pore size, shape, spatial distribution, densely and randomly branched pores which do not show a clear orientation. Etching solutions and processes have been developed for silicon etching, which can be grouped into three major categories according to relative etching rates on surfaces of different crystallographic orientations and the uniformity of the etched surface: 1) isotropic etching system: represented by HF-HNO3, 2) anisotropic etching system: represented by alkaline solutions, and 3) defect etching system: represented by HF-CrO3 solutions [4].
1.1. Classification of Porous Silicon
The porosity value of silicon is a macroscopic parameter and doesn’t yield any information regarding the microstructure of the layer. It is proposed that the properties of a sample are more accurately predicted if the pore size and its distribution within the sample can be obtained. Therefore, porous silicon has been divided into three categories based on the size of its pores: macroporous, mesoporous, and microporous [5]. This categorization is related only to the pore diameter, but does not contain much information about the pore morphology. The term pore morphology is used for properties like shape (smooth, branched, facetted, etc.), orientation, interconnection of pores, etc.
1.2. Pore Type
In the porous layer, there are several types of pore that can be created in a silicon wafer. In the most general sense, a “pore” is an etch pit whose depth exceeds its width. Most porous silicon layers are a few µm deep and individual pores are generally closed at one end in and interconnected to some degree. “Closed” pore is created via capping or by thermally-induced reconstruction of pore network [3].
1.3. Pore Shape
The most common shape by far is cylindrical pores. Early Japanese studies reported “ink-bottle” type morphology where there is a thin surface porous film (SPF) of much smaller pore size than the rest of the layer, with varying degrees of “branching” and necking [6].
In this paper, porous silicon have been produced depending on our previous study [7], using alkali media that is preferable with respect to the disadvantages of using HF with its toxicity, corrosivity and hazardous to water. The main factors affecting the production of porous silicon from single crystal silicon as a result of anisotropic etching like concentration of etchant (KOH), concentration of wetting agent (Iso-propanol, n-propanol), temperature of etching process and time of etching are studied and investigated. Many characterization techniques such as scanning electron microscopy are used to characterize the properties of the resulted porous silicon. In addition, calculation of porosity percentage, porous layer growth rate and proportionality of etching rate with several parameters were carried out.
In particular, the open porous structure and the very large specific surface area make porous silica and silicon ideal candidates to host specific organic molecules (dyes, surfactants, polymers, etc.). Mesoporous silica co-assembled with dyes has been studied recently as a new generation of composite materials with sensing properties, as for pH sensing [8]. Oxidized porous silicon (OPS) is an inert and stable material; it can be used as host for dyes. PH-sensor can be easily prepared. By this way, a new family of sensors based on the optical detection of signals, can be obtained [9]. This paper reports the preparation and the preliminary characterization of a hybrid material formed with OPS and Congo Red (CR), as an acidic pH indicator. The impregnation method is described and studied by means of Fourier Transform Infrared Spectrophotometer.
2. Experimental Details
The etching vessel used in this study was made of glass and thermometer was fitted with the vessel to control the temperature and a magnetic stirrer was used to stir the etching solution. Silicon substrates, n-type, with (211) crystallographic orientation with diameter of 0.45 cm has been used. The cleaned silicon wafers were held vertically in the etching vessel, which contains the alkaline solution. The alkaline compound used in this study was 2 - 3 wt% KOH dissolved in ultrapure water. Isopropyl alcohol or n-propanol. IPA or n-propanol is used as a wetting agent in the concentration range of 5 - 15 vol%. The cleaning process was done by removing the damage on the surface of silicon substrate in 0.2M KOH solution and kept at 80˚C - 90˚C. The second step was to produce straight upright pyramids on a freshly prepared damage free surface. The composition of (KOH and IPA) or (KOH and n-propanol) and the temperature of the etching solution were varied in order to measure their effect on the etching rate of (211) crystallographic direction.
After applying a Teflon mask on one part of the wafer, the surface could be etched selectively. For each combination of the etching parameters, etch rate on (211) plane was performed by determination the weight of the selectively removed silicon layer. Finally, the wafers were washed by flowing deionized water. The shape and size of the pyramid and the morphology of pores were observed under SEM (Scanning electron microscopy, JEOLJSM5300). Studying the Pore Size Distribution (PSD) was carried out on cylindrical pores having nearly the same surface area as the polygonal pores. The morphological properties which include, surface morphology, layer thickness, pore diameter, pore shape, porosity and surface area have been measured using Scanning Electron Microscopy (SEM) to study the controlling parameters, which affect the etching rate of silicon wafer, (etching time, concentration of alkali solution and concentration of wetting agent).
The used samples were already oxidized due to the exposure to atmosphere. Congo Red; {sodium 3,3-[(1,1 biphenyl)-4,4_-diyl(azo)]bis(4-aminonaphtalenesulfonate), Direct Red 28–CI 22120}, is a diazo anionic dye known as pH indicator (colour change in the 3 - 5.2 pH interval), purchased by Sigma Aldrich. N,N-dimethylformamide (DMF) has been selected as solvent because the salt form of CR can be dissolved only in aprotic polar solvents. For the impregnation, solutions with concentration range 7 × 10⁻³ - 6 × 10⁻² M, i.e. widely below the solubility limit, have been used.
Homogeneously covered OPS surface was prepared by 10 µl/cm2 of solution, which deposited by a micro-pipit. The drying process must be slow and carefully controlled to ensure a homogeneous penetration of the dye along the pores; consequently it is carried out under a reduced pressure for about 4 h. The impregnation method is determined by FTIR (Fourier Transform Infrared Spectrophotometer-Shimadzu FTIR -8400 s, Japan).
3. Results and Discussion
Pores in silicon formed during the anisotropic etching in KOH solution depend on the concentration of KOH (as etching solution), concentration of wetting agent, temperature and time of etching process. In general, porous silicon formation is considered to result from inhomogeneous dissolution silicon surface due to competing reactions; silicon oxide formation followed by dissolution of the oxide. The equation of the overall process during the porous silicon (PS) formation can be exposed as follows: the porous silicon was formed in homogeneously mixed KOH/wetting agent at suitable etching temperature and time. The thickness of porous silicon layer depends on etching parameters especially on the etching time, since the layer thickness increases with increasing the etching time. Figures 1 and 2 show the suggested mechanism of chemical dissolution of silicon with comparison to that in acidic solution (HF). The dissolution of a surface silicon atom involves the replacement of the surface hydrogen atom by an OH− in KOH solutions and by F− in HF solutions. The difference between the hydrogen replacement by OH− and that by F− is whether holes are involved. In case of KOH, upon the hydrogen replacement by OH−, the silicon atom becomes a radical, which in the following reaction steps is neutralized by the reduction of hydrogen ions. In HF, the replacement of hydrogen by F− requires a hole, which results in a neutralized Si-F bonding. The valence state of the adsorbed hydrogen before and after the replacement, being zero, is not changed in both solutions. The important difference is that after being terminated by an OH− ion, the silicon atom is a radical with two extra electrons, while in Si-F termination the bonds associated with the silicon atom are neutralized.
The hydrogen adsorption onto a silicon atom is a reduction process since the valence of the hydrogen atom is changed from +1 to 0. It occurs when the backbone of Si-SiF or Si-SiOH is broken by reacting with H2O or HF. Transfer of one electron from the Si-OH bond to the hydrogen of the Si-H bond must then occur according to the process. An important feature of this process is that no carriers from the solid are involved and it is therefore a
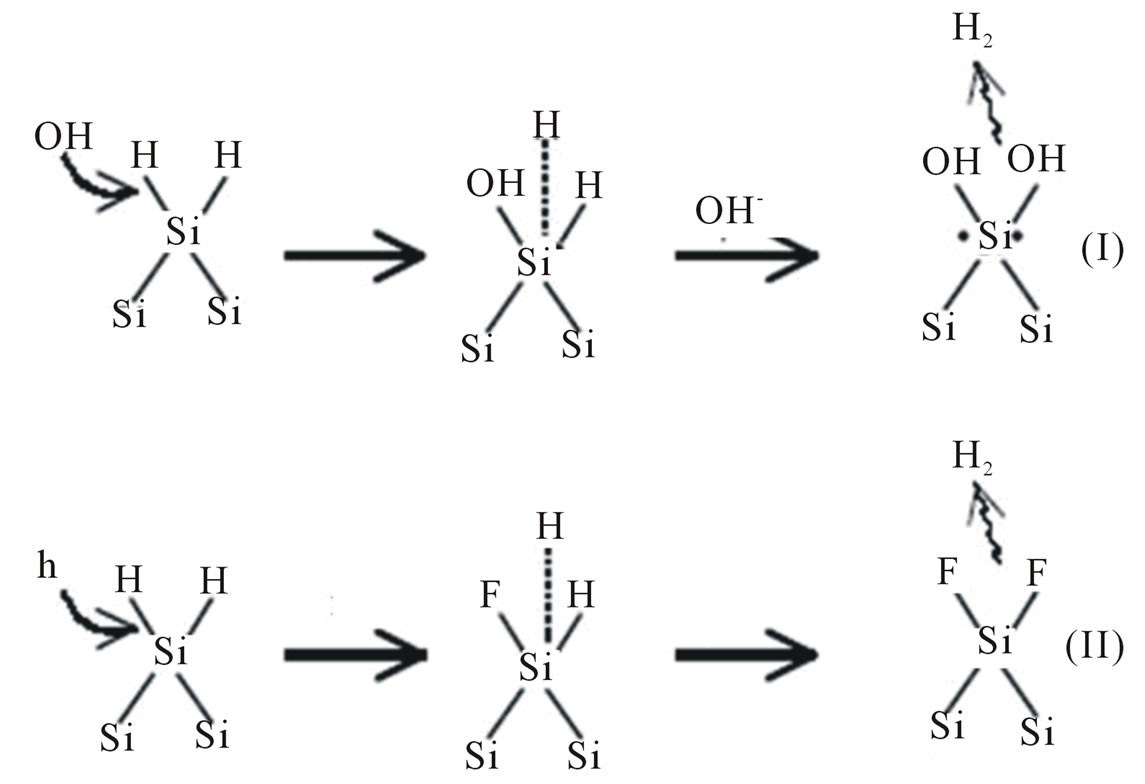
Figure 1. Elementary steps in the replacement of H by OH- or F−.
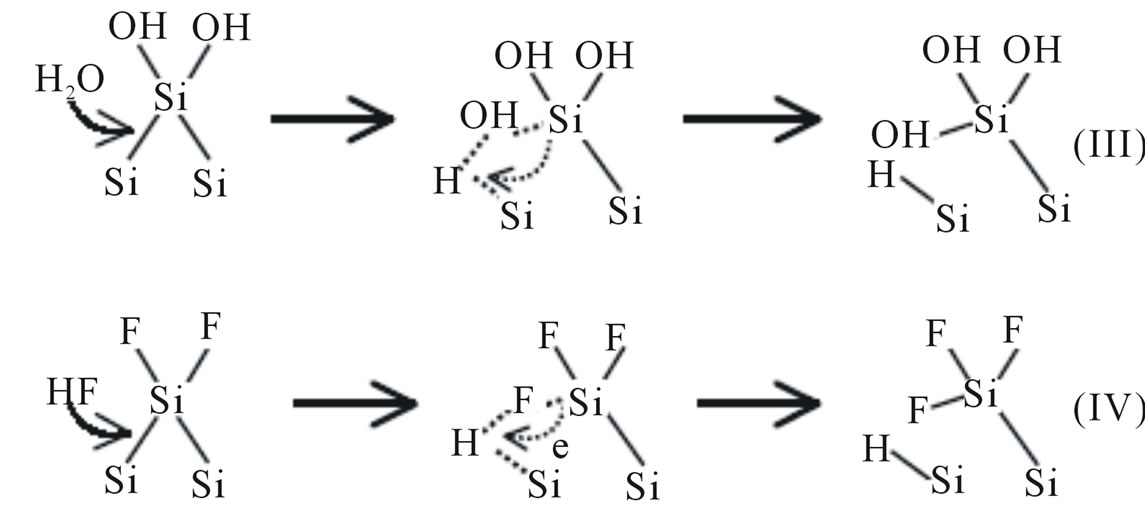
Figure 2. Elementary steps involved in the breaking of Si−Si backbond andtermination by hydrogen.
chemical reaction in nature. This is the key reaction step responsible for the chemical character of the dissolution process in which a hydrogen ion is reduced by an electron from the Si-Si bond. The breaking of the Si-Si backbone by any group other than HF and H2O does not preserve the local charge neutrality (the two specific atoms involved in the bonding) and has to involve carriers from the bulk. This could explain why hydrogen adsorption onto silicon does not occur easily by the dissociated hydrogen ions in the solution but rather by H2O or HF molecules through the attacking of the Si-Si backbone [10]. Therefore, OH− and H2O are the reactants involved in KOH solutions and F−, HF, and H2O are involved in HF solutions. OH− and F− are responsible for initiating the attack by replacing the adsorbed hydrogen atoms while H2O and HF are responsible for attacking the Si-Si backbone. The elementary steps involving these reactions can account for the essential features, that is, dynamic hydrogen termination of the silicon surface and breaking of the silicon backbone due to adsorption of fluoride or hydroxyl ions. The relative contributions of these processes in the reactions can then account for the variations in the effective dissolution valence and in the quantum efficiency under different conditions. An important aspect is that electronic carriers in the silicon semiconductor do not affect the chemical nature of the reactions so that the reactions shown above are the same on pand ntype of materials. The electronic carriers, however, affect the rate and the path of the reactions, as will be discussed in the next section.
3.1. Reaction Paths
Figure 3 shows the possible reaction schemes for the various situations involving silicon electrodes in HF and KOH solutions. These different paths can account for many details experimentally observed in the dissolution of silicon in HF and KOH. Figure 3 is also possible based on the elementary steps outlined in the previous section. The surface of the oxidized silicon layer is terminated by OH in KOH, but may be terminated by both OH and F in HF. In HF on the surface covered by an anodic oxide layer, adsorption of OH is required for the growth of the oxide, while adsorption of F is required for the dissolution of oxide. The Si-O-Si bonds are rather stable in KOH such that the dissolution rate in the passive region is very low. On the other hand, the Si-O-Si bonds are not stable in HF due to the attack by the fluoride species. A major difference between the reactions in the two solutions is that the hydrogen-replacing step in HF requires holes while in KOH it does not. Thus, it can be seen that in HF solutions the reaction rate is low, while in KOH solutions the rate of the dissolution reaction is high [10]. Because of the high concentration of OH− in KOH, the rate of reaction (3) shown in Figure 3 is high, but is very low in HF solutions due to the extremely low OH− concentration. This explains the low dissolution rate in HF and high rate in KOH. According to reactions (1) and (3) shown in Figure 3, the concentration of hydrogen ions in both solutions does not play direct role in the reaction processes. This is because the generation of adsorbed hydrogen, HSi, is independent of the concentration of hydrogen ions but on [HF] in HF solutions or [H2O] in KOH solutions. This explains why high dissolution rates are observed in KOH solutions, in which the concentration of hydrogen ions is extremely low [4].
3.2. Etching Rates in Various Systems
The two principal etching solution systems for silicon are HF and alkaline solutions. This is because silicon is inert in aqueous solutions due to the formation of an insoluble surface oxide except for HF or alkaline solution in which the oxide is soluble. Various chemical agents can be added into these two solutions to obtain a control on the etching rate, etch selectivity, solution stability, and quality of the etched surface. One major difference between these two systems is that the etching rate of silicon HF solutions is similar among the various crystalline orientations, that is, isotropic, while in alkaline solutions it is
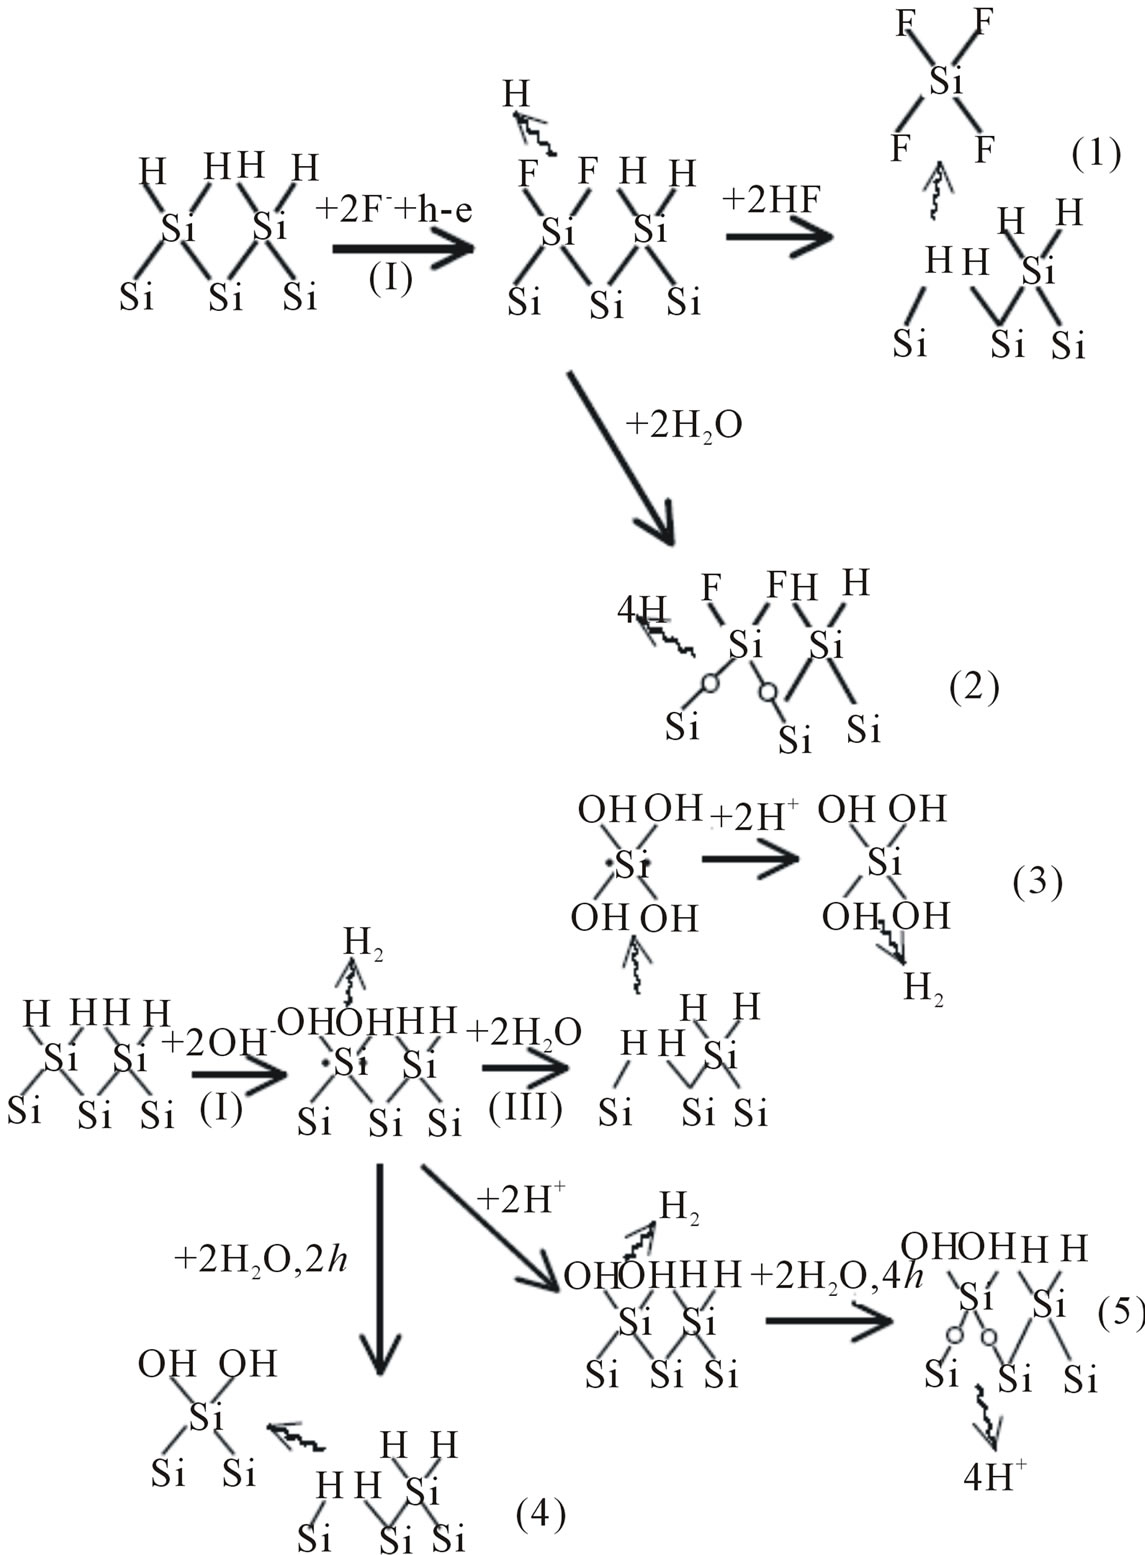
Figure 3. Possible reaction paths in HF solutions and possible reaction paths in KOH solutions.
strongly dependent on the crystalline orientation, that is, anisotropic. Another difference is that silicon oxide, which may be present on the silicon surface prior to or during the etching process, etches fast in HF solutions, while it etches very slowly in alkaline solutions relative to the etching rate of silicon.
We suggested the mechanism of interaction of wetting agents with a specific kind of sacrificial bonds, leading to adsorption of wetting agents molecules at these specific sites. In general, in Si (100), Si (110) and Si (211) planes, it is linked with sacrificial bonds denoted as C-C. It is generally accepted that hydroxyl ions form the etching solution play the major role in the etching processes. They substitute the surface terminating hydrogen atoms and catalyst by removal of surface atoms by weakening their back bonds.
Isopropanol (IPA) addition to KOH etchant resulted texturization of Si-wafer surface [7]. In case of n-propanol addition to KOH etchant resulted in remarkable improvement of porosity morphology of (100) surfaces, which is produced by transformation from Si (211) plane to Si (100) plane, more than IPA addition [7]. Then, the regularity of porosity in silicon samples as a result of using n-propanol replaced of IPA (as shown in Figure 4), because of the differences in mechanism of anisotropic
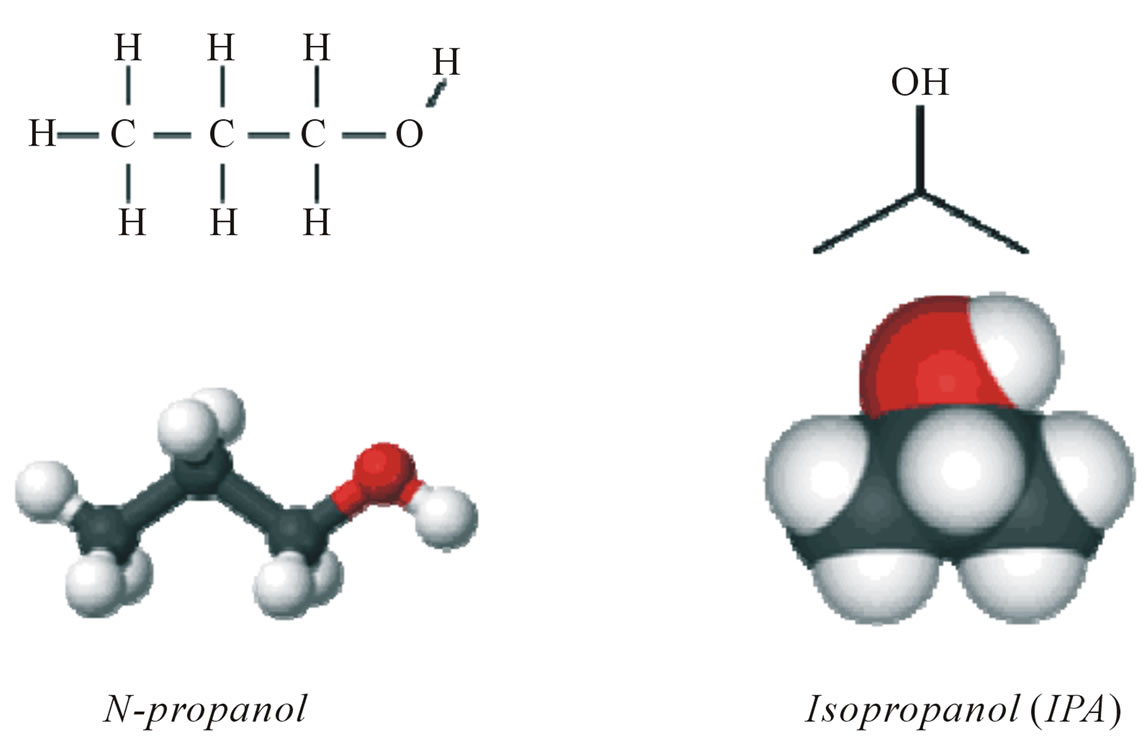
Figure 4. Chemical formula of n-propanol and IPA.
etching process of Si wafers.
Silicon could be etched at a wide range of rates; etching rate is specific to a given set of etching conditions. In addition to materials and solution conditions, the etching rate of silicon in a given system depends on many operational parameters such as size and geometry of the sample, concentrations of the etchant, type of wetting agent, concentration of wetting agent, and etching time (as shown in Figure 5). In IPA case, the etching rate reaches its maximum of 0.018 µm/min after about 60 min, then a plateau phase for about 20 minutes to decrease to about 0.012 µm/min after 120 min. The KOH concentration also affects the etching rate to reach its maximum of 0.018 mg/min for KOH concentration of 2 wt%. The wetting agent minimum effect for a concentration reaches of 10 vol% with an etching rate of 0.05 mg/min and also the maximum value of etching rate at 0.018 µm/min. On the other hand, using of n-propanol as wetting agent, the etching rate reaches its maximum of 0.012 µm/min after about 360 min. that maximum value is obtained after direct proportion and plateau phase for 60 min between 120 to 180 min. The KOH concentration also affects the etching rate to reach its maximum of 0.025 mg/min for KOH concentration of 2.5 wt%. The wetting agent is inversed proportion with etching rate. It reaches its maximum of 0.0075 mg/min at wetting agent concentration of 10 vol%. Noticeable, the maximum value of etching rate by using n-propanol is low compared with IPA counterpart.
The formation of porous silicon is anisotropic process, so devices may lie in any direction relative to the crystal orientation and structures have very well-defined geometries since etching stops obtained by differential doping offer excellent selectivity. Depending on the etching conditions, as shown in Figure 6, n-type material can be selectively etched, although the resulting pore structure is quite different [11]. Etching time also affects the porosity where porosity which increases with etching time due to increase voids between column and reach to constant value because of dissolution porous layer with etching time. Porous silicon consists of a network of nanometer sized silicon regions surrounded by void space. As shown in Figure 7, we notice the formation of two layers of porous silicon. The upper layer has lower porosity, while the deeper one has higher porosity (as shown in Table 1).
3.3. Pore Layer Thickness and Porosity
The thickness of porous silicon layer is varied according to illumination distribution and doping density as shown in table 2.The most common technique to measure and study the layer thickness of porous silicon material is (SEM) measurement: These measurements are very important to calculate and characterize the etching rates according to the following equation [3]:
where n, µm/min, is the growth rate, d, µm, is the layer thickness and t, min, is the etching time.
Thus we can control the parameters, which affect the percentage of the porosity. These factors are the type of wetting agent that is responsible for the rate of etching of Si-wafer surface, time of etching process, the concentration of etching solution, and the concentration of wetting agent.
The porous silicon material presents itself as crystalline silicon with structure contains crystals in nanoscale size [12]. This characteristic has an important effect on each property of porous silicon layer. The XRD patterns of Si (211) wafer before and after etching is shown in Figure 8. It has significant peak broadening, which can be interpreted as a nanocrystallite size effect [12]. The nanocrystalline size was calculated from the peak broadening, as shown in Table 3, using Rashed formula as follow [3]:
where L is the nanocrystalline size for porous silicon layer in nm, λ is the wavelength in nm of employed radiation, B (radians) is the full width half maximum (FWHM), θB (radian) is the diffraction angle and 0.9 is the value of shape factor.
The energy band gap of porous silicon layer can be calculated according on the size of crystals as follow [3]:

where  is the energy gap of porous silicon layer, Eg (eV) is the energy gap of bulk silicon and L (A°) is nanocrystallite size. It is noted that as the etching time increases from 4 to 6 hours, the particles size increases
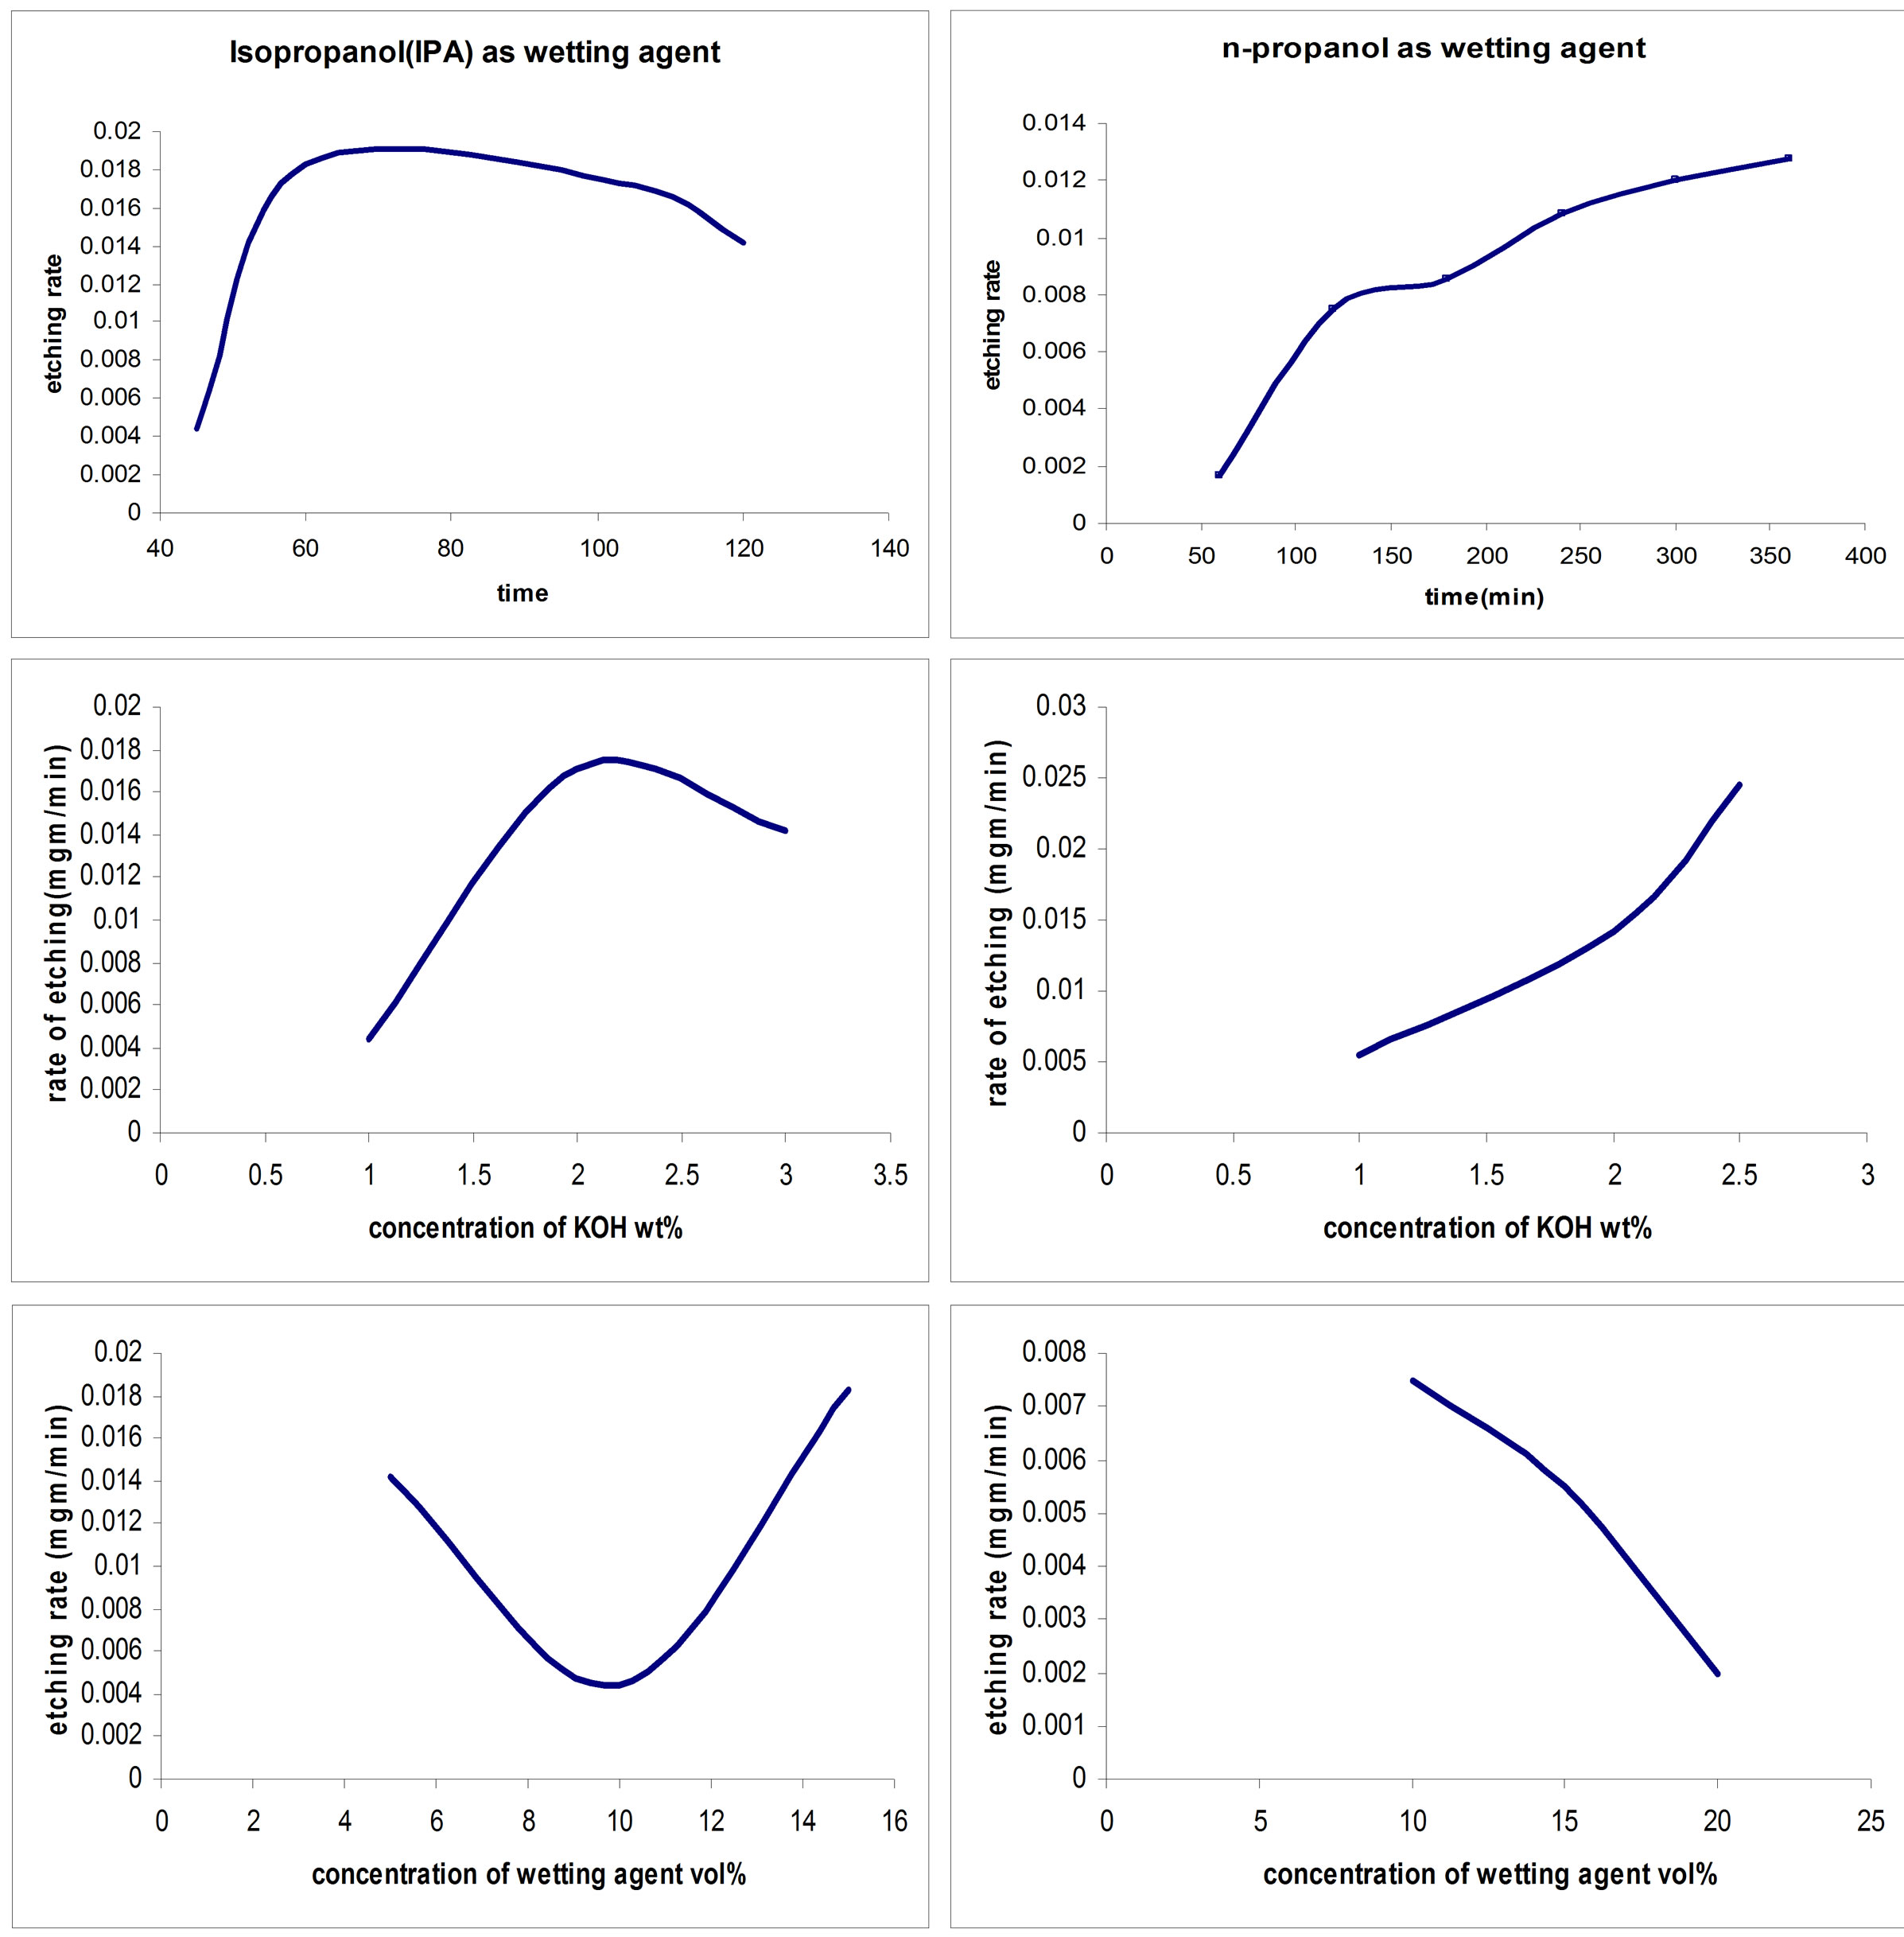
Figure 5. Etching rate by using different wetting agents (isopropanol, n-propanol).
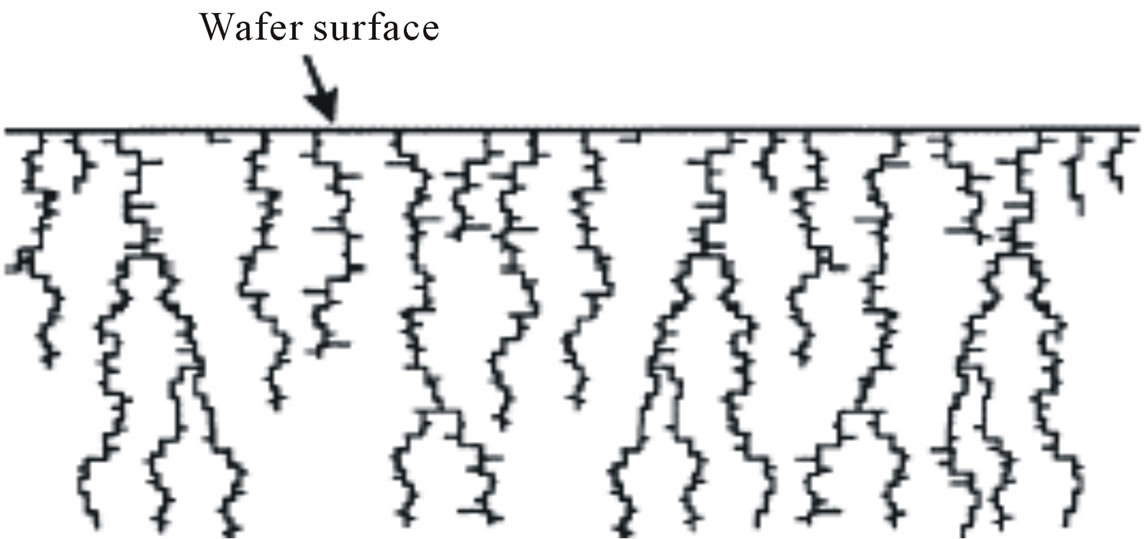
Figure 6. Structure of porous silicon in n-type material by anisotropic etching process.
from 14.8 to 21 nm and consequently the energy gap decreases from 3.3 to 2.5 eV.
The differences in porosity and pores size distribution between the adjacent layers do not affect the distribution of the dye. This could suggest that the diffusion of the guest molecules is influenced by weak interactions (Van der Waals and hydrogen bonds) with the inner surface due to the presence of polar species (OH and Si-O-Si groups) after oxidation. The effect of changing the concentration of Congo red dye, which is attached to oxidized porous silicon surface for formation PH sensor: As shown in Figure 9, no change in the FTIR spectra peaks for other bonds than sulfonate group by changing the concentration of Congo red dye. Thus, sulfonate group is the only responsible for attachment on porous silicon surface.
Despite the low amount of CR, a dependency of waveguide efficiency upon the kind of vapours has been observed. HCl strongly reduces the amount of the transmitted light and CR/OPS sample converts to blue color. Exposure to NH3 restores the initial condition behavior of CR/OPS is reversible. This hybrid system is currently working as an ON/OFF switch. It has a good reproducibility of exposures to HCl and NH3. After cycles of exposures, the performance of the material are reduced because of the formation of NH4Cl that probably hampers the diffusion of vapours in the pores.
4. Conclusions
The present work is a study of the preparation of PS lay-
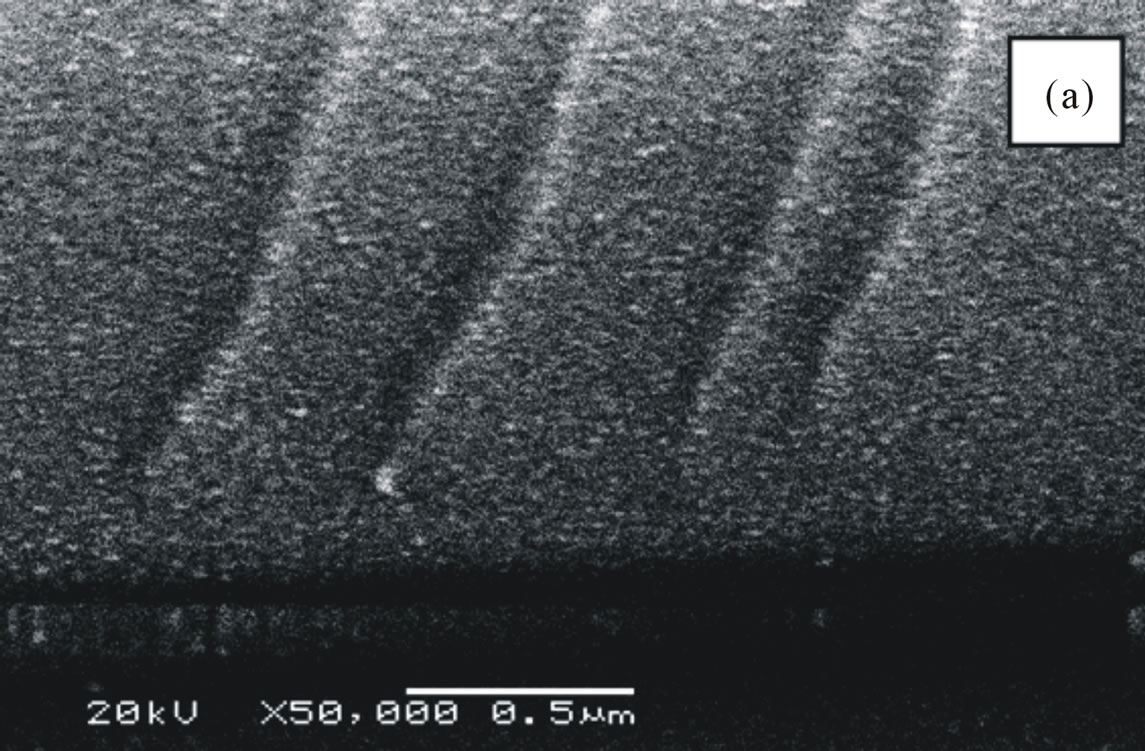

Figure 7. SEM images (cross-section) of Si(100) wafers, (a) Magnification 50000, the upper layer, lower porosity and (b) Magnification 50000, the deeper layer , higher porosity.
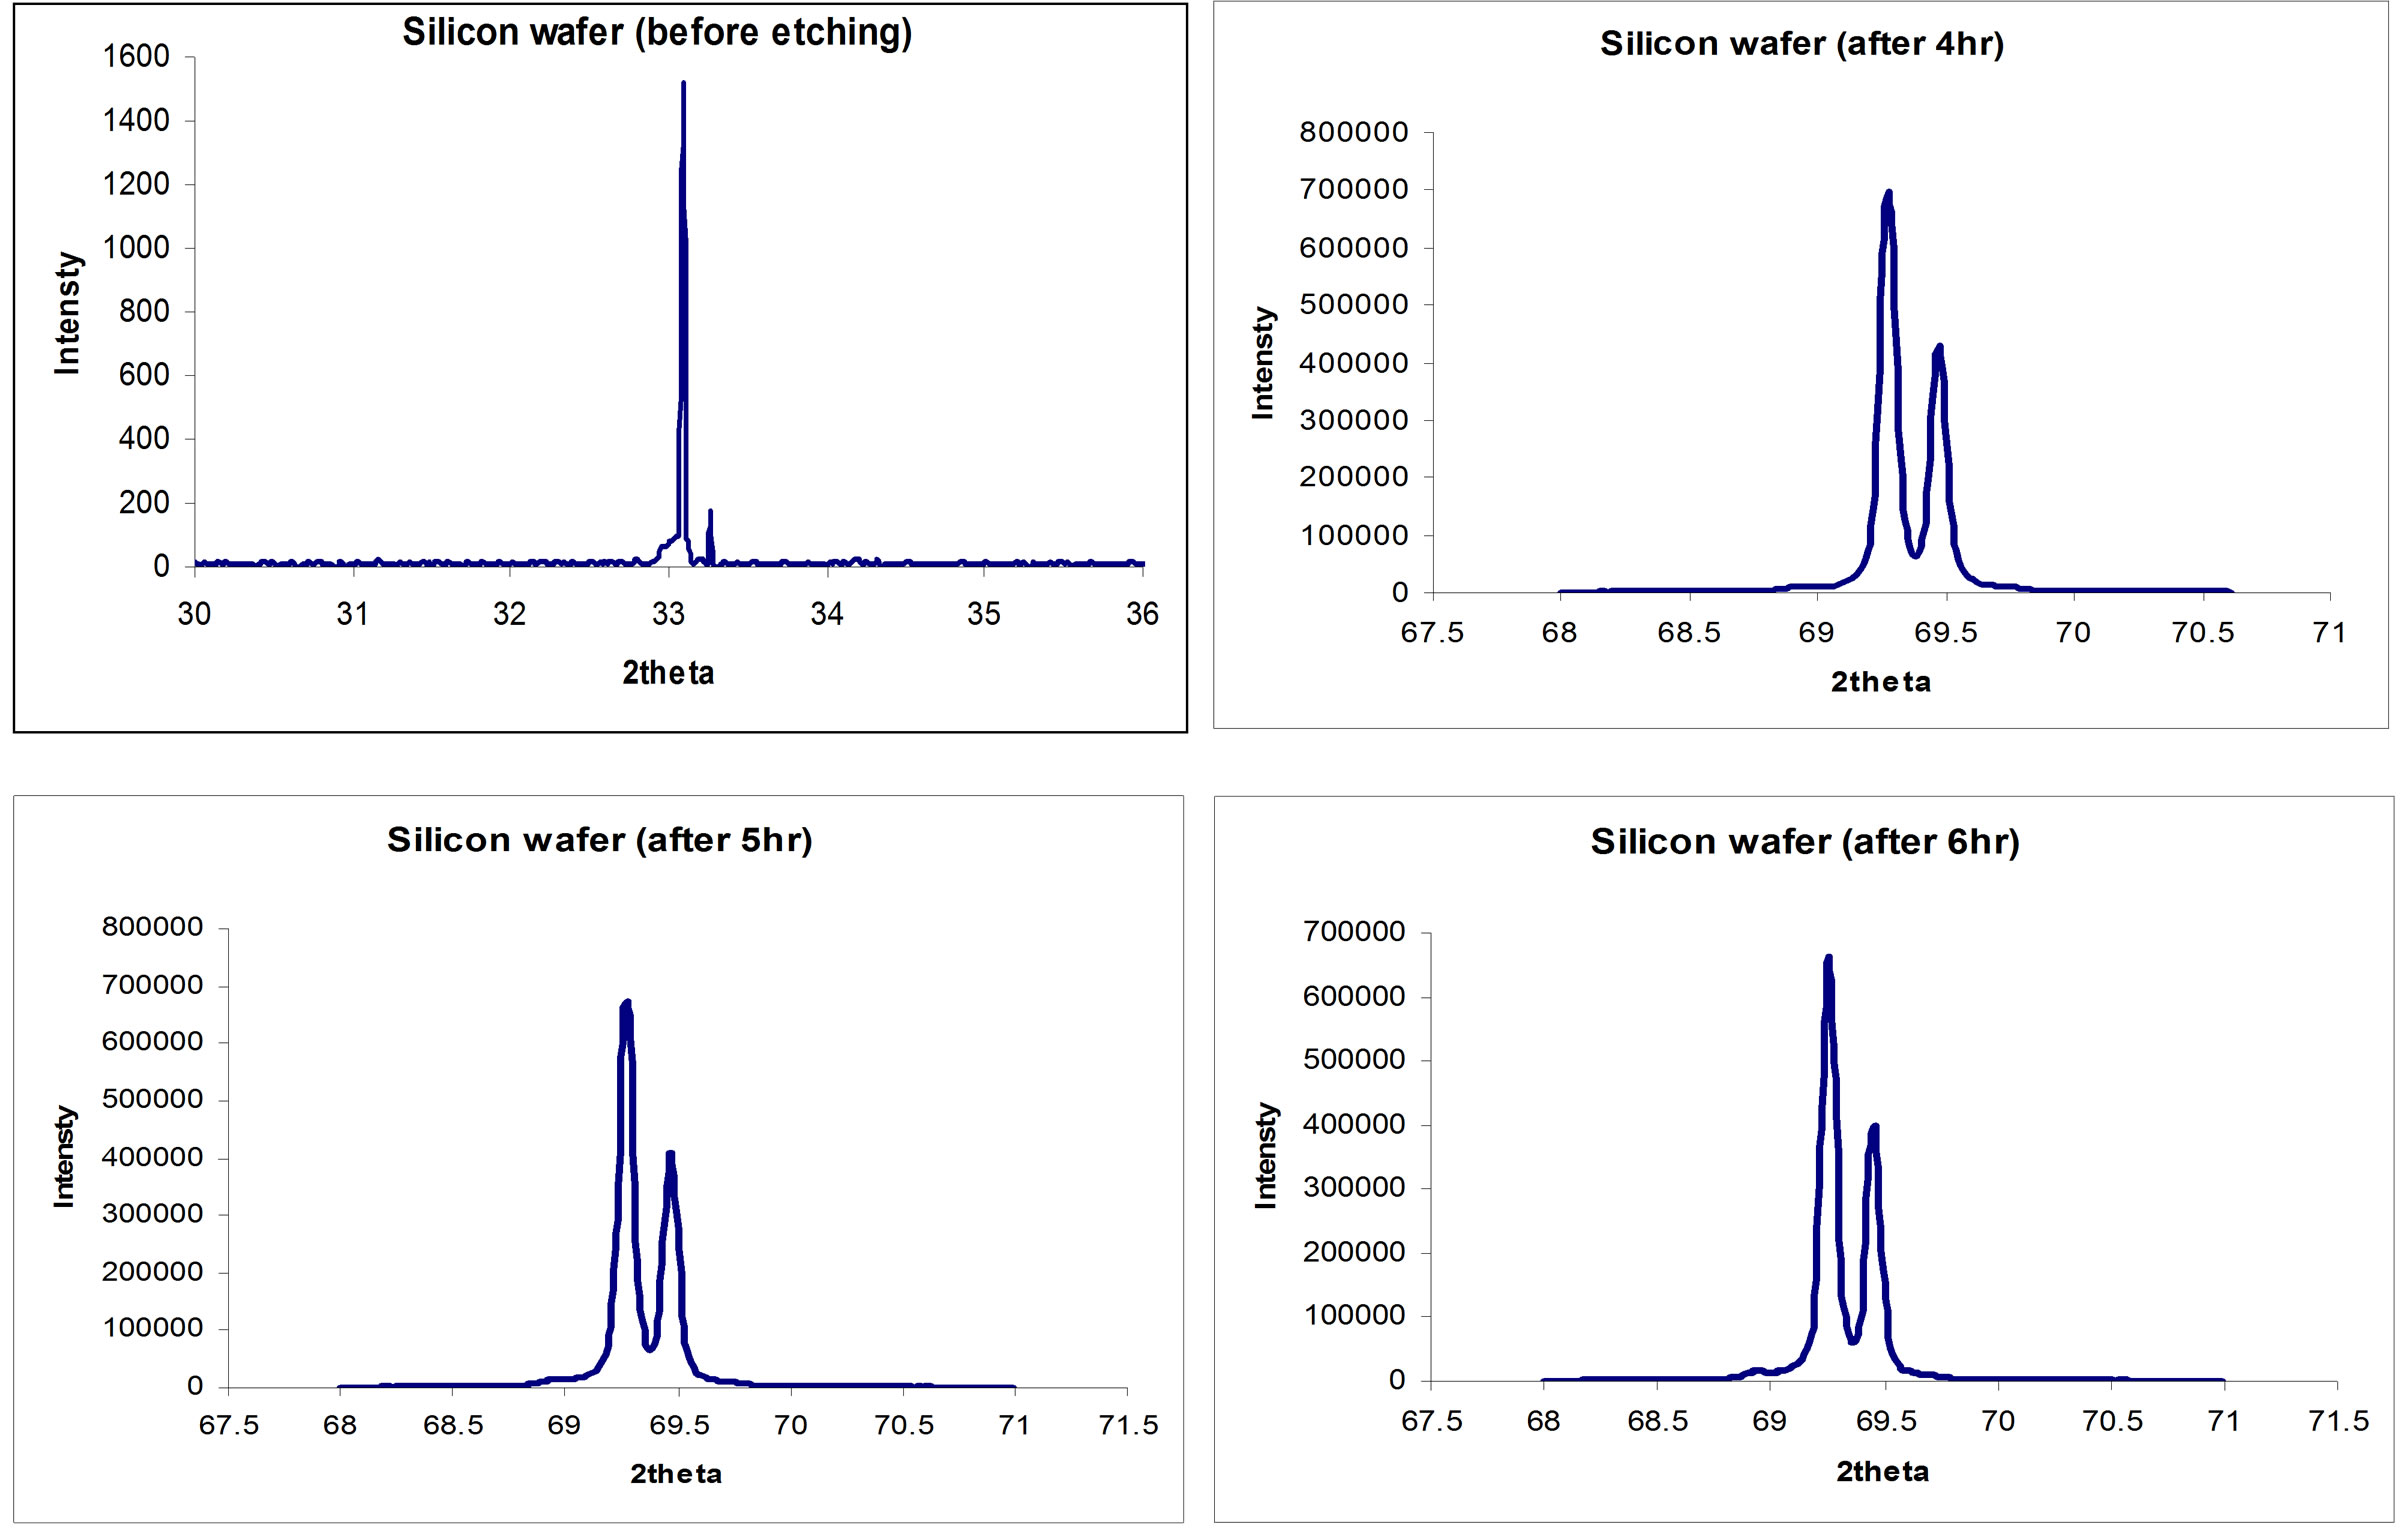
Figure 8. XRD Patterns of Si(211) wafer; (a) Before Wet-etching; (b) After 4 hrs of Wet-etching, (c) After 5 hrs and (d) After 6 hrs.
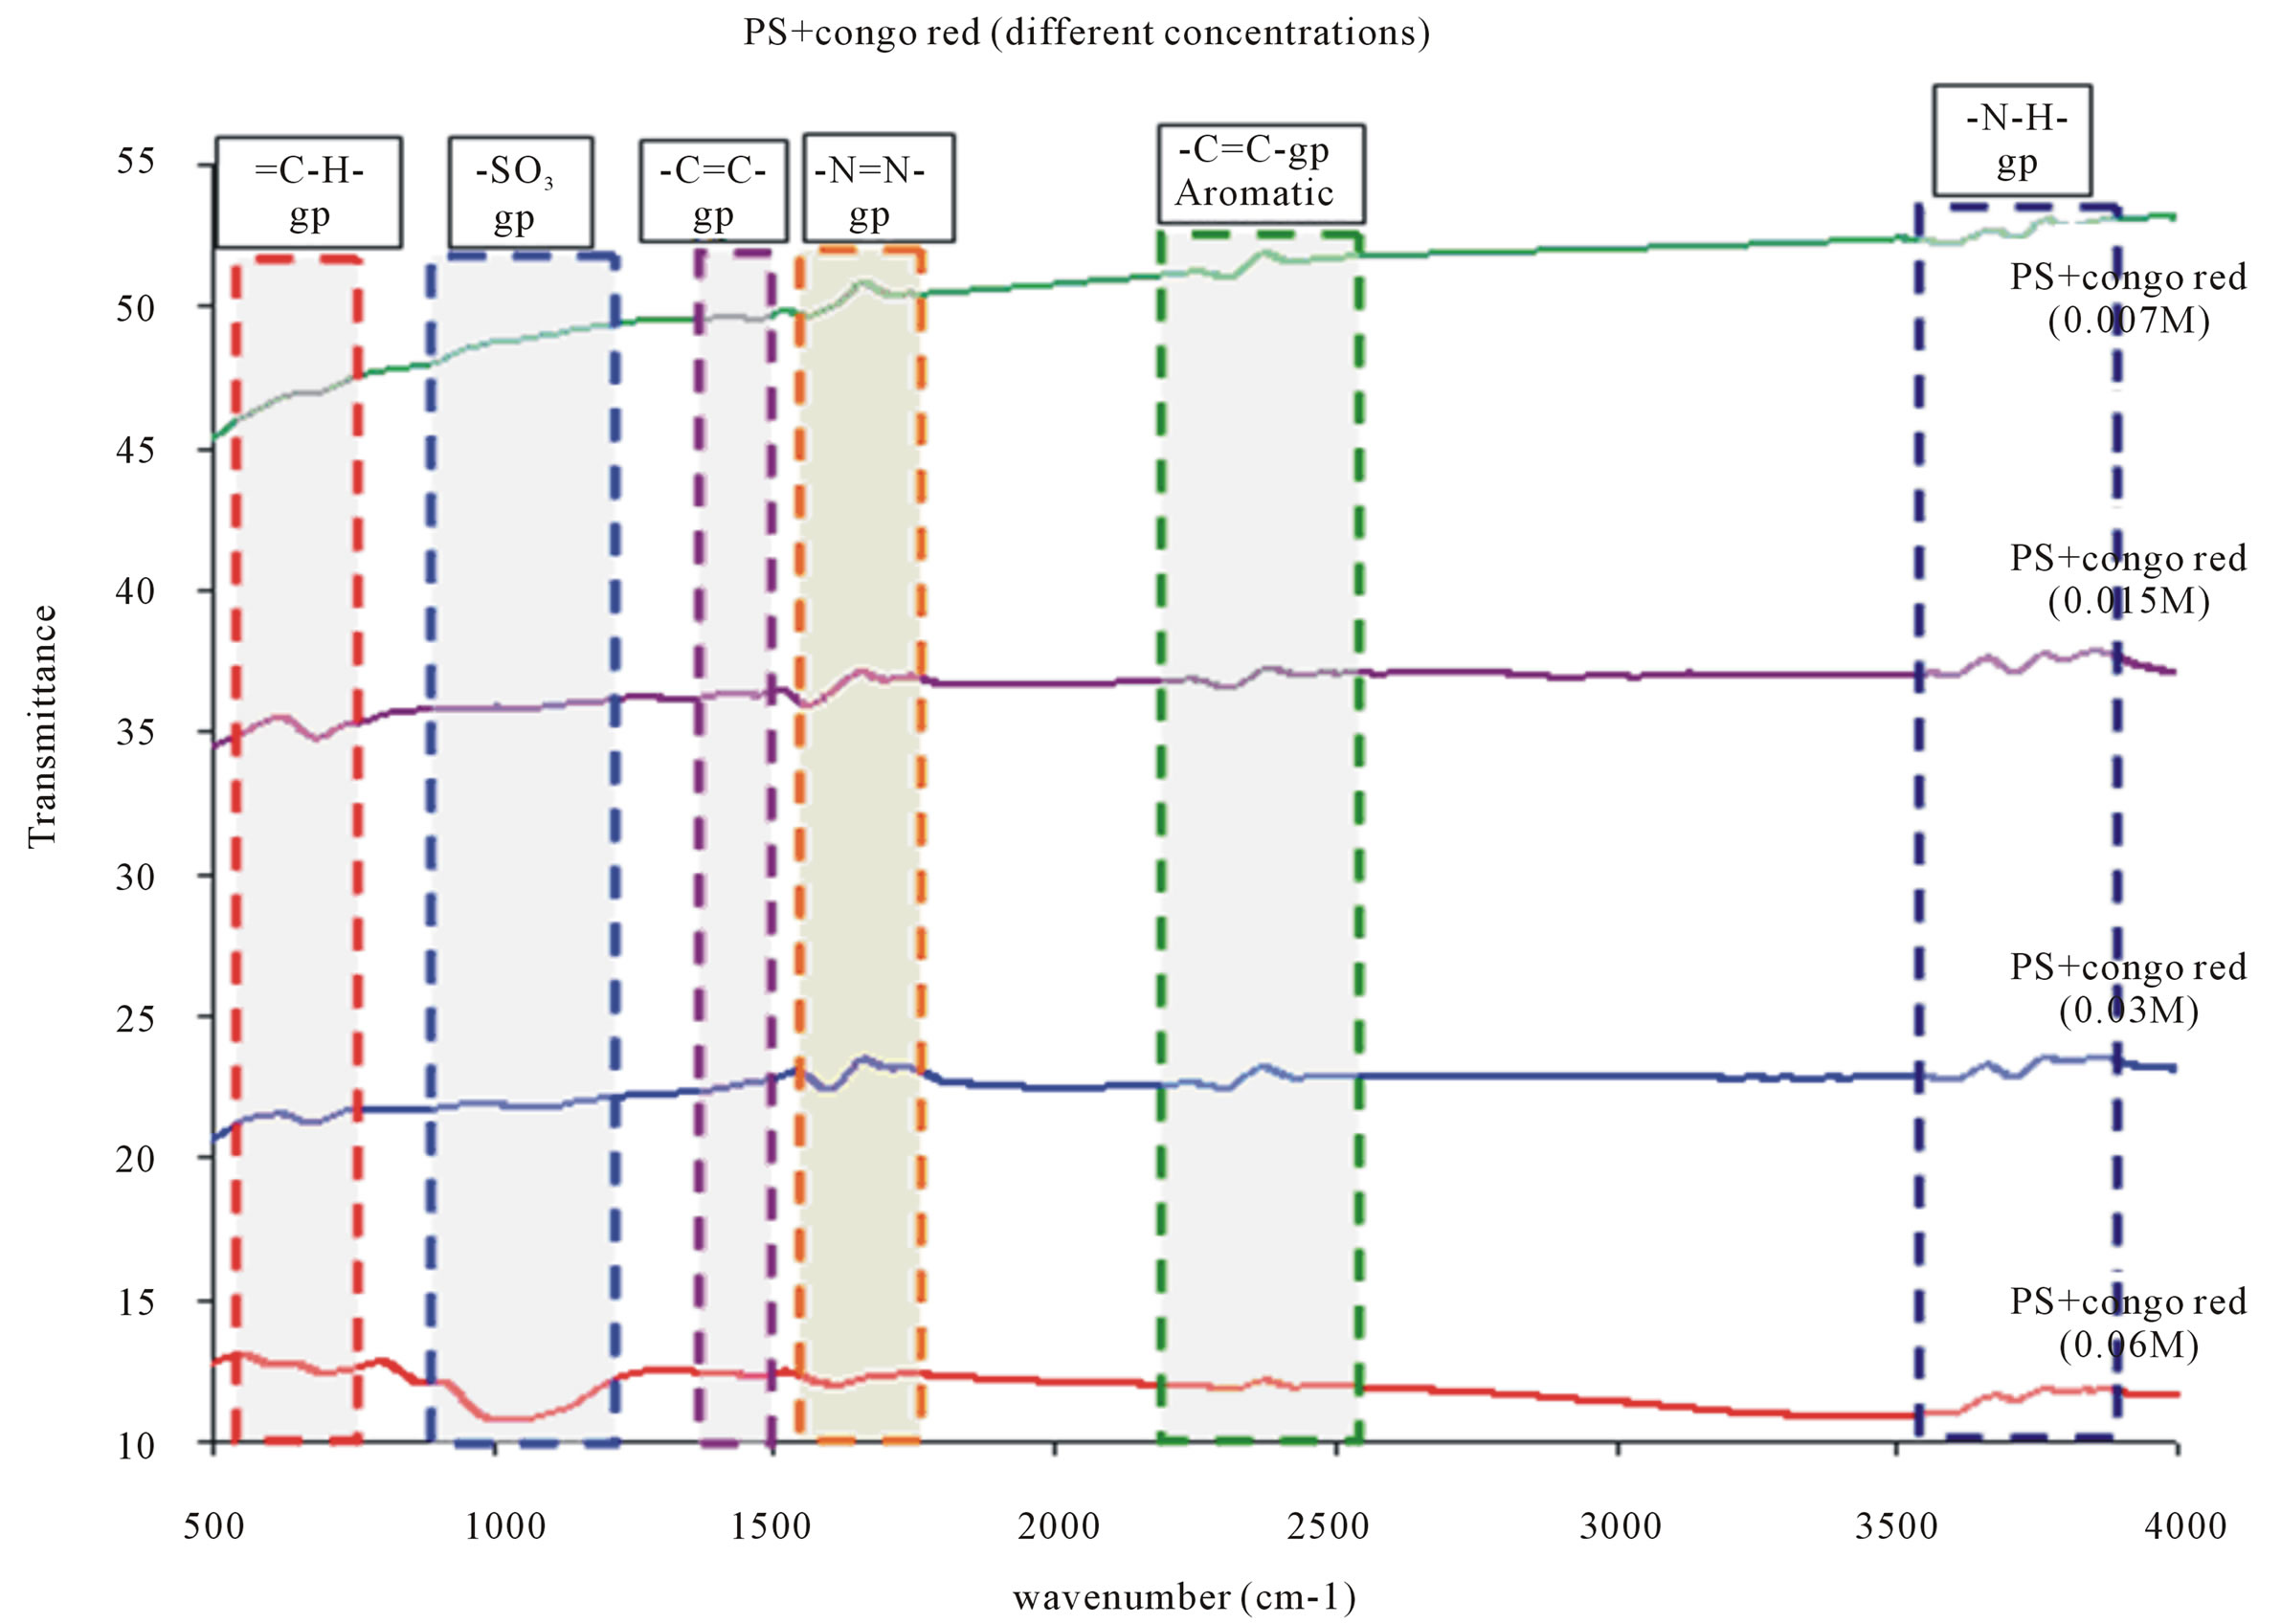
Figure 9. FTIR Patterns of OPS (100)-CR; at different CR concentrations {0.007, 0.015, 0.03 and 0.06 M}.

Table 1. Porosity percentage of 2 porous layers of silicon.
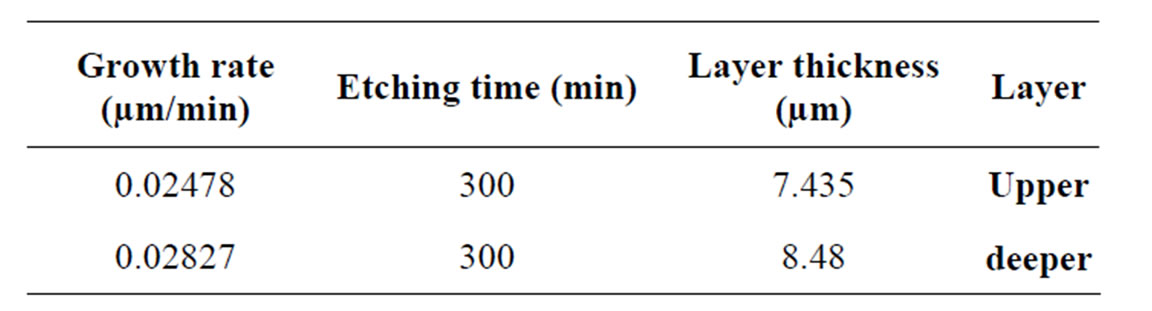
Table 2. Growth rate of 2 porous layers of silicon.
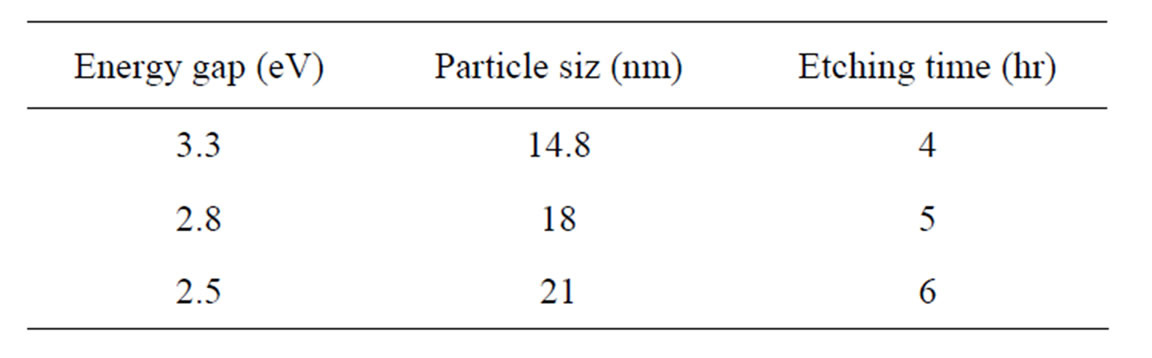
Table 3. Particle size and energy gap values of porous silicon at different etching time.
ers on crystalline silicon wafers and with discussing the results of the obtained samples. The process of chemical etching process was monitored considering the effect of concentration of alkaline etching solution, type and concentration of wetting agent, temperature and time of etching process.
The rate of pore formation is (0.02478 - 0.02827) µm/ min and the particle size of PS is 15 nm. Porosity of PS layers is about 10%. Pore diameter and the porous layer thickness are 0.0614 and 16 µm, respectively. The energy gap of the produced porous silicon is 3.3 eV.
An impregnation procedure for the preparation of CR/OPS composite materials has been developed. As shown by FTIR spectra, this process yields a homogeneous distribution of Congo Red along the pores. CR pH indicator properties are retained in the CR/OPS single and double layers. With low CR concentration, the guiding properties are retained. Notwithstanding the low amount of dye, HCl vapours cause a remarkable transformation of color to blue. This behaviour is reversible after exposure to NH3 vapours. The ON/OFF behaviour of the composite material depends upon the chemical processes occurring inside the pores.
REFERENCES
- Z. Swiatek, E. Betawska, W. Maziarz and F. Krak, “Characterization and Properties of a Modified Si Solar Cell Emitter by a Porous Si Layer,” Material Science and Engineering B, Vol. 101, No. 1-3, 2003, pp. 291-296. doi:10.1016/S0921-5107(02)00718-3
- P. Panek, M. Lipinski and J. Dutkiewicz, “Texturization of Multicrystalline Silicon by Wet Chemical Etching for Silicon Solar Cells,” Journal of Materials Science, Vol. 40, 2005, pp. 1459-1463. doi:10.1007/s10853-005-0583-1
- M. Q. Zayer, “Studying the Effects of Annealing Process on the Structural, Optical and Electrical Properties of Porous Silicon,” M.S. Thesis, University of Technology, Iraq, 2010.
- X. G. Zhang, “Encyclopedia of Electrochemistry,” Teck Cominco Metals Ltd., Canada, 2007.
- H. Foll, M. Christophersen, J. Corstenson and G. Hasse, “Formation and Application of Porous Silicon,” Materials Science and Engineering R, Vol. 280, No. 4, 2002, pp. 1- 49.
- L. T. Canham, “Properties of Porous Silicon,” Inspec, England, 1998.
- A. E. H. Kashyout, H. M. A. Soliman, M. Nabil and A. A. Bishara, “Fabrication of Nano-Porous Silicon Using Alkali Etching Process,” Materials Letters, Vol. 100, 2013, pp. 184-187. doi:10.1016/j.matlet.2012.12.107
- P. Rivolo, P. Pirasteh, A. Chaillou, P. Joubert, M. Kloul, J.-F. Bardeau and F. Geobaldo, “Oxidised Porous Silicon Impregnated with Congo Red for Chemical Sensoring Applications,” Sensors and Actuators B, Vol. 100, No. 1-2, 2004, pp. 99-102. doi:10.1016/j.snb.2003.12.029
- P. Pirasteh, J. Charrier, Y. Dumeige, A. Chaillou, M. Guendouz and L. Haji, “Study of Porous Silicon Optical Waveguides Impregnated with Organic Dyes,” Applied Surface Science, Vol. 253, No. 7, 2007, pp. 3440-3443. doi:10.1016/j.apsusc.2006.07.047
- W. Kolasinski, “Etching of Silicon in Fluoride Solutions,” Surface Science, Vol. 603, No. 10-12, 2009, pp. 1904- 1911. doi:10.1016/j.susc.2008.08.031
- T. E. Belly, P. T. J. Gennissenz, D. DeMunterz and M. Kuhl, “Porous Silicon as a Sacrificial Material,” Journal Micromechanical Microengineering, Vol. 6, No. 4, 1996, pp. 361-369. doi:10.1088/0960-1317/6/4/002
- Z. X. Zhao, R. Q. Cui, F. Y. Meng, B. C. Zhao, H. C. Yu and Z. B. Zhou, “Nanocrystalline Silicon Thin Films Prepared by RF Sputtering at Low Temperature and Heterojunction Solar Cell,” Materials Letters, Vol. 58, No. 30, 2004, pp. 3963-3966. doi:10.1016/j.matlet.2004.09.004