Journal of Modern Physics
Vol.5 No.5(2014), Article ID:44305,10 pages DOI:10.4236/jmp.2014.55036
Synthesis and Characterization of CdS, ZnS and CdZnS Nanoparticles Embedded in Polystyrene
Olumide Oluwole Akinwunmiwang#_s:sup1, Gabriel O. Egharevba2, Ezekiel Oladele Bolarinwa Ajayi1
1Department of Physics, Obafemi Awolowo University, Ile-Ife, Nigeria
2Department of Chemistry, Obafemi Awolowo University, Ile-Ife, Nigeria
Email: eajayi@oauife.edu.ng
Copyright © 2014 by authors and Scientific Research Publishing Inc.
This work is licensed under the Creative Commons Attribution International License (CC BY).
http://creativecommons.org/licenses/by/4.0/


Received 16 October 2013; revised 18 November 2013; accepted 15 December 2013
ABSTRACT
The nano dispersions (colloids) of Cadmium Sulfide, Zinc Sulfide and Cadmium Zinc Sulfide were prepared by modified metathesis reaction between CdCl2, ZnCl2 and Na2S. The prepared sulfides were embedded in polystyrene to form nano-composites. The size, morphology and composition of the nanoparticles on the surface of the composites were examined by using UV/VIS Spectroscopy, Scanning Electron Microscopy (SEM), High Resolution Transmission Electron Microscopy (HRTEM), Energy Dispersive Spectroscopy (EDS) and Particle Induced X-ray Emission (PIXE). The UV-spectrum shows a shift in the band gap towards high energy while the High Resolution Transmission Electron Microscope (HRTEM) analysis shows well resolved nanoparticles with particle sizes between 2-10 nm. The SEM shows that the nanoparticles are in form of nano clusters. The blue shift of the absorption band makes it possible to evaluate the size of the nanocrystallites, which is in agreement with that obtained from HRTEM. The composition as revealed by the EDS shows that the ratios of Cd:S, Zn:S and Cd:Zn:S are approximately 23:20, 58:42 and 32:35:33, respectively. The PIXE spectra confirmed the presence of expected elements and also reveal the presence of impurities.
Keywords:Nano-Particle; Nano-Composite

1. Introduction
In recent time, there has been great drive in the synthesis and characterization of monodispersed nano particles of II - IV compounds. This is because the optical, electronic and thermodynamic properties of particles in the nano meter range often differ from those of bulk material due to quantum confinement [1] [2] . These unique properties can give rise to interesting linear and nonlinear optical properties, which have great potentials in technological applications, such as optoelectronic [3] -[7] , probes for irregular DNA structures [8] , fluorescence probe in peptides [9] etc.
The control of the particle size can be used to prepare materials with unique properties to meet these needs. However, there is a problem associated with the growth of the particle size with time. One of the ways of overcoming this problem is the development of nanoparticle-polymer composite materials [10] -[12] . One such approach is to embed the particles in a suitable host to form nanocomposites [13] -[15] . Hence, the particle can also be grown directly in a host with desirable properties [16] [17] . The use of polymers as host materials is to stabilize the nanoparticles and prevent permanent aggregation and this has attracted a lot of attention because of their long-term stability and easy of reprocessability.
These inorganic-organic nano particles with tailored physical properties have potential application in the fields of molecular level electronic and photovoltaic devices [18] [19] , catalysis, molecular diagnostics and interfacial electron transfer [20] .
Different methods such as spincasting [21] , guest-host pairs [22] , laser ablation [23] [24] , ionic diffusion [25] , Solvothermal synthesis [26] , vapor liquid solid (VLS) growth [27] [28] , vapour-solid (VS) reaction [29] , hard template [30] , gamma irradiation [31] and reverse micelles [32] have been employed to synthesize mono-dispersed II - IV semiconductor nanoparticles.
In this study we report the synthesis of CdS, ZnS and CdZnS nanoparticles embedded in the solution of polystyrene.
2. Experimental
Sample Preparation
CdS, ZnS and CdZnS nano composites were prepared by the modified metathesis reaction between CdCl2, ZnCl2 and Na2S as reported previously by Brent et al. [33] .
Nano particles composites were synthesized from Na2S and metal chlorides in a fume cupboard at room temperature. The metal chlorides and Na2S were dissolved in methanol to form a methanolic solution (7.4 mM concentration). Equal-molar amounts of the methanolic solution of the reagents (metal chlorides and Na2S) were added to pyridine drop wise simultaneously. The reaction proceeded forming a yellow solution and precipitating the nanocrystalline product. The nanocrystals were then centrifuge and decanted. The soluble byproduct, NaCI, was removed by continually dissolving the product in methanol and isolating the particles after centrifugation and decanting. The obtained nanocrystals were thereafter dissolved in pyridine and precipitated by the addition of hexane. It was again isolated by centrifugation and decanting. Finally, the nanocrystals were re-dissolved in pyridine and embedded in polystyrene solution thereby immobilizing and preventing coagulation.
The optical spectrum was obtained using Ultrospec 2100 pro UV-Visible Spectrophotometer with wave length from 300 nm to 900 nm and the optical bang gap and the particle size were deduced.
The composition of the nanoparticles was obtained using Stereoscan 430i leica scanning electron microscopy attached with energy disperse X-ray cathode voltage 20 kv, 15 kv and beam aperture 25 mm, 18 mm. The sample was coated with gold to reduce charging effect.
Particle induced X-ray emission (PIXE) with a proton beam 3 MeV energy and current maintained at 100 pA was also used to determine the elemental analysis of the nano-particle. The beam was focused on 1 × 1 um2 spot and raster scanned over the sample area with 10 ms dwell time. Data were collected using XSYS data acquisition in a list mode. GeoPixe II software [34] was used for further data processing.
The morphology of the prepared CdS nano composite was examined using High resolution transmission electron microscopy (HRTEM) (Jeol 2010 High resolution transmission electron microscope).
3. Results and Discussion
3.1. CdS Systems
(1) Optical Absorption
The UV-VIS spectrum of the CdS nanocomposite is shown in Figure 1. It shows a single, sharp absorption
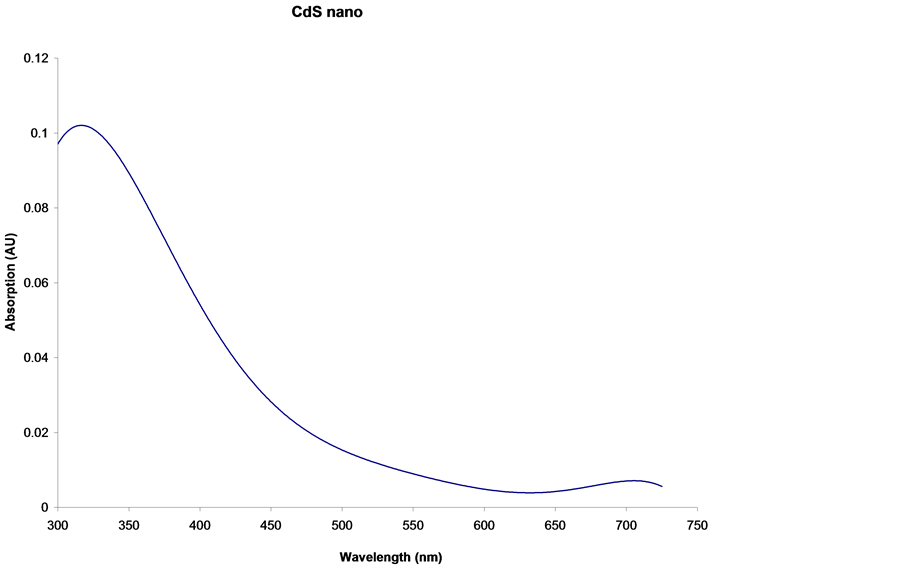
Figure 1. UV-vis absorption spectrum CdS Nano composite.
edge at 482 nm, which corresponds to the quantum shifted excitonic absorption energy in the nano compositeCdS. The graph of the absorbance against energy (hν) was plotted and the energy gap Eg was obtained by extrapolating the straight line path to the energy axis. The value obtained was 2.57 eV (482 nm).
This shows that there is shift to higher energy when compared with band gap of thin film. This quantum effect has been observed for most semiconductor materials [35] [36] .
The average nano particle radius (R) was determined from the difference in the energy band gap of the nanoparticles and the bulk crystal of CdS using the following equation [37] .
 (1)
(1)
where h is the Planck’s Constant
 are the effective masses of the electrons and hole in CdS
[38] . ΔEg is difference between the energy band gap of the nanoparticle and the bulk crystal. The particle radius was found to be 7.3 nm. The obtained particle size is similar to the value obtained Stroyuk et al. [39] .
(2) Compositional Analysis
The energy dispersive x-ray (EDS) spectrum (Figure 2) shows the presence of Cd, S, Na, Cl, and C, the presence of sodium and chlorine may be attributed to NaCl which were incorporated during synthesis. The stoichiometric ratio of Cd to S is found to be Cd23S20. The observed ratio is in agreement with that reported by Favero et al. [40] . This shows that the surface atoms tend to migrate to the sub-surface layer i.e. the nanoparticles are sulphur terminated [40] . This also agrees with the work of Winkler and coworkers [41] .
The PIXE analysis (Figure 3) also shows the elemental composition of the composite. It confirms the presence of expected Cd and S. It also reveals a lot of impurities that hitherto were not revealed by the EDS.
These impurities in some cases could be advantageous depending on the application. They could be an active or quenching center. For example the presence of Manganese as impurity in CdS is known to have effect on the optical properties especially as it relates to the photoluminescence properties of the nanoparticles. The EDS limitation may be due to continuous bremsstrahlung background caused by primary and secondary radiation. However, the stoichiometric ratio of Cd to S could not be determined.
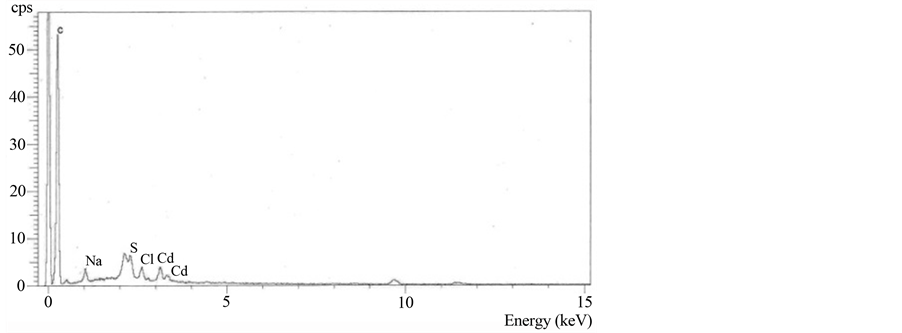
Figure 2. EDS Spectrum of the CdS nanoparticle composite.
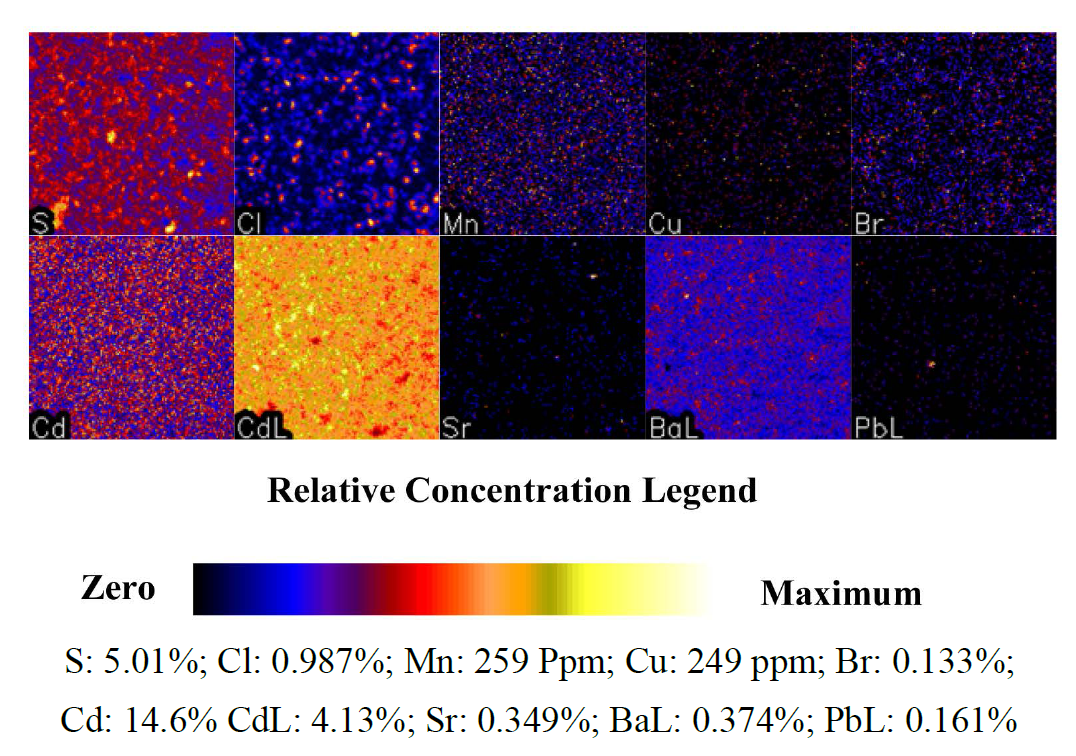
Figure 3. PIXE micrograph of CdS composites.
(3) Structural/Morphology
The HRTEM micrograph of the nanocomposite (Figure 4) clearly shows the presence of the nanoparticles which are well dispersed as individual entities (completely capped) and the particle size are between 2 - 10 nm. The mean sizes of the CdS nanoparticles determined from HRTEM approached those estimated from the UV absorption threshold. The micrograph of the SEM (not shown) also reveals the presence of the nanocomposite, however, the CdS nanoparticles appear in form of a cluster and the particles sizes are not well resolve. This may be due to resolution limit of the SEM used.
3.2. Zinc Sulphide System
(1) Optical Absorption
The room temperature UV-Vis absorption spectrum of the ZnS composite is shown in Figure 5. The extrapolation of the straight line region of the plot of the absorbance against wavelength to zero shows that the absorption edge occurs at 325 nm which corresponds to energy of 3.82 eV. This when compared with bulk ZnS with energy band gap of 3.65 eV (340 nm), the absorption spectrum of the ZnS composite (325 nm) showed a blue shift towards high energy, indicating that the ZnS nanocomposites were quantum-confined.
The average nano particle radius (R) was also determined from difference in the energy band gap of the nanoparticles and the bulk crystal of ZnS using Equation (1). The effective masses of the electrons and hole of ZnS are 0.22 me and 0.23 me respectively [42] [43] . The particle radius was calculated and found to be 8.88 nm.
(2) Compositional Analysis
The EDS (energy dispersive X-ray) spectrum of the products revealed that the nanocomposite comprised of Zn, S and other impurities. The impurities are sodium and chlorine which were incorporated during the synthesis

Figure 4. HRTEM micrograph of CdS nano composite.
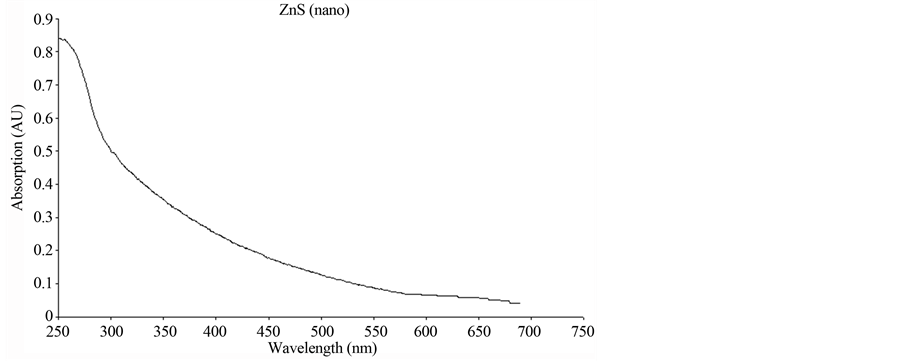
Figure 5. UV-vis absorption spectrum of ZnS Nano composite.
process. Elemental analysis reveals the atomic percentages of Zn and S are 58.3% and 41.7% respectively, which suggests S vacancies in ZnS nanocomposite. This quite agrees with what was reported by Yue et al. [44] .
The PIXE micrograph of ZnS is shown in Figure 6. It shows the elemental composition of the composite and relative concentration of the element present. It confirmed the presence of Zn, S as well as other impurities to the level of part per million. Majorities of the impurities were Na, Cl. This may be due to by-product (NaCl) formed in the as prepared nanocomposites [45] . The presence of carbon was also confirmed which stem from the binder. Other impurities present were Mn, Ni, Cu, Fe, Mo, Sr and Ba. As shown in Figure 6 these impurities might have their origin in the starting material.
wang#title3_4:sp(3) Structural/Morphology
The SEM micrograph of ZnS composite taken under 975× magnifications is shown in Figure 7. The micrograph shows that the composite are in form of clusters, hence, the grain size could not be determined. The average cluster size is less than 20 µm. This implies that the growth of the composite is mostly considered to be the result of the surface aggregation of colloidal particles (cluster-by-cluster growth) [46] [47] . The single nanocrystal cannot be clearly resolved due to the system resolution limit, but the presence of small nanocluster is apparent.
3.3. Cadmium Zinc Sulphide System
(1) Optical Absorption
The plot of the absorbance against wavelength (Figure 8) shows that the absorption edge of CdZnS occurs at
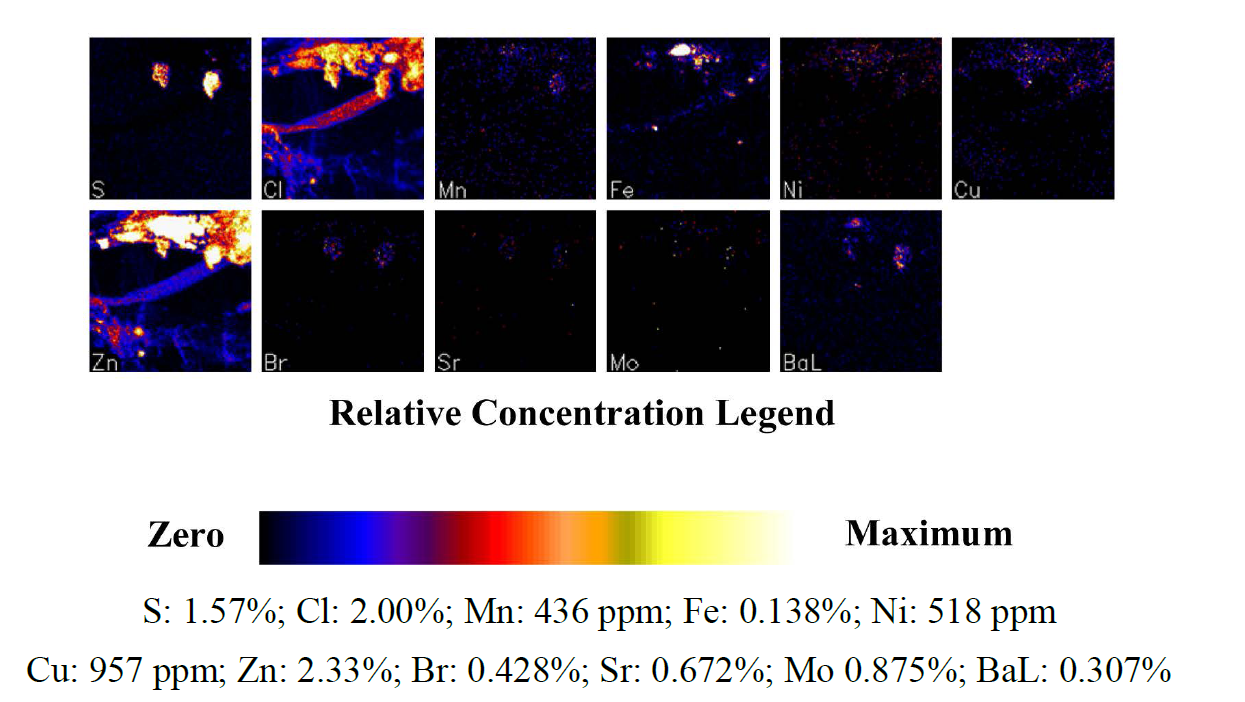
Figure 6. PIXE micrograph of ZnS nanocomposite.
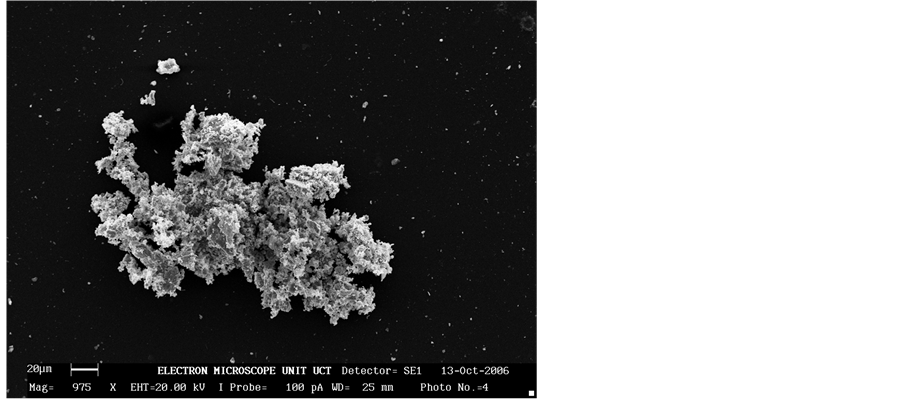
Figure 7. SEM micrograph of ZnS nanocomposite.

Figure 8. UV-vis absorption spectrum of CdZnS nanocomposites.
446 nm which corresponds to 2.78 eV. This value when compared with band gap of the CdS (2.4 eV) and ZnS (3.65 eV) shows that the obtained band gap lies within the expected value. The shift of absorption edge toward shorter wavelength indicates that increasing Zn atomic ratio gives rise to increase in energy gap (Eg). This observation is in agreement with the work Kumara et al. [48] , where it was reported that the band gap of CdZnS lies within the band gap of CdS and ZnS.
(2) Compositional Analysis
The EDS spectrum of the nano composite of CdZnS was shown in Figure 9. The spectral shows the presence of cadmium, zinc, sulphur, chlorine and carbon. The presence of chlorine may be due to residues of the byproduct from the synthesis while carbon originated from the binder.
The stoichiometry ratio of Cd:Zn:S was found to 32.0% Cd, 34.6% Zn and 33.4% S . While Figure 10 shows the PIXE micrograph of the composites, it reveals the elemental composition of the composite namely Cd, Zn and S. It also reveals a lot of impurities that hitherto were not revealed by the EDS. These impurities include Fe, Mn, Cl, Cu, Br, Sr, Mo and Ba. The presence of the impurities may have stem from starting reagent and residues of the reactant.
(3) Structural/Morphology
The SEM micrograph of CdZnS nanocomposite under 1000× magnification is shown in Figure 11. The general surface morphology shows that the particles are in cluster form under 1000× magnification. A closer look at the micrograph shows that the clusters exhibited a needle like shape with average cluster size less than 10 µm. This confirmed that the particles are in nano range.
4. Conclusion
In conclusion, we have prepared nanocomposite of CdS, ZnS and CdZnS nanoparticles embedded in polystyrene matrix. The optical properties show that there is quantum confinement of the nanoparticles. The particle size de-
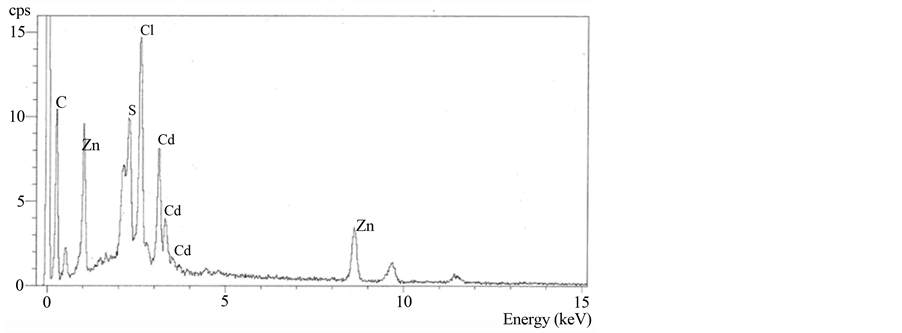
Figure 9. EDS Spectrum of the CdZnS nanoparticle composite.
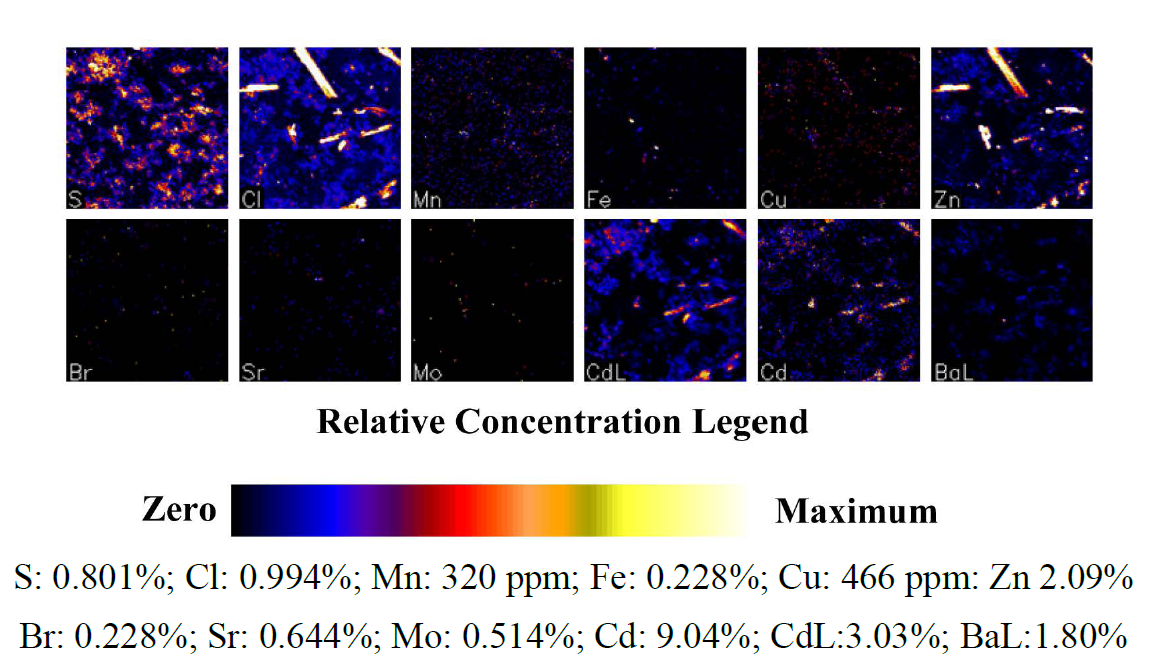
Figure 10. PIXE micrograph of CdZnS nanocomposite.
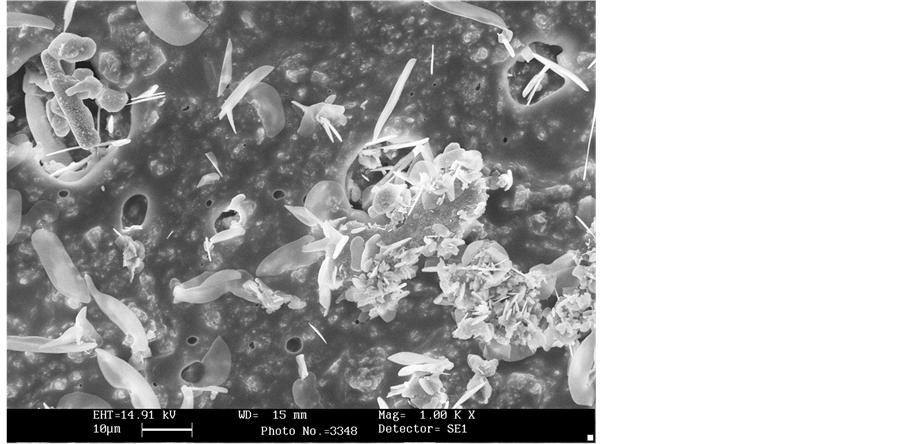
Figure 11. SEM micrograph of CdZnS nanocomposite.
termined from the optical analysis is in agreement with that obtained from the HRTEM. The HRTEM reveals that the particles are well dispersed within the host matrix while the SEM shows that the particles are in cluster form. PIXE analysis shows the presence of impurities which are in form of minor or trace elements.
Acknowledgments
The support of the International Centre for Theoretical Physics (ICTP) under the ICTP-TRIL Programme (Training and Research in Italian Laboratories (TRIL Fellowship) is gratefully acknowledged.
References
- Hache, F., Klein, M.C., Ricard, D. and Flytzanis, C. (1991) Journal of the Optical Society of America B, 8, 1802. http://dx.doi.org/10.1364/JOSAB.8.001802
- Henneberger, F., Puls, J., Spiegelberg, C., Schulzgen, A., Rossman, H. and Jungnickel, V. (1991) Semiconductor Science and Technology, 16, A41. http://dx.doi.org/10.1088/0268-1242/6/9A/008
- Lieber, C.M (1998) Solid State Communication, 107, 59. http://dx.doi.org/10.1016/S0038-1098(98)00209-9
- Brus, L.E. (1986) Journal of Physical Chemistry, 90, 2555. http://dx.doi.org/10.1021/j100403a003
- Bawendi, M.G., Carroll, D.J., Wilson, W.L. and Brus, L.E. (1992) Journal of Chemical Physics, 96, 946. http://dx.doi.org/10.1063/1.462114
- Alivisatos, A.P. (1995) MRS Bulletin, 20, 23-32.
- Spanhel, L., Haase, M., Weller, H. and Henglein, A. (1987) Journal of the American Chemical Society, 109, 5649. http://dx.doi.org/10.1021/ja00253a015
- Caswell, K.K., Mahtab, R. and Murphy, C.J. (2004) Journal of Fluorescence, 14, 407. http://dx.doi.org/10.1023/B:JOFL.0000031822.12344.84
- Chen, X.D., Wang, X.B., Liu, L., Yang, D.C. and Fan, L. (2005) Analytica Chimica Acta, 144, 542,
- Goodwin, J.W., Hearn, J., Ho, C.C. and Ottewill, R.H. (1974) Colloid and Polymer Science, 252, 464-471.
- Schmitt, J., Decher, G., Dressick, W.J., Brandow, S.L., Greer, R.E., Shashidhar, R. and Calvert, J.M. (1997) Advanced Materials, 9, 61-65.
- Olsen, A.W. and Kafafi, Z.H. (1991) Journal of the American Chemical Society, 113, 7758-7760. http://dx.doi.org/10.1021/ja00020a046
- Murray, C.B., Norris, D.J. and Bawendi, M.G. (1993) Journal of the American Chemical Society, 115, 8706. http://dx.doi.org/10.1021/ja00072a025
- Steigerwald, M. and Brus, L. (1989) Annual Review Materials Science, 19, 471. http://dx.doi.org/10.1146/annurev.ms.19.080189.002351
- Colvin, V.L., Schlamp, M.C. and Alivisatos, A.P. (1994) Nature, 370, 354. http://dx.doi.org/10.1038/370354a0
- Mei, G., Carpenter, S., Felton, L.E. and Persans, P.D. (1992) Journal of the Optical Society of America B, 9, 1394. http://dx.doi.org/10.1364/JOSAB.9.001394
- Potter, B.G. and Simmons, J.H. (1988) Physical Review B, 37, 10838. http://dx.doi.org/10.1103/PhysRevB.37.10838
- Liu, J., Sheina, E., Kolawlewski, T. and Mccullough, R.D. (2002) Angewandte Chemie International Edition, 41, 3259. http://dx.doi.org/10.1002/1521-3773(20020902)41:17<3259::AID-ANIE3259>3.0.CO;2-B
- Greenham, N.C., Peng, X.G. and Alivisatos, A.P. (1996) Physical Review B, 54, 17628. http://dx.doi.org/10.1103/PhysRevB.54.17628
- Watson, K.J., Zhu, J., Nguyen, S.T. and Mirkin, C.A. (2000) Pure and Applied Chemistry, 72, 67-72.
- Huynh, W.U., Peng, X. and Alivisatos, A.P. (1999) Advanced Materials, 11, 923-927. http://dx.doi.org/10.1002/(SICI)1521-4095(199908)11:11<923::AID-ADMA923>3.0.CO;2-T
- Olshavsky, M.A. and Allcock, H.R. (1997) Chemistry of Materials, 9, 1367.
- Zhang, Y.F., Tang, Y.H., Wang, N., Yu, D.P., Lee, C.S., Bello, L. and Lee, S.T. (1998) Applied Physics Letters, 72, 1835. http://dx.doi.org/10.1063/1.121199
- Koyama, T., Ohtsuka, S., Nagata, H. and Tanaka, S. (1992) Journal of Crystal Growth, 117, 156-160. http://dx.doi.org/10.1016/0022-0248(92)90736-3
- Hilinski, E.F., Lucas, P.A. and Wang, Y.J. (1988) Journal of Chemical Physics, 89, 3435. http://dx.doi.org/10.1063/1.454913
- Li, Y., Huang, F.Z., Zhang, Q.M. and Gu, Z.N. (2000) Journal of Materials Science, 35, 5933-5937. http://dx.doi.org/10.1023/A:1026714004563
- Pan, Z.W., Dai, Z.R., Ma, C. and Wang, Z.L. (2002) Journal of the American Chemical Society, 124, 1817-1822. http://dx.doi.org/10.1021/ja017284n
- Wu, Y.Y. and Yang, P.D. (2000) Chemistry of Materials, 12, 605-607. http://dx.doi.org/10.1021/cm9907514
- Zhang, H., Ma, X., Xu, J. and Yang, D. (2004) Journal of Crystal Growth, 263, 372-376. http://dx.doi.org/10.1016/j.jcrysgro.2003.11.090
- Garcia, M.M., Villavicencio, H., Hernandez-Velez, M., Sanchez, O. and Martinez-Duart, J.M. (2001) Materials Science and Engineering: C, 15, 101-104. http://dx.doi.org/10.1016/S0928-4931(01)00261-2
- Yin, Y.D., Xu, X.L., Ge, X.W., Lu, Y. and Zhang, Z.C. (1999) Radiation Physics and Chemistry, 55, 353-356. http://dx.doi.org/10.1016/S0969-806X(98)00334-X
- Shiojiri, S., Hirai, T. and Komasawa, I. (1997) Journal of Chemical Engineering of Japan, 30, 86-93. http://dx.doi.org/10.1252/jcej.30.86
- Brent, A.R., Babak, N. and Joseph, M.J. (1999) Science, 22, 746-749.
- Ryan, D.H., Cadogan, J.M. and van Lierop, J. (2002) Journal of Physical Review B, 65, Article ID: 176402. http://dx.doi.org/10.1103/PhysRevB.65.176402
- Efros, A.L. and Efros, A.L. (1982) Soviet Physics: Semiconductors, 16, 772.
- Ekimov, A.I. and Onushchenko, A.A. (1982) Soviet Physics: Semiconductors, 16, 775.
- Khairutdinov, R.F. (1998) Russian Chemical Reviews, 67, 125-139. http://dx.doi.org/10.1070/RC1998v067n02ABEH000339
- Wang, Y. and Herron, N. (1991) Journal of Physical Chemistry, 95, 525-532. http://dx.doi.org/10.1021/j100155a009
- Stroyuk, A.L., Shvalagin, V.V., Raevskaya, A.E., Korzhak, A.V. and Ya Kuchmii, S. (2003) Theoretical and Experimental Chemistry, 39.
- Favero, P.P., de Souza-Parise, M., Fernandez, J.L.R., Miotto, R. and Ferraz, A.C. (2006) Brazilian Journal of Physics, 36.
- Winkler, U., Eich, D., Chen, Z.H., Fink, R., Kulkarni, S.K. and Umbach, E. (1999) Chemical Physics Letters, 306, 95-102. http://dx.doi.org/10.1016/S0009-2614(99)00427-3
- Martienssen, W. and Warlimont, H. (2005) Springer Handbook of Condensed Matter and Material Data. Springer Berlin Heidelberg, New York, 665-703. http://dx.doi.org/10.1007/3-540-30437-1
- (1987) Numerical Data and Functional Relationships in Science and Technology. Landolt-Bornstein, Vol. 22a, Springer Verlag, Berlin, 168.
- Yue, G.H., Yan, P.X., Yan, D., Liu, J.Z., Qu, D.M., Yang, Q. and Fan, X.Y. (2006) Journal of Crystal Growth, 293, 428- 432. http://dx.doi.org/10.1016/j.jcrysgro.2006.05.053
- Qian, X.F., Yin, J., Guo, X.X., Yang, Y.F., Zhu, Z.K. and Lu, J. (2000) Journal of Materials Science Letters, 19, 2235- 2237. http://dx.doi.org/10.1023/A:1006772724113
- Froment, M. and Lincot, D. (1995) Electrochimica Acta, 40, 1293-1303
- Yamaguchi, K., Yoshida, T., Lincot, D. and Minoura, H. (2003) Journal of Physical Chemistry, 107, 387-397. http://dx.doi.org/10.1021/jp025676q
- Kumara, P., Misraa, A., Kumarb, D., Dhamab, N., Sharmad, T.P. and Dixit, P.N. (2004) Optical Materials, 27, 261- 264. http://dx.doi.org/10.1016/j.optmat.2004.04.008