Advances in Bioscience and Biotechnology
Vol.4 No.4(2013), Article ID:30912,6 pages DOI:10.4236/abb.2013.44076
A robust protein extraction method for two dimensional electrophoresis of silkworm proteins
![]()
1Institute of Life Sciences, Jiangsu University, Zhenjiang, China
2School of Life Science, Sichuan University, Chengdu, China
Email: *kpchen@ujs.edu.cn
Copyright © 2013 Lvgao Qin et al. This is an open access article distributed under the Creative Commons Attribution License, which permits unrestricted use, distribution, and reproduction in any medium, provided the original work is properly cited.
Received 23 January 2013; revised 10 March 2013; accepted 12 April 2013
Keywords: Silkworm; Proteomic; Mass Spectrometry; Protein Extraction; Two Dimensional Electrophoresis
ABSTRACT
Silkworm (Bombyx mori) is a species of agricultural importance, as well as a model organism for Lepidoptera insects. Proteomic method has been widely used in silkworm research, and a robust mass spectrometry-compatible protein extraction method is urgently needed. In this study, we adapted phenol extraction method to extract silkworm midgut protein, and coupled this method with pH 5 - 8 gel strip for two dimensional electrophoresis. The phenol extraction method significantly increased the resolution, as well as greatly reduced the background of two dimensional electrophoresis gels. In addition, this method was well compatible with mass spectrometry analysis. This is the first report that phenol extraction method is used for silkworm midgut protein extraction, and may be applied in other researches.
1. INTRODUCTION
Two dimensional electrophoresis (2 - DE) and mass spectrometry methods are commonly used in proteomic studies of many organisms. Since invention by O’Farrell and Klose in 1975, 2 - DE has been developed into an important tool in proteomic research. Many factors can influence the quality of 2 - DE map. Among those factors, a suitable protein extraction method is the most important one [1]. There was some progress in developing a good protein extraction method. Diane Barraclough reported an optimized actone extraction method for fruit protein. For those troublesome fruit components such as soluble pectin, polyphenols and high-acidity fruit, this method was relatively rapid, reproducible and with better resolution [2]. In addition, the authors also used the method for a range of fruit tissues including low protein sources (apple and peach flesh), high lipid material (avocado fruit flesh) and high acidity lemon tissue. In another study, Wang et al. used a modified Borax/PVPP/Phenol method for protein preparation from different latex subcellular fractions, and used the resulting protein to construct high-resolution reference 2 - DE maps [3]. Using this method, the protein product from total latex and Cserum fraction generated 1358 and 1248 protein spots on coomassie brilliant blue stained 2 - DE gels, respectively. On the other hand, proteins from rubber particles, lutoid fraction and lutoid membranes respectively generated 583, 385 and 724 spots. In addition, the authors identified 13 representative proteins on 2 - DE gels by matrix-assisted laser desorption/ionization-time of flight/time of flight mass spectrometry/mass spectrometry (MALDI TOF/TOF MS/MS), suggesting the Borax/ PVPP/Phenol method was compatible with MS [3].
Silkworm Bombyx mori (B. mori), a Lepidopteran species of agricultural and research importance, has been domesticated for silk production for more than 5000 years. Currently, it is the major economic resource for more than 30 million families in countries including China, India, Vietnam, and Thailand. In addition, B. mori is a model organism for Lepidoptera, many species of which are important for agriculture and forestry [4]. However, there are only limited researches on the protein extraction methods for silkworm. In this study, we adapted a phenol extraction method to extract silkworm midgut protein. The resultant protein could produce high quality 2 - DE protein profiles. In addition, the method was used to compare with lysis buffer extraction method, in which lysis buffer was directly added to sample powder for protein extraction. The result showed that phenol extraction method was more suitable for silkworm midgut protein. In addition, we compared 2 - DE gel maps which using pH 3 - 10 and pH 5 - 8 gel strips for isoelectric focusing. The result indicated that pH 5 - 8 gel strip was more suitable for silkworm midgut protein. To verify phenol extraction method was compatible with MS, we selected protein spots from phenol extraction method for MALDI-TOF MS analysis.
2. MATERIALS AND METHODS
A silkworm strain, NB, maintained in our laboratory, was used in this experiment. From hatching to fifth instar, the larvae were reared in plastic containers with fresh mulberry leaves, and placed in a chamber where the temperature was 25˚C ± 1˚C, and the relative humidity was 75% ± 2%. On day 2 of fifth instar, the midgut of 30 larvae at the same size and age was cut and washed in 0.75% ice-cold physiological salt solution, followed by frozen in liquid nitrogen immediately, and stored at −80˚C for later use.
For the phenol base protein extraction, approximately 1000 mg silkworm midgut was ground in liquid nitrogen, followed by adding 3 mL protein extraction buffer to the protein powder. The protein extraction buffer contains 20 mM tris-HCl, pH 7.5, 250 mM sucrose, 10 mM EDTA, 1 mM phenylmethanesulfonyl fluoride (PMSF), 1 mM β- mercaptoethanol and 1% (v/v) triton X-100. The mixture was transferred to microfuge tube, and vortexed for 30 min at 4˚C to dissolve protein. Subsequently, the mixture was centrifuged at 15,000 g for 20 min at 4˚C, the resultant supernatant was mixed with an equal volume of tris-saturated phenol, and vortexed for 1 h at 4˚C to denature protein completely. Then, the mixture was centrifuged at 15,000 g for 20 min at 4˚C, the lower phenol layer (containing denatured protein) was collected, followed by adding three volumes of methanol (containing 100 mM ammonium acetate) and incubated at −20˚C overnight. After incubation, sample was centrifuged at 15,000 g for 20 min at 4˚C, the protein pellet was washed with methanol (containing 100 mM ammonium), then was washed with cold acetone (containing dithiothreitol (DTT)) for five times. After each wash, sample was centrifuged to collect protein precipitate. Finally, the sample was lyophilized to remove residual acetone, and 1 mL lysis buffer containing 7 M urea, 2 M thiourea, 4% (w/v) chaps and 1% (w/v) DTT was added to dissolve lyophilized protein, and the supernatant after centrifugation was stored at −80˚C for later use.
A lysis buffer extraction method was used for comparison. For silkworm midgut protein preparation, approximately 1000 mg silkworm midgut was ground in liquid nitrogen, and 1 mL lysis buffer (7 M urea, 2 M thiourea, 4% (w/v) chaps and 1% (w/v) DTT) was mixed with tissue powder to dissolve protein. The mixture was centrifuged at 15,000 g for 20 min at 4˚C, and the supernatant was stored at −80˚C.
Protein samples from above two extraction methods were quantified using RC DCTM protein concentration kit (Bio-Rad, Hercules, CA, USA), bovine serum albumin was used (BSA) as standard. The first dimension electrophoresis, isoelectric focusing, was operated under 20˚C with 17 cm (linear, pH 3 - 10 or 5 - 8) IPG gel strip, according to manufacturer’s instruction. 1.2 mg protein was loaded to IPG strip using active rehydration (13 h with 50 V), followed by a voltage gradient of 250 V for 0.5 h, 1000 V for 1 h, 10,000 V for 5 h, and continued for a total of 60 kVh under 10,000 V. The focused strip was equilibrated for 15 min with equilibration solution (6 M urea, 0.375 M tris-HCl, 20% (v/v) glycerol, 2% (w/v) SDS) containing 2% (w/v) DTT, followed by equilibrated for another 15 min with equilibrated solution containing 2.5% (w/v) iodoacetamide [5]. Equilibrated strip was then sealed on the top of 12% SDS-PAGE gel, and subjected to electrophoresis under 20˚C with 15 W power until bromophenol blue reached the bottom of gels. After electrophoresis, the gel was visualized with 0.1% coomassie brilliant blue R - 250, and scanned with a high precision scanner (ScanMaker 9700XL, Microtek).
To verify MS compatible with phenol based protein extraction, we analyzed some protein spots using MALDITOF MS. Protein spots were excised from gel, and then subjected to destaining, reduction, alkylation, and trypsin digestion. Briefly, the gel spots were first sonicated twice for 10 min in deionised water, and after in 25 mM ammonium bicarbonate, 25% acetonitrile for 10 min. The destained gel spots were dehydrated with acetonitrile, and then vacuum dried. Subsequently, the proteins in gel spots were reduced with 10 mM DTT in 100 mM NH4HCO3 for 1 h at 56˚C, and alkylated with 40 mM iodoacetamide in 100 mM NH4HCO3 for 45 min at room temperature. Finally, the gel spots were successively washed with 25 mM ammonium bicarbonate, 50% acetonitrile, and 100% acetonitrile, then rehydrated in 25 mM NH4HCO3 with 20 μg/mL trypsin at 37˚C overnight [6].
After digestion, the peptide fragments were collected and mixed with 10 mg/ml matrix (a-cyano-4-hydroxylcinnamic acid, Sigma), which was previously dissolved in 50% acetonitrile and 0.1% trifluoroacetic acid. Subsequently, the sample was spotted on MTP Anchor Chip board (Bruker) and analyzed with MALDI-TOF MS. The parameter settings were as follows: delay, 80 ns; ion source, 1 volt, 25 kV; ion source, 2 volts, 23.4 kV; lens voltage, 6 kV; and mass range, 500 - 4000 Da. Standard peptide from manufacturer was used as external standard, while the peptide ions generated by autolysis of trypsin (with m/z 2163.333 and 2273.434) were used as internal standards for calibration. The threshold for peak acceptance was a signal-to-noise ratio of 3. After alignment, peaks with a mass-to-charge ratio difference of <250 ppm were considered to be identical [7].
The proteins were identified using MASCOT search engine (Matrix Science, London, UK) against NCBInr eukaryotic protein sequence database. The parameters were as following: missed cleavages as 1, fixed modification as acetylation of carbamidomethyl (C), variable modification as Glu→pyro-Glu (N-term Q) or oxidation of methionine (M), and mass tolerances at 0.3 Da. Mass values were set as MH+. A minimum protein ion score of 79 (P < 0.05) was set as the threshold for acceptance [8].
3. RESULTS
The 2 - DE protein profiles of silkworm midgut were shown in Figure 1. The image from phenol extraction method showed 412 protein spots, 26.4% higher than that from lysis buffer extraction (326 spots). For the two extraction method, the molecular mass of most proteins ranges from 20 to 90 kDa, and the pH value ranges from 5.3 to 8.0. Comparing to lysis buffer extraction, phenol extraction could harvest more high-molecular weight proteins. The gel image for phenol extraction had a higher resolution than that from lysis buffer extraction, for example, in rectangular regions of Figure 1, protein spots from phenol extraction (Figure 1(A)) were more intensive than those from lysis buffer extraction (Figure 1(B)), as well as more clear protein spots. In addition, in image from phenol extraction, there were more protein spots, lower background noise and less horizontal or vertical stripes.
Because gel image from phenol extraction method had a higher quality, and most proteins were concentrated at the region of pH 5.3 - 8.0 (Figure 1(A)), so a pH 5 - 8, 17 cm IPG strip was used to further separate proteins. The resolution of 2 - DE gel was better than that using pH 3 - 10 gel strip. So, in proteomics study, pH 5 - 8 gel strip is more suitable for separating silkworm midgut proteins.
To confirm that phenol extraction method was compatible with MS, we randomly excised seven protein spots in 2 - DE gel from phenol extraction, which were numbered in Figure 2. The selected protein spots were analyzed with MALDI-TOF MS, and the result was listed in Table 1. Among them, the peptide mass fingerprinting (PMF) of spots 6 and 7 were in Figure 3, the sequences in bold letter indicated peptides fragments identified by MS. Mascot search revealed that the 2 proteins were chaperonin subunit 4 delta (spot 6) and vacuolar ATP synthase subunit F (spot 7), respectively (Table 1). The PMF showed low noise background (Figure 3), indicating the protein spots from phenol extraction were well compatible with MS analysis. Other protein spots were identified as sorbitol dehydrogenase (spot 1), translation elongation factor 2 (spot 2), transaldolase (spot 3), thiol peroxiredoxin (spot 4), and vacuolar ATP synthase subunit B (spot 5), all of these are silkworm proteins (Table 1). These results suggested that the phenol extraction method was compatible with MS, and it could be used for proteomic analysis of silkworm proteins.
4. DISCUSSION
2 - DE is one of the widely used methods for separation and comparison of complex protein mixtures. It offers greater resolution than others currently used separation techniques, so it has become the main technique for proteomic studies including mapping proteins from a lot of species and tissues and analyzing changes in protein expression [9]. When evaluating whether a protein extraction method is suitable for proteomic research, three points must be considered: efficiency of extraction, quality of 2 - DE gel map and compatibility with MS. In our study, the phenol extraction method was demonstrated to have a high yield of protein, and the protein sample was suitable for 2 - DE gel analysis because it could be used to produce high quality proteomic gel map. Moreover, in this study it was proved that phenol extraction method was compatible with MS analysis (Table 1, Figure 3).
To generate a high quality 2 - DE gel map, the substance that interfere protein electrophoresis should be
Table 1. Proteins from phenol extraction method were identified by MALDI-TOF MS. To evaluate whether phenol extraction method was compatible with MS, 7 protein spots were randomly selected for MS analysis.
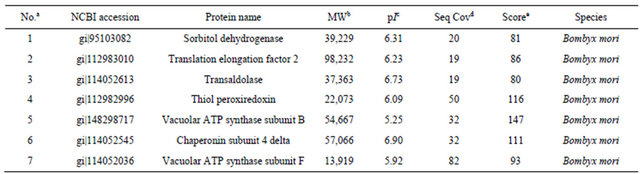
Note: aSpot number indicated in Figure 2; bMolecular weight; cIsoelectric point; dAmino acid sequence coverage of proteins; eMascot score of PMF.
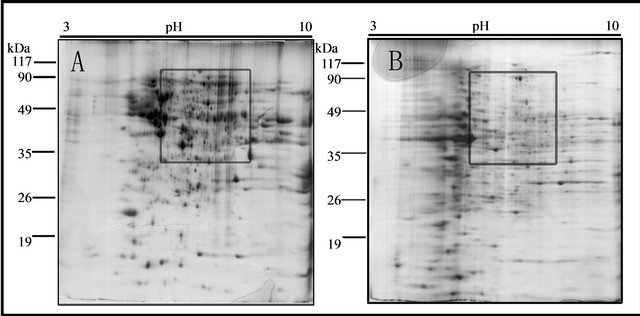
Figure 1. 2 - DE images of silkworm midgut protein extracted with phenol extraction method (A) and lysis buffer extraction method (B). The numbers at left of images indicate molecular weight, and that above the images indicate isoelectric point, the region marked with box shows the most different between the two images.
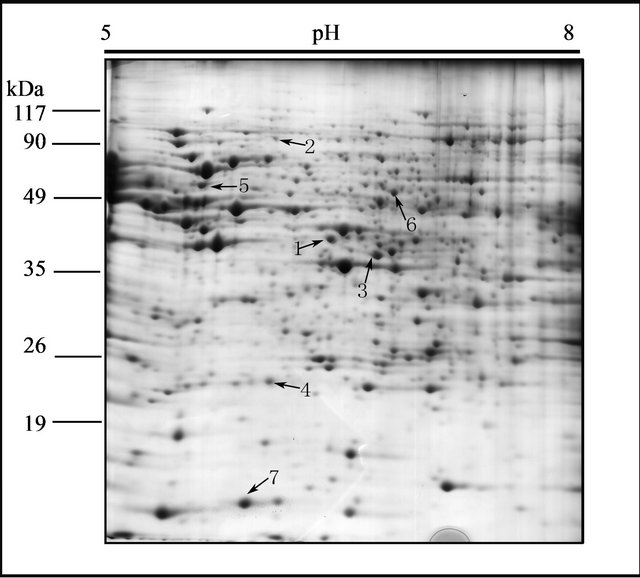
Figure 2. 2-DE images of silkworm midgut protein using pH 5 - 8 gel strip for isoelectric focusing. The numbers at left of image indicate molecular weight, and that above the image indicates isoelectric point, the spots marked with numbers were selected for MALDI-TOF MS analysis.
removed. Nucleic acid is the major influencing factor and cannot be removed during lysis buffer extraction. Thus, for quantitative proteomic analysis of silkworm proteins, lysis buffer extraction method needs further modification. While using phenol extraction method, the nucleic acid was dissolved in protein extraction buffer, but proteins could be denatured and precipitated by phenol, so the nuclear acid can be efficiently removed by centrifugalization, leading to better protein sample for 2 - DE (Figure 1(A)). There are other protein extraction methods, for example, multi-detergent extraction. However, it was reported that insect proteins extracted by multi-detergent had a disappointing performances in protein solubilization, 2 - DE resolution and visualization [10,11]. TCA-acetone is another method that is often used in 2 - DE. However, Lei et al. reported that acetone could not well precipitate diluted samples [12]. In our experiment, the protein yield of phenol extraction method (33.7 mg protein per mg tissue) looks lower than lysis buffer extraction (42.8 mg protein per mg tissue). This may be because phenol extraction method had more centrifugation steps, which could cause loss of some protein. However, 1.2 mg protein is enough to produce a high quality 2 - DE image, some highly sensitive protein staining reagents, such as silver stain reagent or Flamingo fluorescent, requires less protein sample for 2 - DE. So, phenol extraction method can produce enough protein for 2 - DE experiment. In addition, phenol extraction method also has other advantages. Wang at al reported that phenol extraction method could isolate membrane proteins, as well as could enrich mRNA binding proteins [3]. In the acidic region of 2 - DE map of phenol extraction, there exist few spots (Figure 1(A)), but as a whole, there were more spots relative to that of lysis buffer extraction (Figure 1(B)). For these reasons, in our study, phenol extraction method is a good choice for preparing protein samples for 2 - DE studies.
From Figure 1, we can see that most silkworm midgut proteins have an isoelectric point between 5.3 and 8.0, while very few protein spots locate at the acidic (pH < 5) and basic areas (pH > 8.0). When using pH 5 - 8 gel strip to separate midgut total protein from phenol extraction
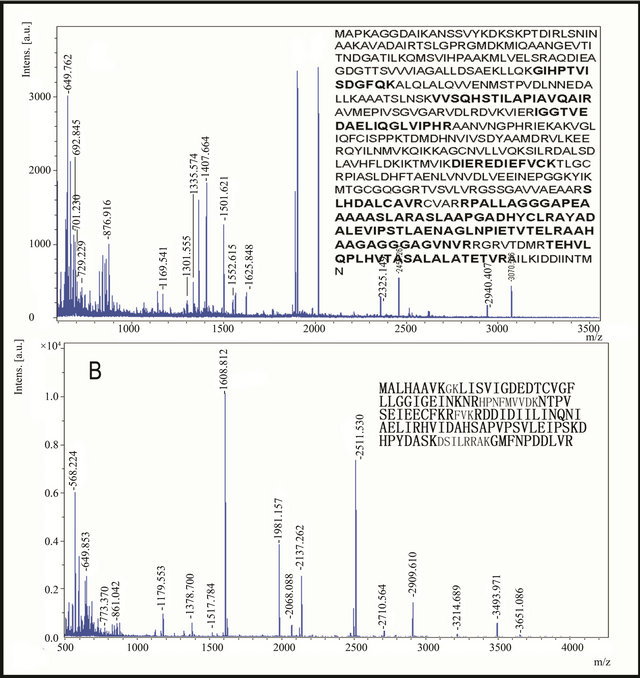
Figure 3. PMF of spot 6(a) and 7(b) from phenol extraction method. The spots were excised and digested with trypsin, and then the generated peptides were analyzed by MALDI-TOF MS. The sequences in bold letter indicate peptides fragments identified by MS. MASCOT searching against NCBInr database indicated that the 2 proteins were chaperonin subunit 4 delta (a) and vacuolar ATP synthase subunit F (b), respectively, both were silkworm proteins.
method, the quality of 2 - DE gel was better than that using pH 3 - 10 gel strip. This may be because in pH 3 - 10 gel strip, many kinds of proteins that with similar isoelectric point cluster together, which can affect isoelectric focusing, and subsequently reduce the quality of 2 - DE gel map [13].
MALDI-TOF mass spectrometry is a powerful method for protein identification. It relies on comparing protein-originated PMF data with theoretical fingerprint profiles from protein databases [14]. To evaluate whether phenol extraction method was compatible with MS, we excised 7 proteins (Figure 2) for MS analysis. All of these proteins were identified as silkworm proteins (Table 1). In addition, the PMF of selected spots 6 and 7 (Figure 3) showed many peptide fragments with high intensity and low noise background. This suggested that the protein spots were successfully identified by MS, and phenol extraction method was compatible with MS.
Overall, the present study firstly demonstrated that the phenol extraction method coupled with pH 5 - 8 gel strip was a suitable method for proteomic study of silkworm midgut proteins. The method is robust, simple, and performs well in terms of resolution, spot number and spot intensity. In addition, the method is well compatible with MS analysis.
Sure, in this study, it will be better if comparing the 2 - DE result of phenol extraction method with all other protein extraction methods, and this is our future work. In addition, we will use more pH range gel strip for 2 - DE to evaluate which kind of gel strip is best for silkworm midgut protein.
5. ACKNOWLEDGEMENTS
This study was supported by the National Basic Research of China (Grant No. 2012 CB114600) and National Natural Science Foundation (NO. 31272507), Natural Science Foundation for Universities of Jiangsu Province (No.10KJB180001), and the Start-Up Research Funding of Jiangsu University for Distinguished Scholars (No.09JDG005).
REFERENCES
- Cilia, M., Fish, T., Yang, X., McLaughlin, M., Thannhauser, T.W. and Gray, S. (2009) A comparison of protein extraction methods suitable for gel-based proteomic studies of aphid proteins. Journal of Biomolecular Techniques, 20, 201-215.
- Diane Barraclough, D.O., William, L. and Tanya, C., (2004) A general method for two-dimensional protein electrophoresis of fruit samples. Postharvest Biology and Technology, 32, 175-181. doi:10.1016/j.postharvbio.2003.11.002
- Wang, X., Shi, M., Lu, X., Ma, R., Wu, C., Guo, A., Peng, M. and Tian, W. (2010) A method for protein extraction from different subcellular fractions of laticifer latex in Hevea brasiliensis compatible with 2-DE and MS. Proteome Science, 8, 35-44. doi:10.1186/1477-5956-8-35
- Moscardi, F. (1999) Assessment of the application of baculoviruses for control of Lepidoptera. Annual Review of Entomology, 44, 257-289. doi:10.1146/annurev.ento.44.1.257
- Kim, Y., Nandakumar, M.P. and Marten, M.R. (2007) Pro- teome map of Aspergillus nidulans during osmoadaptation. Fungal Genetics and Biology, 44, 886-895. doi:10.1016/j.fgb.2006.12.001
- Liang, Y., Chen, H., Tang, M. and Shen, S. (2007) Proteome analysis of an ectomycorrhizal fungus Boletus edulis under salt shock. Mycological Research, 111, 939-946. doi:10.1016/j.mycres.2007.06.005
- Bessede, E., Solecki, O., Sifre, E., Labadi, L. and Megraud, F. (2011) Identification of Campylobacter species and related organisms by matrix assisted laser desorption ionization-time of flight (MALDI-TOF) mass spectrometry. Clinical Microbiology and Infection, Vol. 17, pp. 1101- 1106.
- Zhou, Z.H., Yang, H.J., Chen, M., Lou, C.F., Zhang, Y.Z., Chen, K.P., Wang, Y., Yu, M.L., Yu, F., Li, J.Y., Zhong, B.X. (2008) Comparative proteomic analysis between the domesticated silkworm (Bombyx mori) reared on fresh mulberry leaves and on artificial diet. Journal of Proteome Research, 7, 5103-5111. doi:10.1021/pr800383r
- Jenkins, R.E. and Pennington, S.R. (2001) Arrays for protein expression profiling: Towards a viable alternative to two-dimensional gel electrophoresis? Proteomics, 1, 13- 29. doi:10.1002/1615-9861(200101)1:1<13::AID-PROT13>3.0.CO;2-J
- Stadler, F. and Hales, D. (2002) Highly-resolving two-dimensional electrophoresis for the study of insect proteins. Proteomics, 2, 1347-1353. doi:10.1002/1615-9861(200209)2:9<1347::AID-PROT1347>3.0.CO;2-P
- Molloy, M.P. (2000) Two-dimensional electrophoresis of membrane proteins using immobilized pH gradients. Analytical Biochemistry, 280, 1-10. doi:10.1006/abio.2000.4514
- Jiang, L., He, L. and Fountoulakis, M. (2004) Comparison of protein precipitation methods for sample preparation prior to proteomic analysis. Journal of Chromatography, 1023, 317-320. doi:10.1016/j.chroma.2003.10.029
- Wang Yuqi, P.X. (2006) A two-dimensional electrophoresis protocol suitable for proteomic study of rice leaves. Journal of Plant Physiology and Molecular Biology, 2, 252-256.
- Cohen, A.M., Rumpel, K., Coombs, G.H. and Wastling, J.M. (2002) Characterisation of global protein expression by two-dimensional electrophoresis and mass spectrometry: Proteomics of Toxoplasma gondii. International Journal for Parasitology, 32, 39-51. doi:10.1016/S0020-7519(01)00308-3
NOTES
*Corresponding author.