Modern Economy
Vol.06 No.12(2015), Article ID:62354,12 pages
10.4236/me.2015.612122
Willingness-to-Pay for Potable Water in the Accra-Tema Metropolitan Area of Ghana
Daniel Kwabena Twerefou1, Kwadwo A. Tutu1, Ebo Botchway1, Samuel Darkwah2
1University of Ghana, Department of Economics, Accra, Ghana
2Mendel University, Faculty of Regional and Territorial Studies, Brno, Czech Republics

Copyright © 2015 by authors and Scientific Research Publishing Inc.
This work is licensed under the Creative Commons Attribution International License (CC BY).
http://creativecommons.org/licenses/by/4.0/


Received 1 October 2015; accepted 23 December 2015; published 29 December 2015
ABSTRACT
A major problem confronting the Accra-Tema Metropolitan area of Ghana is the provision of potable water supply. One reason for this occurrence is the inability of Ghana Water Company Limited to meet the growing demand. This can partly be attributable to the ineffective pricing by the PURC which is below cost recovery levels. In this study we investigate household’s willingness-to-pay (WTP) for potable water supply together with the factors that determine WTP by using the Contingent Valuation Method (CVM). The results indicate that households in the Accra-Tema metropolis are willing to pay on the average GH¢0.10 for a bucket (17.5 litres) of water which is about 7 times more than what they are paying currently. Analysis of the factors that influence households WTP indicates that income, time spent to fetch water from existing sources, level of education, sanitation facility, perceived quality of current water supply, sex of the respondent and marital status are the main factors influencing households WTP for potable water supply services in the metropolis. We recommend that government improve water supply and increase tariffs since people are prepared to pay more for potable water supply as well as reduce inefficiencies that exist in the sector.
Keywords:
Willingness to Pay, Contingent Valuation Method, Demand for Water

1. Introduction
Clean and safe drinking water is a basic human need and the most important necessity of life after air. Most of the challenges that many developing countries face today are increasingly related to water. Poverty assessment research has consistently shown that improvement in water supply services is a critical element in designing and implementing effective strategies for poverty reduction. This is one of the reasons why reducing the population without access to adequate water and basic sanitation by half is one of the Millennium Development Goals (MDGs).
The World Health Organization [1] in the year 2000 estimated that Africa had 28% of the world’s population without access to clean water. This means that only about 72% of the population have access to clean water. The remaining obtains water from sources such as wells, boreholes and streams which may not be clean. The situation is not different in Ghana and has had significant impact on health. For example, diarrhoea accounts for about 12% of childhood deaths and the third largest cause of death in children under the age of 5 after malaria and pneumonia. Also, information from the Ghana Health Services indicates that about 61 people died from cholera in Ghana in 2011. Many developing countries including Ghana have often subsidised water supply in an attempt to achieve some social benefits for low-income households. However, benefits from subsidising water usually accrue to wealthier households due to poor targeting. According to the Public Utilities Regulatory Commission (PURC) of Ghana’s guestimates, majority of urban households, especially the poor, depend on secondary water providers like tankers, cart operators and domestic vendors, at a cost 12 times more than the approved price.
There is a general consensus that water tariffs in Ghana are below cost recovery levels. Even though the target of the MDGs is to halve the population without access to water and sanitation by 2015, Ghana aims to achieve 85% coverage. According to estimates by WaterAid, the expansion and rehabilitation of urban infrastructure to meet MDG targets require investment of US$85 million a year, but the current level of investment is estimated to be US$17 million. From the population and housing census of 2010, the population of Accra-Tema metropolis stood at 4,192,370. Statistics show that about 80% of households in the metropolis have access to water. In reality only 45% of the population have a household connection (Abraham, et al.) [2] . Majority of the inhabitants use water from wells and boreholes which are not potable. A major problem that residents confront is the quality and quantity of water supplied.
Information from WaterAid [3] also indicates that the inability of GWCL to solve the acute water shortage in the metropolis is a result of the worsening financial condition of the company, insufficient sector investment by government and weak implementation capacity caused by bad management, staffing problems and low salary levels, among others. One factor that has contributed to the company’s financial problem is the increase in the volume of unaccounted water: treated water is not accounted for since its precise destination is not known. It is estimated by the GWCL that about 60% of average daily production of water is unaccounted for. Causes include leakages and burst of old pipes, illegal connections, etc. Estimates by GWCL also indicate that about 28% of its customers are not billed. All these, has contributed to supply deficits which continues to increase.
In line with the restructuring of the water sector to improve efficiency in 1993, the Ghana Water Supply Corporation (GWSC) was replaced with the publicly owned Ghana Water Company Limited (GWCL) and charged with the responsibility of supplying water to urban dwellers; the Community Water and Sanitation Division (CWSD) was transformed into the Community Water and Sanitation Agency (CWSA) to take care of rural water supplies and sanitation and the Public Utilities Regulatory Commission (PURC) was established to regulate the GWCL through tariff setting and other means. Subsidies were also gradually reduced and cost recovery measuresintroduced which resulted in regular upwards revision of tariffs by the PURC. However, tariff levels still remain below cost recovery levels.
There exist issues of policy failure and inefficiency that has led to the current deficit in water supply. The PURC sets price below cost recovery and expects the government to pay the rest as subsidies through investments in water infrastructure. Unfortunately, such investments hardly come from the government. The low tariffs, coupled with inadequate government investments according to the company is making it difficult for them to supply the required quality and quantity of water even though there are structural inefficiencies that has persisted for a long time. The huge supply deficit as well as the poor quality of water suggests that there is a huge demand for water and many people may be willing to pay more for the service once it is potable. Possibly, a shift from the provision of subsidies to a more economic pricing of water will provide the needed resource required for investments which could help reduce the inefficiencies and lead to improved supply. Such a policy will require some information on households’ WTP for water to inform decision making.
The current water supply in the metropolis is about 394,260 m3 per day though estimated daily demand by WaterAid [3] is about 763,300 m3 in 2005, indicating a huge supply deficit. With regards to the quality of water provision, Labite et al. [4] argue that challenges in the treatment and distribution process have affected the quality of drinking water in Ghana. The continuous public outcry about the quantity and quality of water provision in the metropolis is a clear indication that they will be willing to pay more for potable water supply1. Currently, many international financing agencies contend that the necessary resources needed for the provision of water need to come from consumers (Brookshire and Whittington) [5] . Juxtaposing this demand to the claim by the GCWL that their inability to meet demand is mainly due to financial constraints indicates that supply can improve if households are willing and able to pay for water. Research questions that confront the metropolis today are: 1) What is the nature of water provision in the metropolis? How much are households willing to pay for potable water supply? What factors influence the WTP for potable water supply?
The issues addressed by this study are of relevance for policy makers because it can provide insight about the gap between existing water charges and the maximum charge consumers are willing to pay which has implications for efficient water use and conservation, potential investments in water production and distribution. Also, the work could contribute to providing the basis for government actions that might be directed towards a comprehensive tariff system for urban water supply in Ghana. The rest of the sections are organised as follows. Section 2 reviews literature on the topic. Section 3 explains the methodology, Section 4discusses the results and the last section concludes and makes policy recommendations.
2. Literature Review
Environmental economists in understanding economic valuation lay emphasis on human preference. In general, the Total Economic Value (TEV) approach introduced by Pearce et al. [6] is the main framework used to classify the various values of an environmental resource. This framework posits that the TEV of an environmental resource can be classified as use value which can further be divided into direct and indirect, and non-use value which includes existence, option and bequest values.
Using examples from a lake, direct use values (DUV) refer to the benefits people obtain from direct use of the resource such as fish, drinking water, etc. Indirect use value is derived from ecosystem services such as micro- climatic. Non-use values refer to the benefits derived from the mere existence of a resource above and beyond any direct or indirect use value. While existence value refers to the value that people attach to the continued existence of certain species of fish found in particular water bodies, bequest value arise when people place a value on the conservation of particular resources for posterity. Option value refers to potential direct and indirect use values which might be realized in the future. In specific examples some of these values may overlap, especially with regards to non-use values. They are therefore useful as an indicative guide.
Techniques for valuing environmental resources can be broadly classified into two, revealed and stated preference approaches. The Revealed Preference approach which can either be market-based or surrogate markets uses individuals’ behaviour in actual or hypothetical markets to establish the value of an environmental good or service. The Markets based methods rely on direct, observable market interactions for the measurement of individuals’ willingness-to-pay (WTP) to preserve environmental services. There are many methods but the factor of production and defensive expenditure approaches are widely used. The factor of production approach monetizes the value of natural resource based on its value in the production process as a factor of production. The defensive expenditure method measures the resources used to avoid the negative and positive impacts from perceived environmental damage and improvements respectively, and uses it as a proxy for the monetized value of the damage caused or improvements made. Information acquired through surrogate markets which assume that certain non-market values reflect indirectly in consumer expenditure, in the prices of marketed goods and services or in the level of productivity of certain market activities is used as the value of environmental resources in situations where there are no defined markets. Two main approaches dominate hedonic pricing and travel cost models. Hedonic Pricing Method (HPM) is premised on the assumption that the market value of land or labour is related to the stream of net benefits including environmental amenities derived from it, and uses two main techniques: the property value approach and the wage differential approach. Under this assumption, the value of an environmental amenity can be imputed from the observed land or labour market. The travel cost method on the other hand uses the costs incurred by visitors to enjoy environmental services to deduce the value they place on that service, and usually used to value parks.
The main idea of the Stated Preference approach is to obtain information on the value of an environmental benefit by posing questions to consumers about their WTP for a resource or their Willingness-to-Accept (WTA) compensation for losing the resource. Two main techniques are used: Choice Experiments and Contingent Valuation Method (CVM). Choice experiment asks respondents to choose among alternative bundles of non-market goods, which are described in terms of their attributes, including a hypothetical price. The CVM elicits individual expressions of value for specified increases or decreases in the quantity or quality of a non-market good. The process estimates respondents’ consumer surplus and the maximum amount the good is worth to the individual. Most CVM studies use data from surveys which used different methods to ask questions about WTP or WTA. In this study, we use the CVM since responses elicited by CVM provides theoretically correct monetary measures of utility changes, capable of providing monetary valuation of non-use values, ability to value environmental quality change even if they have not yet occurred (ex ante valuation).
There are a lot of empirical works that uses the CVM. World Bank [7] investigated the determinants of house- hold demand for water supply in some countries in Africa, Latin America and South Asia using the revealed and stated preference approaches. Contrary to expectations WTP for water supply did not depend on income since it was statistically insignificant but had the expected sign. Other factors that had positive impact on WTP were education, occupation, household size, perceived quality of water and gender. The researchers concluded that households’ WTP for water system is not dependent on anyone set of factors but rather on their joint effects and on specific cultural setting. Boadu [8] examined the relationship between WTP for water and selected socioeconomic characteristics using data from selected villages in Ghana and obtained a positive relationship between household history of water related illness and the WTP for water services. The other socioeconomic factors effect did not follow any consistent pattern and therefore broad generalisations were not possible. Using the weighted OLS and the Maximum Likelihood approaches, Jordan and Elnagheeb [9] employed the CVM to investigate WTP for drinking water quality in Georgia, USA. Their results indicate that income elasticity of WTP was approximately 0.1. Also, WTP was found to increase with the level of education while female and younger respondents were found to be WTP more than their male and older counterparts.
Aguilar and Sterner [10] used CVM to investigate WTP for potable water services in three different areas - Guanacaste and Limon in Costa Rica and MuangXiathani in Laos. Their result indicated that WTP is positively influenced by income and age and negatively by household size. In Limon, women were willing to pay more than men but the reverse was the case in MuagXiathani. On average, inhabitants are willing to pay 80%, 40% and 71% over the current fees in order to receive potable water services in Guanacaste, Limon and MuagXiathani respectively.
Bah [11] employed the CVM to estimate the WTP for potable water services in Freetown, Sierra Leone. His results showed that gender, educational level, income, number of years in residence, expenditure on water and respondents’ attitudes towards water management have significant influence on WTP. Adjei [12] used CVM to determine factors influencing the demand for water in the Greater Accra Region of Ghana. Willingness-to-pay was positively related to income, education, time spent in collecting water and distance from home to existing water source and negatively related to the perception of water quality. Also, people were willing to pay for potable water supply but what they were willing to pay was lower than the cost of production.
Calkins et al. [13] estimated the WTP for potable drinking water in semi-urban area of Douentza, Mali using the linear regression and logit econometric models. Their results revealed that wealth, relative distance to proposed new sources compared with the best existing sources, land tenure security and family size are major determinants of WTP for potable water. Appau-Danso [14] used the CVM and the logit model to estimate the WTP for potable water supply in the Asante Akim South District in Ghana and established that income, age, household size, level of education, distance from the respondent’s homesteads to the existing source, time spent in fetching water and occupation have positive relationship with WTP but income and level of education were not statistically significant at 10% level.
Fissha [15] employed the CVM to estimate the determinants of households demand for potable water in Addis Ababa, Ethiopia, using the tobit and probit models and established that income, education level, age, sanitation facility, perceived water quality and water related diseases have a significantly positive impact on WTP. Adepoju and Omonona [16] used a multi-stage random sampling of 142 households in the Osogbo metropolis and the logit model to estimate the relationship between WTP for potable water supply and some socioeconomic variables and established that socioeconomic characteristics of households do not significantly influence WTP but rather the percentage of income that a household is willing to pay for potable water supply and the WTP for connection charges to the potable source are statistically significant at 10% level. Noor and Siddiqi [17] adopted the CVM and the tobit econometric model to estimate the WTP for drinking water quality in Wasa, Lahore and established that household’s WTP is influenced by coping costs that households pay for ensuring quality of water and the education level of household heads.
Using the logistic linear regression model, Olajuyigbe and Fasakin [18] investigated factors that influence people’s WTP for improved sustainable water supply in Southern Nigeria. The empirical results indicated that the most important determinants of water services in this area are: distance from main source to house, adequacy of supply from main source, quantity of water used per person per day, quantity of water purchased per day from vendor, average amount spent on water during dry season, main source of domestic water used by households, access to improved source of water, infestation through water-borne diseases and performance of supply from the State Water Corporation.
Several other valuations have been done in other areas such as health, air quality improvement, organic food, etc. using the CVM. Asenso-Okyere et al. [19] used the CVM and the ordered probit model to estimate the WTP for health insurance in Ghana and established that households’ WTP is influenced by dependency ratio, income, sex, health care expenditure and education. Over 90% of respondents agreed to join the scheme and up to 63.6% were willing to pay a premium of $3.03 a month for a household of five persons. Others include Afroz et al. [20] , Rodriguez et al. [21] , Asfaw et al. [22] and Asafu-Adjaye and Dzator [23] .
In summary, the CVM has widely been used and proves to be a useful tool for valuing non-marketed goods in both developed and developing countries as well as having the capacity to estimate both use and non-use values and thus could be a useful tool for valuing potable water provision in the Accra-Tema metropolis. The literature also shows that factors that influence WTP for potable water supply include income, gender, education, time spent to fetch water from existing source, perceived quality of existing water supply, marital status, among others. These factors will therefore form the basis for the choice of explanatory variables for the WTP.
3. Methodology
3.1. Empirical Framework
The empirical framework follows that of Cranfield and Magnusson [24] . WTP is a multiple response variable and therefore ordered qualitative response model is used. Using a latent variable, the WTP equation can be written as Equation (4):
 (1)
(1)
where WTP* is the household’s latent WTP, X is a vector of observable factors that influence utility, ß is the coefficient vector and ε is an independently and identically distributed error term with mean zero and variance one.
A household’s WTP is given a numerical value that indicates the category in which its unobserved WTP falls if WTP* lies within a certain range. Specifically, WTP = i − 1 for all i = 1, ..., I, if , where i is the WTP categories chosen by the household and
  are category threshold parameters which take values from
  and correspond to points at which the utility change is high enough to entice a household to be willing to pay more for the choice made. The parameters are estimated statistically and
  is set equal to zero during estimation. We therefore write the probability of a household’s WTP falling in one of the finite categories as Equation (5):
 (2)
(2)
for every .
.  is the cumulative density function (CDF).
The CDF is usually assumed to be a logistic or standard normal density function. Both densities are similar in shape and estimations obtained using the two models are quite similar according to Green [25] . We employ the standard normal density which implies that the resulting probability model is the ordered probit. The ordered probit model permits the computation of predicted probabilities for every WTP category and marginal effects. Predicted probabilities using the means of the data, show the likelihood of the average household being WTP an amount falling within each of the categories. This enables us to gauge the level of households’ WTP for potable water supply. These estimated parameters are also used to compute the marginal effects which indicate how a change in an explanatory variable affects the predicted probability that household are willing-to-pay for each of the WTP groups. Summary of the deterministic statistics of the explanatory variable considered has been provided as Table 1.

Table 1. Summary of deterministic statistics of explanatory variable.
Source: Authors’ Survey, 2012.
3.2. Data and Methods
In Ghana, potable water supply is practically not available to households. This implies that real decision by households on how much they are prepared to pay for potable water supply cannot be observed. We therefore developed a contingency valuation survey to gather consumers’ WTP for potable water supply.
The survey was undertaken in the Accra-Tema metropolitan area. A two-stage sampling technique was used. In the first stage, the population was stratified into two: areas with critical2 water supply problems (water flows two days in a week at most and up to five hours in a day) and areas where water supply was believed not to be critical3 (water flows up to five days in a week and twelve hours in a day) based on the work of WaterAid [3] . Inclusion of these areas was to capture all the different areas and levels of water provision to reduce biases associated with sampling. The t-test for the equality of the mean WTP and the Lenene’s test for the equality of the variance showed that there is no difference between the critical and non critical areas, indicating the non relevance of running separate regression for the two areas.
While admitting that a larger sample size would have been better, the sample size of 340 used was enough to bring out the nature of water supply and the WTP. Allocation of the sample to the critical (153 questionnaire) and non-critical (187 questionnaire) areas was also based on the work of WaterAid [3] which indicates that about 55 percent of the population in the metropolis are in non-critical areas while the remaining 45 percent are in critical areas. However twenty five of the responses (3 from the critical and 22 from the non-critical) were rejected resulting in a total sample size of 315. Simple random sampling technique was used to select the households interviewed in the second stage. A pre-survey was undertaken to obtain an understanding of the current water situation. The questionnaire developed was presented in these areas and a number of revisions made in areas where respondents appeared to have difficulty.
The main survey started in the first week of December, 2013 and continued for about three weeks. The questionnaire was administered to households through face-to-face interviews elicitation method. Specifically, the interviewer creates a hypothetical scenario of potable water supply - good quality water which is safe for all household purposes including drinking and available constantly in the premises of the household, and where the household will be asked to make monthly payment based on the volume of water consumed. The policy change therefore is a shift from the current water supply to potable water supply. Once the scenario is presented, respondents are asked questions about their WTP for a bucket (17.5 litres) of this potable water supply using the single-bounded dichotomous choice elicitation method in which the interviewer proposes an amount for the respondent to pay. Figure 1 shows the bids which were determined based on initial consultation and the frequency of respondents interviewed per bid.
This elicitation format even though has been criticised for providing limited information has the potential to test for starting point bias since the insignificance of the initial bid could indicate the absence of starting point bias. STATA econometric software was used to analyse the data.
4. Results and Discussion
4.1. Descriptive Analysis
The results indicate that 51.4% of the respondents were male while 48.6% were females. The average household size was found to be 5.2. With respect to education, about 6.0% of the respondents did not have formal education, 31.4% had basic education, 32.7% had secondary education and the remaining 29.9% had tertiary education.
Concerning the age distribution of respondents, 25.1% of the respondents were below the age of 29 years, 28.6% were between 30 and 39 years, 29.5% were aged between 40 and 49 years, 13.6% were between 50 and 59 years and the rest (3.2%) were above 60 years. About 68.9% of the respondents were married while the rest were single, divorced or widowed. To investigate household’s preferences of social amenities, respondents were asked to rank 6 different social services, including water in order of increasing importance. About 41.3% ranked water supply as their first priority, followed by health (22.9%), education (20.6%), sanitation (7.6%), electricity (6.0%) and road (1.6%), indicating that water supply is the most important social service in the Accra-Tema metropolis.
From the Table 2, it could be seen that about 84%4 of the respondents reported of using water from the
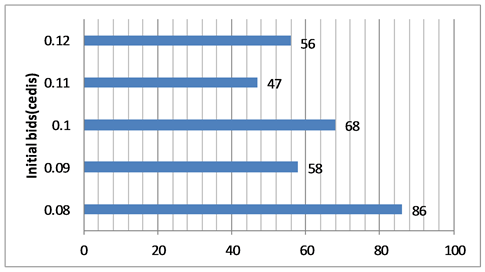
Figure 1. Initial bids and frequency of respondents interviewed per bid. Source: Authors’ Survey, 2012.
Table 2. Households main source of water.
Source: Authors’ Survey, 2012.
GWCL with about 45.1% having private piped water or shared piped water on compound. This result, to some extent, confirms the findings of Abraham et al. [2] who established that about 80% of households in the metropolis have access to water but only 45% have a household connection or at best a yard connection. Only 16.5% reported of using water from boreholes and dug wells as their main source of water (Table 2). Not surprisingly all the respondents expressed a WTP for the potable water supply indicating that the price increase at least does not lower utility beyond the base level as predicted. The simple mean WTP for the 315 respondents who expressed their WTP for the potable water supply was ¢0.10 per bucket and was quite equal to the median and modal WTP.
A look at the mean WTP of ¢0.10 and the current prices paid by different users, suggest that actually the consumers are going to pay more if the water system is improved. Private piped, shared piped and public taps water users are supplied by the GWCL. Comparison of the expressed WTP and what they are currently paying indicate that they are willing to pay about 7 more. Tanker operators mainly obtain water from depots of the GWCL but have to incur additional cost of transporting the water to households. Information from the survey indicate that these categories of users on the average currently pay about ¢0.16, implying that the MWTP of ¢0.10 will be quite acceptable to them. Also, boreholes and well users on the average currently pay about ¢0.09 and ¢0.04 for a bucket of water which is lower than the mean WTP of ¢0.10.
Evidently, in the midst of inadequate government investment, households are willing to pay more for potable water supply once the service is improved. The policy implication for reducing the acute water supply deficit therefore is to improve the service by making some initial investments that may improve efficiency and supply and ask consumers to pay through increased tariffs.
Almost all respondents who had in-house piped water also had an alternative source of water supply, possible as a result of the irregular provision of water by the GWCL. The maximum, minimum and the mean number of days that respondents get water in a week were 5, 1 and 3.4 respectively. Furthermore, of the 45.1 % of respondents who have private piped and shared piped water on the compound, 14.8% had water at most 4 hours in a day, 54.9% had water between 4 and 8 hours in a day while the remaining (30.3%) had water for more than 8 hours in a day. One major complaint of the respondents was that water sometimes flows during the night when they are asleep or during the day when they are at work.
Out of the 54.9% of respondents who are not using in-house5 water supply systems, about 78.6% reported of not having access, 5.8% claim they cannot afford while the remaining (15.6) preferred using alternative sources because they are more reliable. On the average households spend about ¢0.13 per bucket of water from alternative sources and the average monthly water bill is about ȼ41.14 with an average per capita consumption of about 35.5 litres per day using an average household size of 5.15 persons. The level of satisfaction of respondents of the existing water supply was very low as only 22.0% of the respondents were satisfied with the existing service.
4.2. Estimated Probit Results
In this section the estimated model is evaluated and subsequently, the coefficients and the estimated marginal effects are presented and discussed. Test for multicollinearity using the Variance Inflation Factor (VIF) (Appendix 1) indicate that all the regressors and the overall mean (2.19) are less than 10 indicating that there is no need for further examination and multicollinearity is non-existent in the model. Tolerance values which are used to check on the degree of collinearity were all higher than the threshold value of 0.1 indicating that the variable cannot be considered as a linear combination of other independent variables. The Likelihood Ratio (LR) test statistic was 388.10 and it is χ2(14) distributed under the null hypothesis that all the variables together have no significant influence on WTP. The critical value for this distribution with α = 0.01 is 30.58, which means that we can reject the null hypothesis. The Pseudo R-square was found to be 0.3247 higher than the lower bound of 0.15 and indicates that about 32.47% of the variation is explained. The error term was also found to beindependently and identically distributed.
From the results (Table 3), all the variables had the expected signs. However, current cost of water, household size, reliability of existing water supply source, respondents’ years of stay in the area and initial bid were not significant. Reasons for the non significance of these variables, especially the current cost of water may require additional follow-up studies. Household income is positively related to WTP and significant at 1%. This result is in line with the findings of Aguillar and Sterner [10] , Adjei [12] , Whittington et al. [26] and Fissha [15] .
Table 3. Results of ordered probit estimation.
Source: Authors’ Estimation, 2012.
As expected, marital status has a positive sign which is consistent with the findings of Fissha [15] . Also, households using better sanitation facility (flush toilet) are more likely to pay for potable water supply than those using other facilities due possibly to the problems associated with the use of flush toilet when there is no water. This outcome is consistent with the findings of Fissha [15] .
Household’s perception of the quality of existing water was negative and significant at 5% levels. This result is in line with the findings of the World Bank [7] , Adjei [12] and Fissha [15] . Also, the more time a household spends in collecting water, the more likely it would pay for potable water supply as indicated by the statistically significant positive sign, a result consistent with that of the World Bank [7] and Appau-Danso [14] . The significance of the sex variable indicates that men are more likely to pay for potable water supply than women and this supports the work of World Bank [7] . With regards to education, tertiary education and secondary education are statistically significant at 1% and 5% respectively but primary education is not statistically significant even at the 10% levels. The magnitude of the coefficients (0.27051 for Basic, 0.56093 for Secondary and 1.19272 for Tertiary) indicates that respondents with higher level of education will be much more aware of the health benefits of potable water supply services and are therefore more likely to pay for the services. This is consistent with that of Jordan and Elgnaheeb [9] , World Bank [7] and Noor and Siddiqi [17] .
Results of the marginal effects which show the relative change in probabilities for a unit change in a particular explanatory variable is presented as Table 4. The marginal effects of the “monthly income of respondents” is negative at a price ¢0.02 and ¢0.04 but positive for the other prices. This means that as income increases, the probability of paying ¢0.02 and ¢0.04 for a bucket of water decreases while the probability of being willing to pay ¢0.10 for a bucket of water and above increase. This result underscores the need for increasing incomes if
Table 4. Estimated marginal effects of the ordered probit model.
Source: Authors’ Estimation, 2012.
WTP for water is to be increased.
Similar results can be observed with “Time spent in fetching water from current source” variables. As time spent in fetching water from the current source increases, the probability of paying ¢0.02 and ¢0.06 for a bucket of water decreases while the probability of being willing to pay ¢0.10 for a bucket of water and above increases. The chances are that males would be more willing than females to pay a higher premium (¢0.10 or more) and females will be more willing than males to pay a lower premium (¢0.02 and ¢0.06).
Relative to household heads who have no formal education, the marginal effects of those who have secondary education are negative at a price of ¢0.02 and ¢0.06 per bucket of water but positive at other prices. With respect to household heads with tertiary education, relative to those who do not have any formal education, the marginal effects are negative at a price of ¢0.02, ¢0.06 and ¢0.10 per bucket of water but positive at other prices. As well, the marginal effects are stronger for household heads with tertiary education than those with secondary education, and for those with secondary education than those with basic education. For example, the probability of paying on the average ¢0.14 for a bucket of water is 0.16 (0.317 - 0.161) higher for household heads with tertiary education than those with secondary education while the probability of paying on the average ¢0.14 for a bucket of water is 0.09483 (0.16122 - 0.06639) higher for household heads with secondary education than those with basic education.
Respondents who perceived the current quality of water to be good had a positive marginal effect to pay ¢0.02 and ¢0.06 per bucket of water but a negative marginal effects for other prices relative to those who perceived the current water quality to be poor. The reverse occurs with the sanitation facility of respondents where respondents with better quality sanitary facilities (flush toilets) has negative marginal effects of paying ¢0.02 and ¢0.06 per bucket of water but positive marginal effects for other prices relative to those who have poor quality sanitation facilities. Furthermore, married respondents have a negative marginal effect of paying ¢0.02 and ¢0.06 per bucket of water but positive marginal effects for other prices relative to those who are not married.
5. Conclusions and Recommendations
Results from the study indicate that households in the Accra-Tema metropolis are prepared to pay on the average about ¢0.10 for a bucket of potable water supply which is higher than what all categories of users are paying for water currently apart from those obtaining water from Tanker Operators. For those having private piped water, shared piped water on compound and public taps, this figure is about 7 times more than what they are paying currently. An econometric analysis of the factors that influence households WTP indicates that income, time spent to fetch water from existing source, level of education, sanitary facility, perceived quality of current water supply, sex of the respondent, marital status are the main factors influencing households WTP for potable water supply services in the metropolis.
It is therefore recommended that government should invest in infrastructure in the water sector and increase tariffs since inhabitants in the metropolis are prepared to pay about 7 times more than what they are paying now if they will be provided with potable water supply. Evidently, it is not possible to obtain funds for the huge capital investment required in the sector. Government can then select some areas of the metropolis based on social or other objectives to pilot the project of providing potable water supply. This could be up-scale based on lessons from the pilot. Such social objectives could include areas where time spent to fetch water from existing sources is high, where sanitation facilities are available, where perceived quality of current water supply is bad since they all have positive correlation with WTP.
Based on the findings, we recommend an improvement in the water supply service if the country is interested in improving sanitation since there is a strong positive relationship between availability of sanitation facility and WTP for potable water supply services. Enhancement and improvement in education is also recommend since the more educated a person is, the more he is prepared to pay for potable water services. Broader policies aimed at increasing incomes are also important since increased incomes have a positive relation with WTP.
Cite this paper
Daniel KwabenaTwerefou,Kwadwo A.Tutu,EboBotchway,SamuelDarkwah, (2015) Willingness-to-Pay for Potable Water in the Accra-Tema Metropolitan Area of Ghana. Modern Economy,06,1285-1296. doi: 10.4236/me.2015.612122
References
- 1. World Health Organisation (2006) Country Health System Fact Sheet 2006, Ghana.
http://www.afro.who.int/index.php?option=com_docman&task=doc_download&gid=37 - 2. Abraham, E.T., van Rooijen, D., Cofie, O. and Raschid-Sally, L. (2007) Planning Urban Water-Dependent Livelihood Opportunities for the Poor in Accra, Ghana. SWITCH Scientific Meeting, International Water Management Institute, Accra.
- 3. WaterAid (2005) National Water Sector Assessment, Ghana. www.wateraid.org.
- 4. Labite H., van der Steen, P. and Lens P. (2008) Analysis of Health Benefits versus Costs of Interventions in the Urban Water System in Accra, Using Quantitative Microbial Risks Assessment. WaterMill Working Paper Series, Vol. 14, 8.
- 5. Brookshire, D.S. and Whittington, D. (1993) Water-Resources Issues in the Developing-Countries. Water Resources Research, 29, 1883-1888. http://dx.doi.org/10.1029/92WR02988
- 6. Pearce, D.W., Adger, W.N., Brown, K., Cervigni, R. and Moran, D. (1993) Mexico Forestry and Conservation Sector Review: Sub study of Economic Valuation of Forests. Report by SCERGE, University of East Anglia and University College London, for the World Bank, Latin America and the Caribbean Country Department LA2, Washington DC.
- 7. World Bank Water Demand Research Team (1993) The Demand for Water in Rural Areas: Determinants and Policy Implications. The World Bank Research Observer, 8, 47-70.
http://dx.doi.org/10.1093/wbro/8.1.47 - 8. Boadu, F.O. (1992) Contingent Valuation for Household Water in Rural Ghana. Journal of American Economics, 43, 548-465. http://dx.doi.org/10.1111/j.1477-9552.1992.tb00239.x
- 9. Jordan, J.L. and Elnagheeb, A.H. (1993) WTP for Improvement in Drinking Water Quality. Water Resources Research, 29, 237-245. http://dx.doi.org/10.1029/92WR02420
- 10. Aguilar, M. and Sterner, T. (1995) WTP for Potable Communal Water Services. EEU Working Papers, Gothenburg University, Gothenburg.
- 11. Bah, I. (1997) Estimating Household’s Valuation for Potable Water Supply Service in Urban Areas: The Case of Freetown, Sierra Leone. Unpublished Master’s Dissertation, University of Botswana, Gaborone.
- 12. Adjei, P.O. (1999) WTP for Potable Water Services: Contingent Valuation Method for Greater Accra Metropolitan Area. An Unpublished Master’s Thesis, University of Ghana, Accra.
- 13. Calkins, P., Larue, B. and Vézina, M. (2002) WTP for Drinking Water in the Sahara: The Case of Douentza in Mali. Cahiers d’économie et sociologie rurales, No. 64, 38-56.
- 14. Appau-Danso, E. (2004) WTP for Potable Water Supplies in Rural Communities. A Case Study of the Asante Akim South District. An Unpublished Master’s Thesis, University of Ghana, Accra.
- 15. Fissha, M. (2006) Household Demand for Potable Water Service in Urban Areas: The Case of Addis Ababa, Ethiopia. Unpublished Master’s Thesis, Addis Ababa University, Addis Ababa.
- 16. Adepoju, A.A. and Omonona, B.T. (2009) Determinants of WTP for Potable Water Supply in Osogbo Metropolis; Osun State, Nigeria. Research Journal of Social Sciences, 4, 1-6.
- 17. Noor, J.A. and Siddiqi, W. (2009) Estimation of WTP for Improvement in Drinking Water Quality: A Study of Wasa, Lahore. Economics Bulletin, 29, A19.
- 18. Olajuyigbe, A.E. and Fasakin, J.O. (2010) Citizens’ WTP for Potable Sustainable Water Supply in a Medium-Sized City in South Western Nigeria. Current Research Journal of Social Sciences, 2, 41-50.
- 19. Asenso-Okyere, W.K., Osei-Akoto, I. and Appiah, E.N. (1997) WTP for Health Insurance in a Developing Economy. A Pilot Study of the Informal Sector of Ghana Using Contingent Valuation. Health Policy, 42, 223-237. http://dx.doi.org/10.1016/S0168-8510(97)00069-9
- 20. Afroz, R., Hassan, M.N., Awang, M. and Ibrahim, N.A. (2005) WTP for Air Quality Improvement in Klang Valley, Malaysia. American Journal of Environmental Sciences, 1, 194-201.
http://dx.doi.org/10.3844/ajessp.2005.194.201 - 21. Rodriguez, E., Lacaze, V. and Lupin, B. (2007) WTP for Organic Food in Argentina: Evidence from a Consumer Survey. School of Economic and Social Sciences, Universidad Nacional de Mar del Plata, Mar del Plata.
- 22. Asfaw, A., Gustafsson-Wright, E. and van der Gaag, J. (2008) WTP for Health Insurance: An Analysis of Potential Market for New Low Cost Health Insurance Products in Namibia. AIID RS 08-01/2.
- 23. Asafo-Adjaye, J. and Dzator, J. (2003) WTP for Malaria Insurance: A Case Study of Households in Ghana Using the Contingent Valuation Method. Economic Analysis and Policy, 33, 31-47.
http://dx.doi.org/10.1016/S0313-5926(03)50003-0 - 24. Cranfield, J.A.L. and Magnusson, E. (2003) Canadian Consumer’s Willingness-to-Pay for Pesticide Free Food Products: An Ordered Probit Analysis. International Food and Agribusiness Management Review, 6, 13-30.
- 25. Greene, W.H. (2008) Econometrics Analysis. Sixth Edition, Prentice Hall, Upper Saddle River.
- 26. Whittington, D., Briscoe, J., Mu, X. and Barron, W. (1990) Estimating the WTP for Water Services in Developing Countries: A Case Study of the Use of Contingent Valuation Surveys in Southern Haiti. Economic Development and Cultural Change, 38, 293-311. http://dx.doi.org/10.1086/451794
Appendix 1. VIF multicollinearity test results.
NOTES

1Potable water supply means good quality water which is safe for all household purposes including drinking and available constantly in the premises of households

2Adenta, Madina, Haatso, Dome, Accra New Town.
3Achimota, Awoshie, Tema, Mempeasem.

4This is the sum of the percentages of those using private piped water, shared piped water in compound, public taps and tanker operator.

5Those not using in-house water supply system include those who use public taps, tanker operated water supply, boreholes and wells.