Journal of Biomedical Science and Engineering
Vol.6 No.4(2013), Article ID:30532,4 pages DOI:10.4236/jbise.2013.64064
On the basis of the morphology of the T-wave alternans: A Poincare mapping method research
![]()
College of Physics and Electronics, Shandong Normal University, Jinan, China
Email: *zhaojie286@gmail.com
Copyright © 2013 Hui Guo et al. This is an open access article distributed under the Creative Commons Attribution License, which permits unrestricted use, distribution, and reproduction in any medium, provided the original work is properly cited.
Received 4 December 2012; revised 1 February 2013; accepted 15 February 2013
Keywords: T-Wave Alternans; Poincare Mapping Method; Spectral Method; Vector Angle Index (VAI)
ABSTRACT
Presently T-wave alternans (TWA) has become a clinical index of non-invasive diagnosis for heart sudden death prediction, and detecting T-wave alternate accurately is particularly important. This paper introduces an algorithm for detecting TWA using Poincare mapping method which is a technique for nonlinear dynamic systems to display periodic behavior. Sample series of beat to beat cycles were selected to prepare Poincare mapping method. Vector Angle Index (VAI), which is the mean of the difference between  (the angle between the line connecting the i point to the origin and the X axis) and 45 degrees was used to present the presence or absence of TWA. The value of 0.9 rad ≤ VAI ≤ 1.03 rad is accepted as a level determinative for presence of TWA. VAI via Poincare mapping method (PM) is used for correlation analysis with T-wave alternans voltage (Vtwa) by way of the spectral method (SM). The cross-correlation coefficient between Vtwa and VAI is γ = 0.8601. The algorithm can identify the absence and presence of TWA accurately and provide idea for further study of TWA-PM.
1. INTRODUCTION
A number of studies recently indicate that ventricular arrhythmias are one of the primary causes of cardiac death, and the microvolt T-wave alternans (MTWA) is an important index for ventricular arrhythmias prediction. TWA is a phenomenon of electro cardio variation that beat to beat variation of T-wave morphology and polarity at constant heart rate is embodied in neat cardiac rhythm [1].
In accordance with the statistical method difference of TWA detection, the methods with pathologic significance of detecting MTWA are divided into three kinds: Short Time Fourier Transform (STFT), symbol transform and nonlinear methods [2]. The Spectral method (SM) which is one kind of STFT is the most mature. Nonlinear methods include Poincare mapping (PM), moving average (MMA) method, etc.
The article presents the Poincare mapping (PM) [3] based on nonlinear dynamic theory to detect MTWA and compares the result with that of Spectral method. The result is proved to be of Strong correlation between both of the quantitative index. The main process for TWA detection is as follows: marr wavelet transform based on the a’trous algorithm was adopted to select feature points from Electrocardiograph (ECG), and QT interphase measurement formula was used for improving the T-wave analysis window. Then spectral method and Poincare mapping were carried out on detecting TWA, and we can attain the figures of simulation results of power spectra and Poincare maps and their quantitative indexes namely Vtwa (of SM) and VAI (of PM). This algorithm was applied in MIT/BIH Arrhythmia database and European ECG ST-T database, and the cross-correlation coefficient between Vtwa and VAI is ã = 0.8601.
2. METHOD
2.1. ECG Preprocessing
Firstly, the measured ECG S was filtered, and in this paper, integral coefficient was used to eliminate 50 HZ power-line interference, and then the signal was filtered using threshold denoising algorithm by applying bior 2.2 wavelet [4]. In reference to the a’trous algorithm, the marr wavelet transform was carried out in one to four scales and ,
,  can be observed [5]. The
  represented wavelet detail part, while
  represented wavelet approximation part. Marr wavelet is second derivative wavelet basis, so the peak points after being transformed were the same as those in the original signal.
2.2. T-Wave Alternans Detection
With the aim of detecting MTWA more accurately, this article adopts a T wave analysis window method that L = 128 ECG complex was selected for TWA measurement and there were m = 7 sampling points in every cardiac cycle [6]. The starting point of the T-wave window was located at  after the R peak, and QT interphase measurement formula was used for determination of the point terminating the T-wave analysis window as formula:
 (1)
(1)
The T-wave analysis window was divided equally into m parts in a cardiac cycle, and the sampling interval was ID between two sampling points [7]. Accordingly, the sampling point  can be attained as equation:
 (2)
(2)
In line with the (1) and (2), 7 × L selected samples of T-wave can be get across L consecutive heartbeat cycle and 7 sampling points in a cardiac cycle. At the same time, we obtain a set of signal samples , and a new sequence with subtraction between adjacent samples
  is formed. When the sequence of feature point
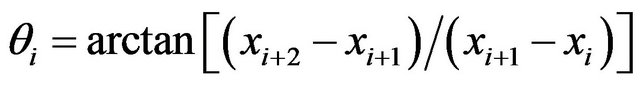
  was known [8], the Poincare maps could be drawn in two ways: one was constructed by
  vs
vs , the other was constructed by plotting second-order different plots
  vs
vs , in which i was the index identifying beat number [9]. The congregating distribution of the Poincare maps can be shown and the different shapes and quantitative indexes from which we can get the information we want. A sample VAI measurement between clusters to quantify TWA by way of Poincare map is proposed:
 (3)
(3)
 (4)
(4)
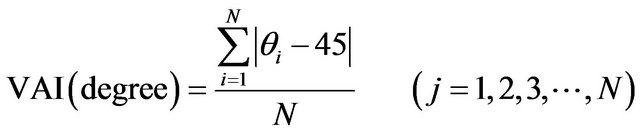
Among them, and  denoted the angle between the line connecting the i point to the origin and the X axis; N was the total point of Poincare map. Used for Matlab simulation, 45 degrees were turned into radian system namely for 0.7854. VAI value denoted the dispersed degree of the adjacent T-wave amplitude difference along the 45˚ line. When vector angle index is 0.9 rad ≤ VAI ≤ 1.03 rad, TWA was present in the ECG signal. When VAI < 0.9 rad or VAI > 1.03 rad, there was no TWA. Poincare maps for T-wave detection are shown in Figure 1.
Spectral method (SM) widely applied to the current detection of TWA is a frequency domain analysis method, and has high accuracy [10]. This paper compared the result of detection by means of Poincare map namely VAI with that of detection by way of Spectral method that is Vtwa, and the correlation analysis proved the effectiveness of PM. Spectral method for T-wave detection are shown in Figure 2.
3. RESULTS
In the article, we adopted MIT/BIH Arrhythmia database and European ECG ST-T database. The sampling fre-
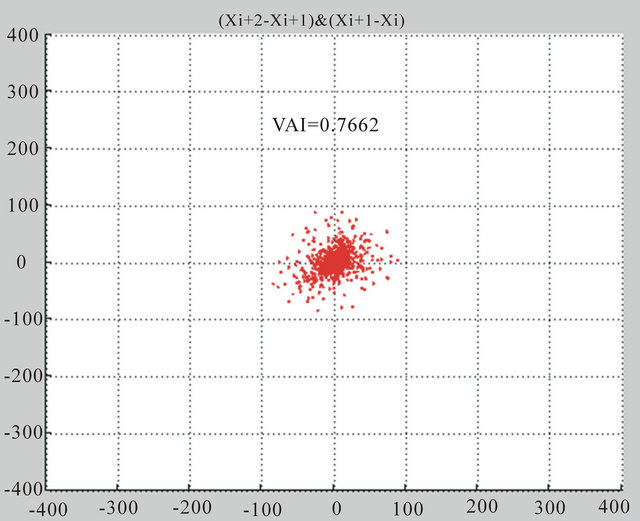
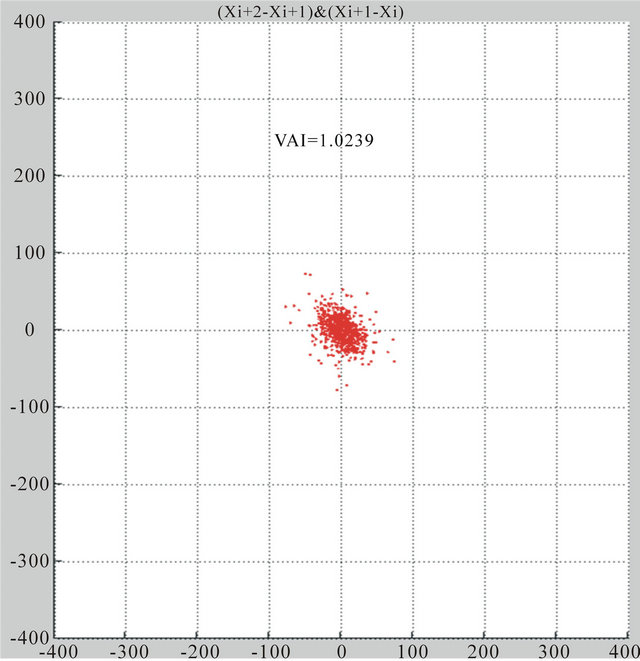
Figure 1. Absence and presence for T-wave alternans Poincare mapping.
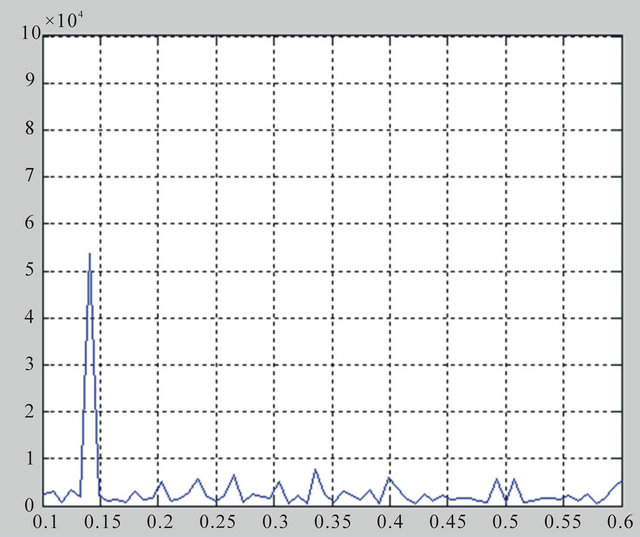
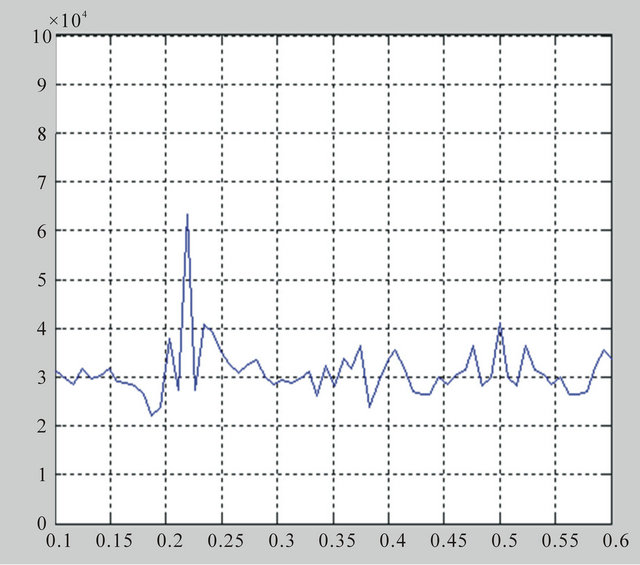
Figure 2. Absence for T-wave alternans Vtwa = 0 and presence Vtwa ≠ 0.
quency in former was 360 HZ while in the latter 250 HZ. For purposes of brevity, the signal from these databases was resampled with 200 HZ so that the analysis became simpler. We showed part of the simulation results in Table 1. All the datas were from channel 1.
From the following data in Table 1, a significant correlation was found between the alternans voltage determined by the SM and the vector angle index calculated by the PM, and the cross-correlation coefficient between Vtwa and VAI is γ = 0.8601. In the Matlab7.0 environment, the discrete data Vtwa and VAI in Table 1 were operated by means of Curve Fitting Tool. A curve relation was found as following equation:
 (5)
(5)
The fitting curve of Vtwa and VAI are shown in Figure 3. The fitting curve R-square is 0.867.
Table 1. Simulation data of some samples.
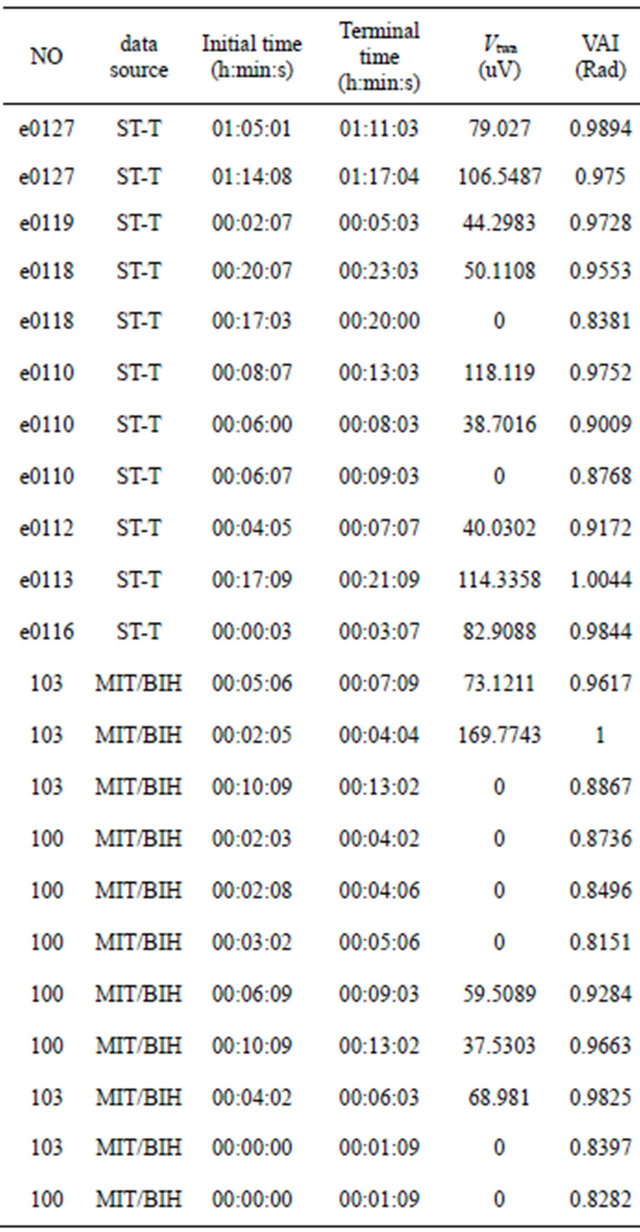
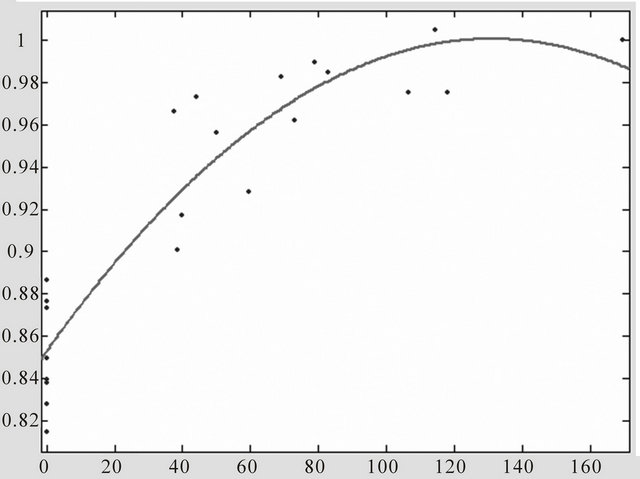
Figure 3. Vtwa and VAI curve fitting.
4. CONCLUSION
According to a lot of the simulation data results, we accepted that the presence of TWA by way of PM is determined on the basis of 0.9 rad ≤ VAI ≤ 1.03 rad. Because of the cross-correlation coefficient between Vtwa and VAI 0.8601, the strong correlation between VAI via PM and Vtwa by means of the mature method of SM is proved. At the same time, it is also shown that Vector Angle can be applied to TWA detection. SP demands the complex of plenty of beat-to-beat circles to detect the presence or absence TWA accurately. By way of PM T-wave alternans voltage between any adjacent beats can be get, and Compared with SP, PM is more simpler [11]. Because the application of PM in heart rate variability has become more mature, we can also get some T-wave alternans statistical information from the area of PM [12], and then whether the area index can reflect the characteristics of nonlinear mechanics TWA quantitative information remains to be established.
5. ACKNOWLEDGEMENTS
This project was supported by Shandong Provincial Nature Science Foundation (ZR2010M020) and Shandong Provincial Key Scientific and Technological Project (2007GG10001018).
REFERENCES
- Janusekl, D., Karczmarewicz, S., et al. (2008) T-wave alternans influence on vectocardiographic parameters. Computers in Cardiology, 35, 327-328.
- Martinez, J.P. and Olmos, S. (2005) Methodological principles of T-wave alternans analysis: A unified framework. IEEE Transactions on Biomedical Engineering, 52, 599-613. doi:10.1109/TBME.2005.844025
- Pawel, S. and Jan, R. (2002) Poincare mapping for detecting abnormal dynamics of cardiac repolarization. IEEE Engineering in Medicine and Biology, 1-2, 62-65.
- Zhao, J., Han, Q.Y., et al. (2003) Reseach on the mobile monitor of life. Ph.D. Thesis, Beijing University of Technology, Beijing.
- Wei, L., Zhao, J., Xu, F.Z., et al. (2009) Reseach on detecting the nonstationary T-wave aternans (TWA) based on correlation method. Progress in Binomedicine, 9, 5151- 3134.
- Li, F., Zhao, J., et al. (2011) Poincare mapping: A potential method for detection of T-wave alternans. The 3rd International Conference on Bioinformatics and Biomedical Technology, Sanya, 188-191.
- Xu, F.-Z., Zhao, J., et al. (2010) Poincare mapping method for T-wave alternans using a nonlinear dynamic system. Journal of Clinical Research, 14, 1645-1648.
- Strumilo, P. and Ruta, J. (2002) Poincare mapping for detecting abnormal dynamics of cardiac repolarization. IEEE Engineering in Medicine & Biology, 1-2, 62-65. doi:10.1109/51.993195
- Jan, R. and Pawel, S. (2001) Usefulness of the Poincare mapping in detection of T-wave althernans in precordial leads of standard ECG—a comparision with the spectral method. Diagnostics and Medical Technology, 7, 471- 476.
- Zhang, Z.G., Zhang, J.X. and Li, C.Y. (2007) Development of the T-wave alternans. International Journal of Biomedical Engineering, 30, 181-186.
- Parker, T.S. and Chua, L.O. (1989) Premature numerical algorithms for chaotic systems. Springer-Verlag, New York. doi:10.1007/978-1-4612-3486-9
- Xu, Z., Ge, J.G. and Xu, Q.P. (2007) Based on the RR period second derivative difference heart rate variability analysis of Poincare mapping method. Journal of Southeast University, 37, 395-398.
NOTES
*Corresponding authors.